
文档内容
1、
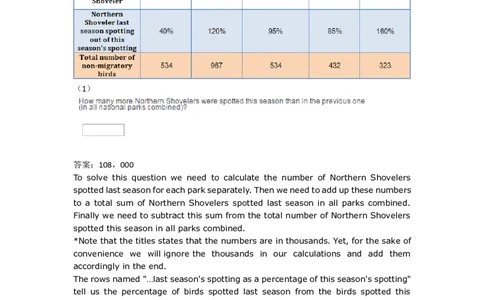
(1)
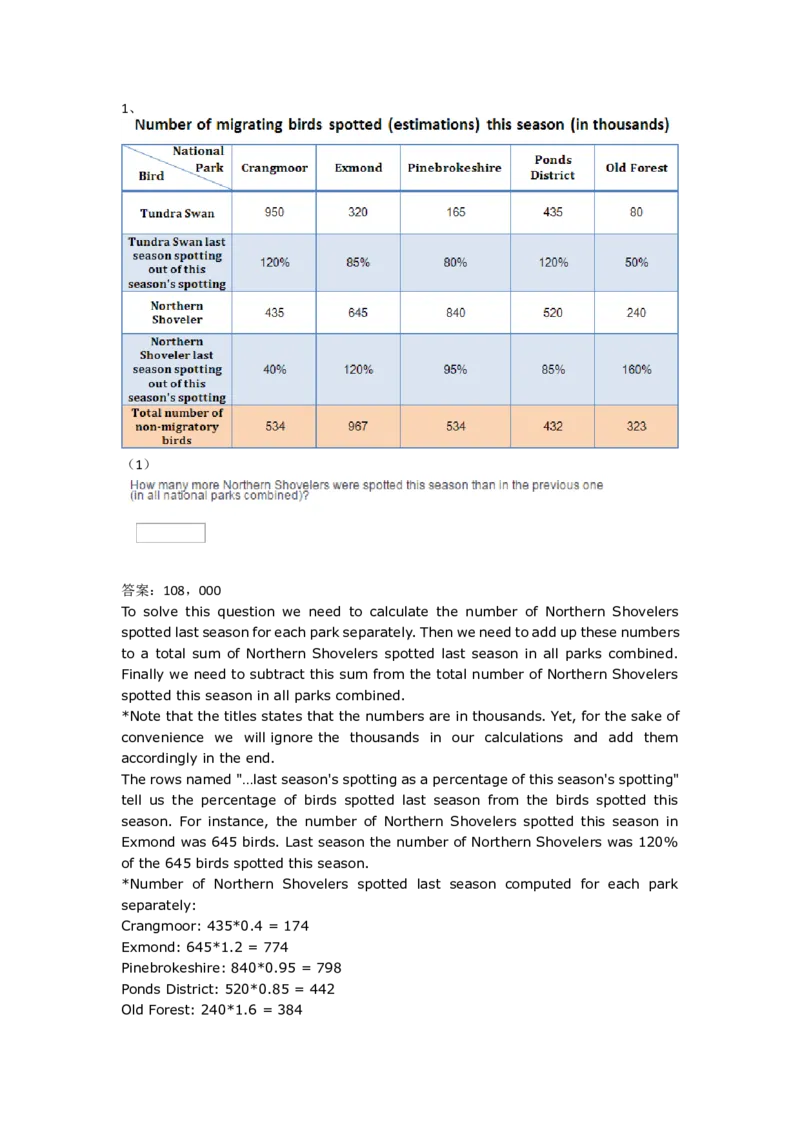
答案:108,000
To solve this question we need to calculate the number of Northern Shovelers
spotted last season for each park separately. Then we need to add up these numbers
to a total sum of Northern Shovelers spotted last season in all parks combined.
Finally we need to subtract this sum from the total number of Northern Shovelers
spotted this season in all parks combined.
*Note that the titles states that the numbers are in thousands. Yet, for the sake of
convenience we will ignore the thousands in our calculations and add them
accordingly in the end.
The rows named "…last season's spotting as a percentage of this season's spotting"
tell us the percentage of birds spotted last season from the birds spotted this
season. For instance, the number of Northern Shovelers spotted this season in
Exmond was 645 birds. Last season the number of Northern Shovelers was 120%
of the 645 birds spotted this season.
*Number of Northern Shovelers spotted last season computed for each park
separately:
Crangmoor: 435*0.4 = 174
Exmond: 645*1.2 = 774
Pinebrokeshire: 840*0.95 = 798
Ponds District: 520*0.85 = 442
Old Forest: 240*1.6 = 384*Total number of Northern Shovelers spotted last season: 174+774+798+442+384
= 2572
*Total number of Northern Shovelers spotted this season (from the table):
435+645+840+520+240 = 2680
*Difference in number of Northern Shovelers spotted: 2680-2572 = 108
*Conclusion: 108,000 more Northern Shovelers were spotted last season
compared to this season
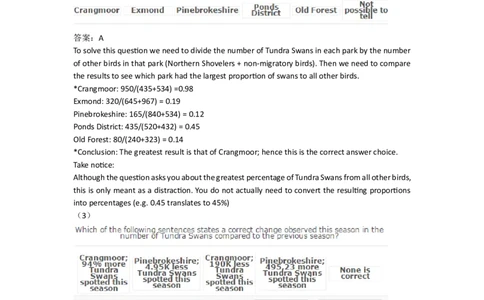
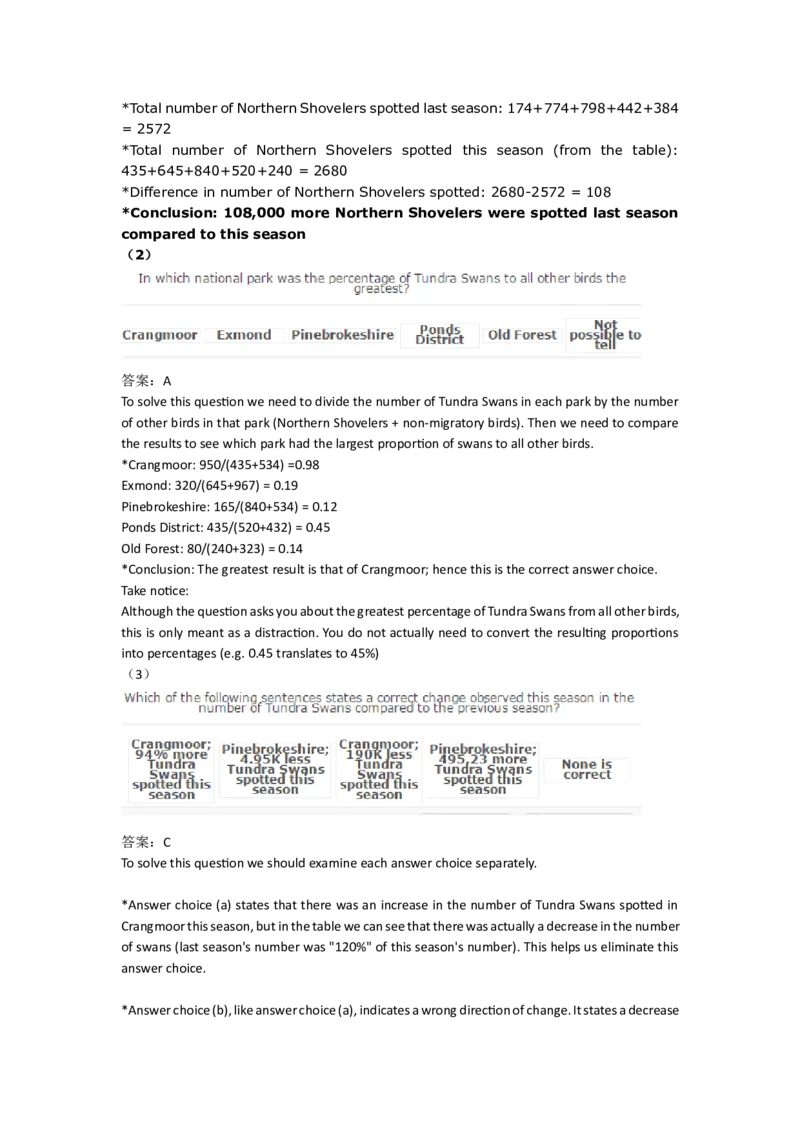
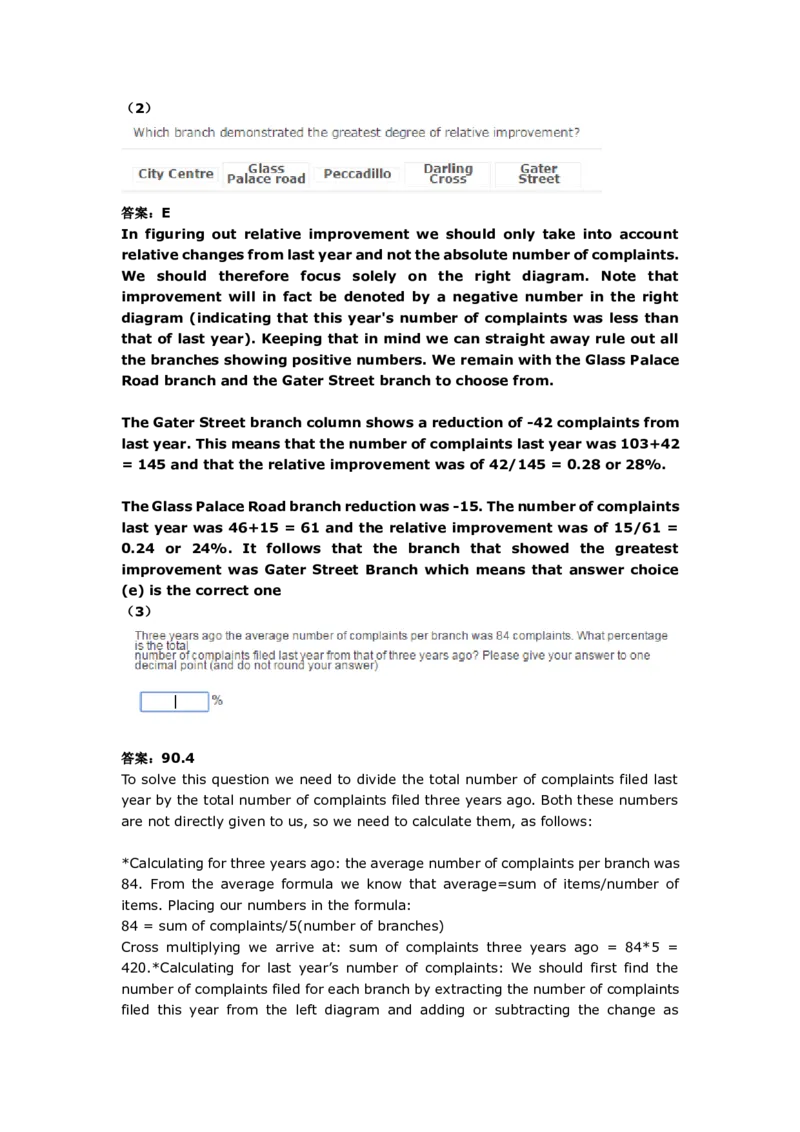
(2)
答案:A
To solve this question we need to divide the number of Tundra Swans in each park by the number
of other birds in that park (Northern Shovelers + non-migratory birds). Then we need to compare
the results to see which park had the largest proportion of swans to all other birds.
*Crangmoor: 950/(435+534) =0.98
Exmond: 320/(645+967) = 0.19
Pinebrokeshire: 165/(840+534) = 0.12
Ponds District: 435/(520+432) = 0.45
Old Forest: 80/(240+323) = 0.14
*Conclusion: The greatest result is that of Crangmoor; hence this is the correct answer choice.
Take notice:
Although the question asks you about the greatest percentage of Tundra Swans from all other birds,
this is only meant as a distraction. You do not actually need to convert the resulting proportions
into percentages (e.g. 0.45 translates to 45%)
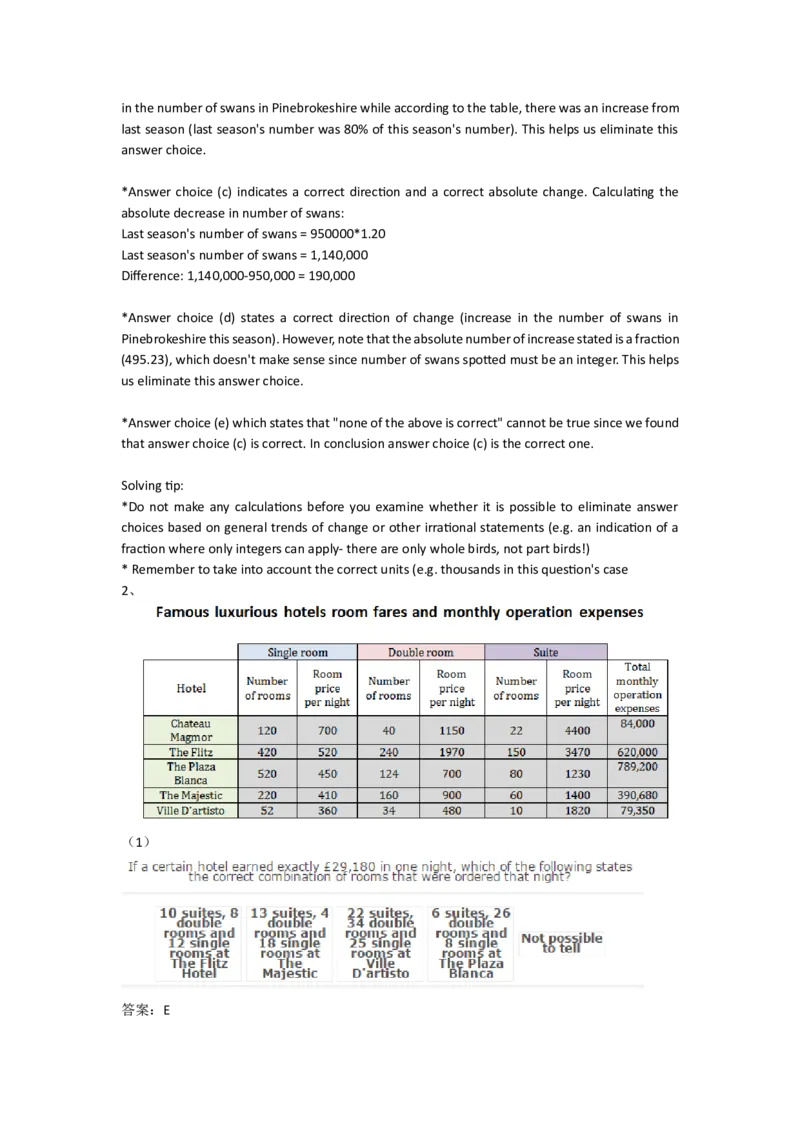
(3)
答案:C
To solve this question we should examine each answer choice separately.
*Answer choice (a) states that there was an increase in the number of Tundra Swans spotted in
Crangmoor this season, but in the table we can see that there was actually a decrease in the number
of swans (last season's number was "120%" of this season's number). This helps us eliminate this
answer choice.
*Answer choice (b), like answer choice (a), indicates a wrong direction of change. It states a decreasein the number of swans in Pinebrokeshire while according to the table, there was an increase from
last season (last season's number was 80% of this season's number). This helps us eliminate this
answer choice.
*Answer choice (c) indicates a correct direction and a correct absolute change. Calculating the
absolute decrease in number of swans:
Last season's number of swans = 950000*1.20
Last season's number of swans = 1,140,000
Difference: 1,140,000-950,000 = 190,000
*Answer choice (d) states a correct direction of change (increase in the number of swans in
Pinebrokeshire this season). However, note that the absolute number of increase stated is a fraction
(495.23), which doesn't make sense since number of swans spotted must be an integer. This helps
us eliminate this answer choice.
*Answer choice (e) which states that "none of the above is correct" cannot be true since we found
that answer choice (c) is correct. In conclusion answer choice (c) is the correct one.
Solving tip:
*Do not make any calculations before you examine whether it is possible to eliminate answer
choices based on general trends of change or other irrational statements (e.g. an indication of a
fraction where only integers can apply- there are only whole birds, not part birds!)
* Remember to take into account the correct units (e.g. thousands in this question's case
2、
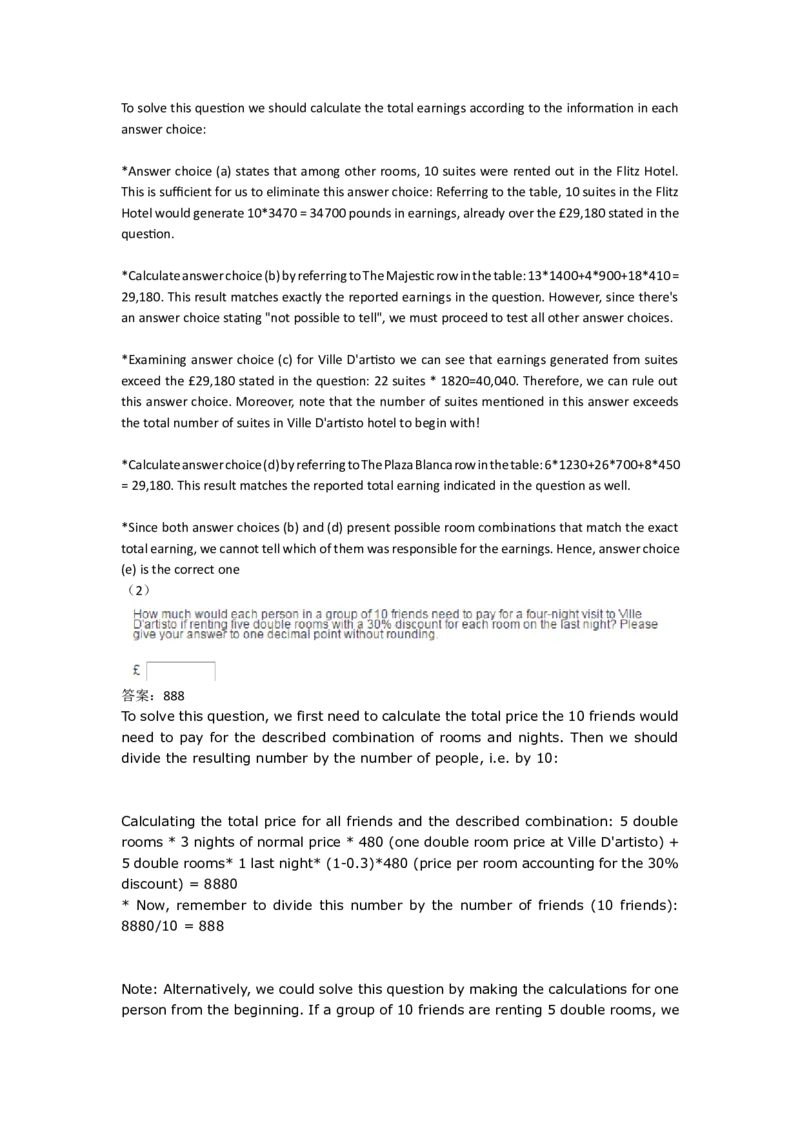
(1)
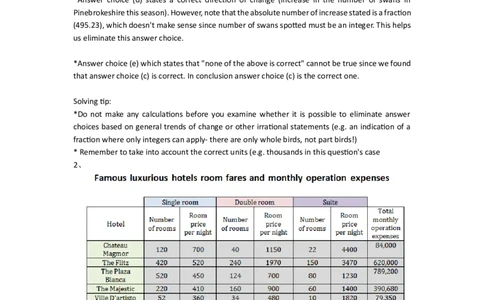
答案:ETo solve this question we should calculate the total earnings according to the information in each
answer choice:
*Answer choice (a) states that among other rooms, 10 suites were rented out in the Flitz Hotel.
This is sufficient for us to eliminate this answer choice: Referring to the table, 10 suites in the Flitz
Hotel would generate 10*3470 = 34700 pounds in earnings, already over the £29,180 stated in the
question.
*Calculate answer choice (b) by referring to The Majestic row in the table: 13*1400+4*900+18*410 =
29,180. This result matches exactly the reported earnings in the question. However, since there's
an answer choice stating "not possible to tell", we must proceed to test all other answer choices.
*Examining answer choice (c) for Ville D'artisto we can see that earnings generated from suites
exceed the £29,180 stated in the question: 22 suites * 1820=40,040. Therefore, we can rule out
this answer choice. Moreover, note that the number of suites mentioned in this answer exceeds
the total number of suites in Ville D'artisto hotel to begin with!
*Calculate answer choice (d) by referring to The Plaza Blanca row in the table: 6*1230+26*700+8*450
= 29,180. This result matches the reported total earning indicated in the question as well.
*Since both answer choices (b) and (d) present possible room combinations that match the exact
total earning, we cannot tell which of them was responsible for the earnings. Hence, answer choice
(e) is the correct one
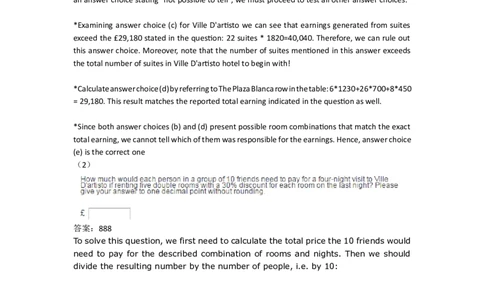
(2)
答案:888
To solve this question, we first need to calculate the total price the 10 friends would
need to pay for the described combination of rooms and nights. Then we should
divide the resulting number by the number of people, i.e. by 10:
Calculating the total price for all friends and the described combination: 5 double
rooms * 3 nights of normal price * 480 (one double room price at Ville D'artisto) +
5 double rooms* 1 last night* (1-0.3)*480 (price per room accounting for the 30%
discount) = 8880
* Now, remember to divide this number by the number of friends (10 friends):
8880/10 = 888
Note: Alternatively, we could solve this question by making the calculations for one
person from the beginning. If a group of 10 friends are renting 5 double rooms, weknow there are two people in a room (this could be extracted from the word
'double'). The price for a room per night in Ville D'artisto is 480. For one person, it
would be half the price: 480/2 = 240. We know there is a 30% discount for the last
night, meaning that one will only pay 70% of the rate. 70% of 240 is 7/10*240 =
168. Total: (240*3)+168 = 720+168=888
(3)
答案:C
To solve this question we should follow two steps. First, we need to calculate the average
maintenance cost for one night in a single room in each of the hotels mentioned. We should do
this for each hotel separately by calculating 10 percent of the total monthly operation expenses
(single rooms' maintenance expense) and then dividing the resulting figure by the number of
rooms. In the second step we need to calculate the difference between the two maintenance costs
(of a single room in each hotel):
*For The Majestic hotel- one single room maintenance cost = 0.1 (10 percent)* 390,680 (total
monthly operation expenses)/220 (number of single rooms in the Majestic) = £177.58 (average
maintenance cost for one single room)
*Following the same procedure, this time for The Flitz: 0.1*620,000/420 = £147.61
*The difference between the two figures = 177.58-147.61 = £29.97
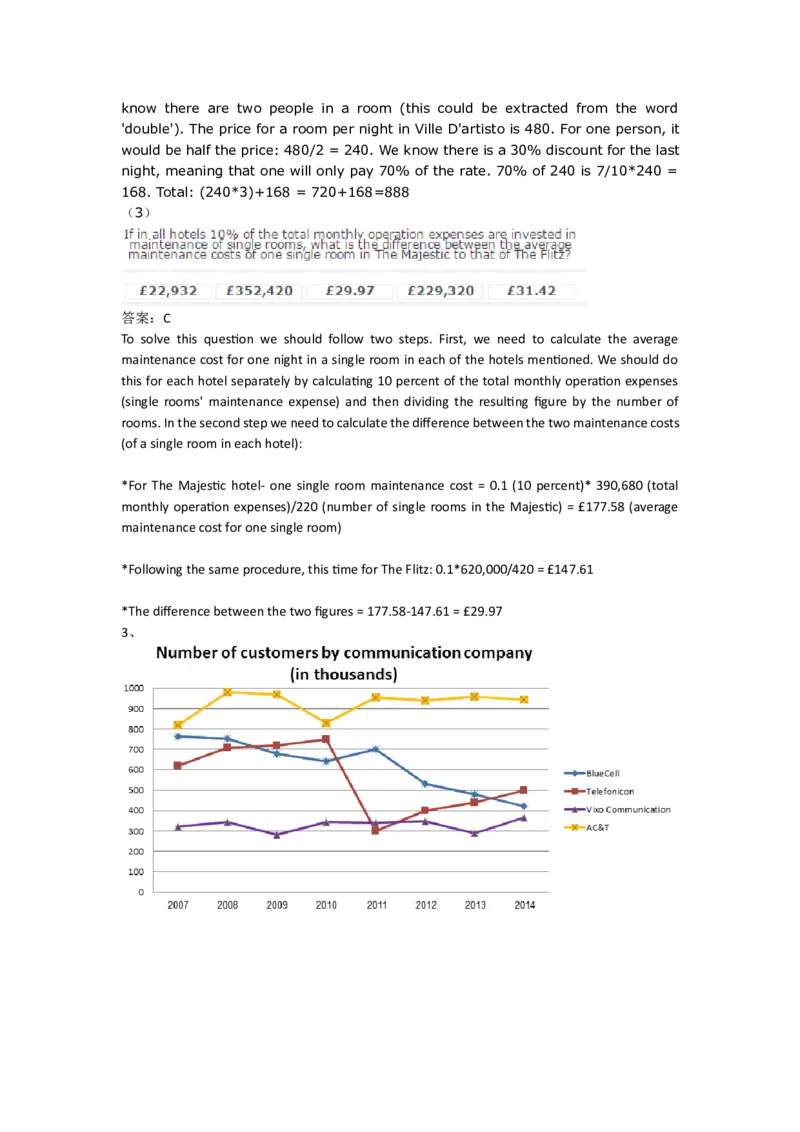
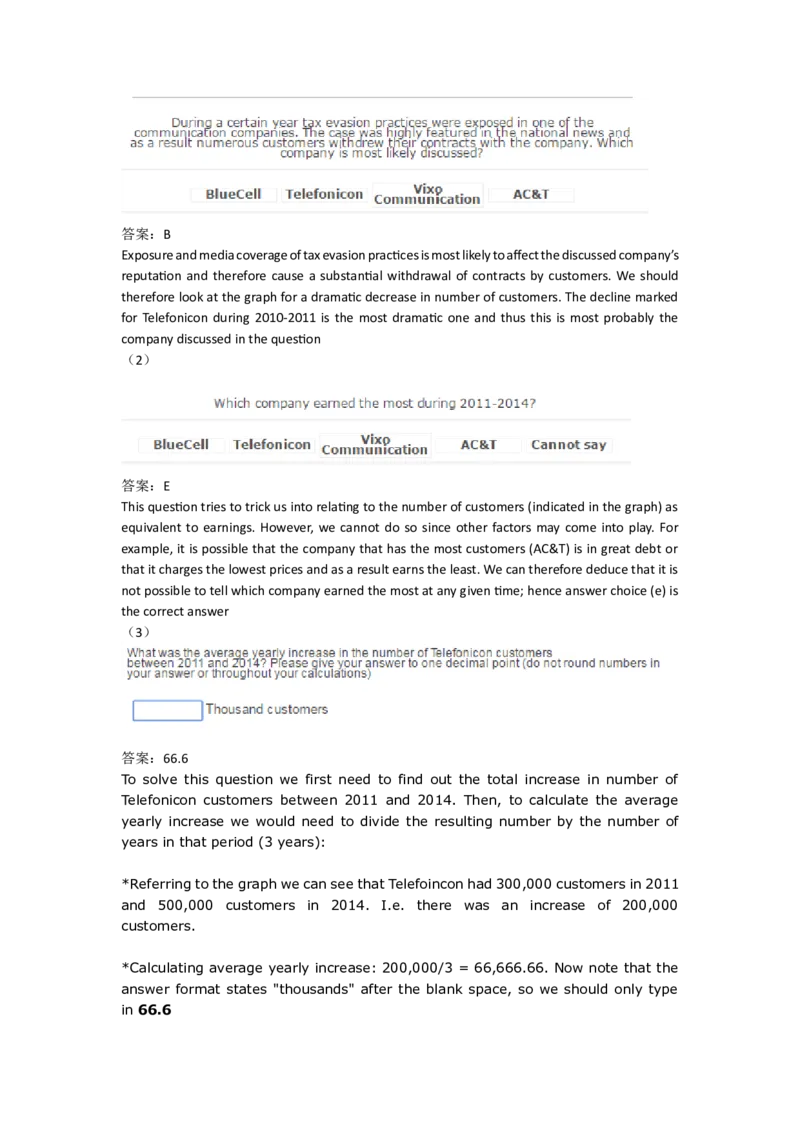
3、答案:B
Exposure and media coverage of tax evasion practices is most likely to affect the discussed company’s
reputation and therefore cause a substantial withdrawal of contracts by customers. We should
therefore look at the graph for a dramatic decrease in number of customers. The decline marked
for Telefonicon during 2010-2011 is the most dramatic one and thus this is most probably the
company discussed in the question
(2)
答案:E
This question tries to trick us into relating to the number of customers (indicated in the graph) as
equivalent to earnings. However, we cannot do so since other factors may come into play. For
example, it is possible that the company that has the most customers (AC&T) is in great debt or
that it charges the lowest prices and as a result earns the least. We can therefore deduce that it is
not possible to tell which company earned the most at any given time; hence answer choice (e) is
the correct answer
(3)
答案:66.6
To solve this question we first need to find out the total increase in number of
Telefonicon customers between 2011 and 2014. Then, to calculate the average
yearly increase we would need to divide the resulting number by the number of
years in that period (3 years):
*Referring to the graph we can see that Telefoincon had 300,000 customers in 2011
and 500,000 customers in 2014. I.e. there was an increase of 200,000
customers.
*Calculating average yearly increase: 200,000/3 = 66,666.66. Now note that the
answer format states "thousands" after the blank space, so we should only type
in 66.63、
(1)
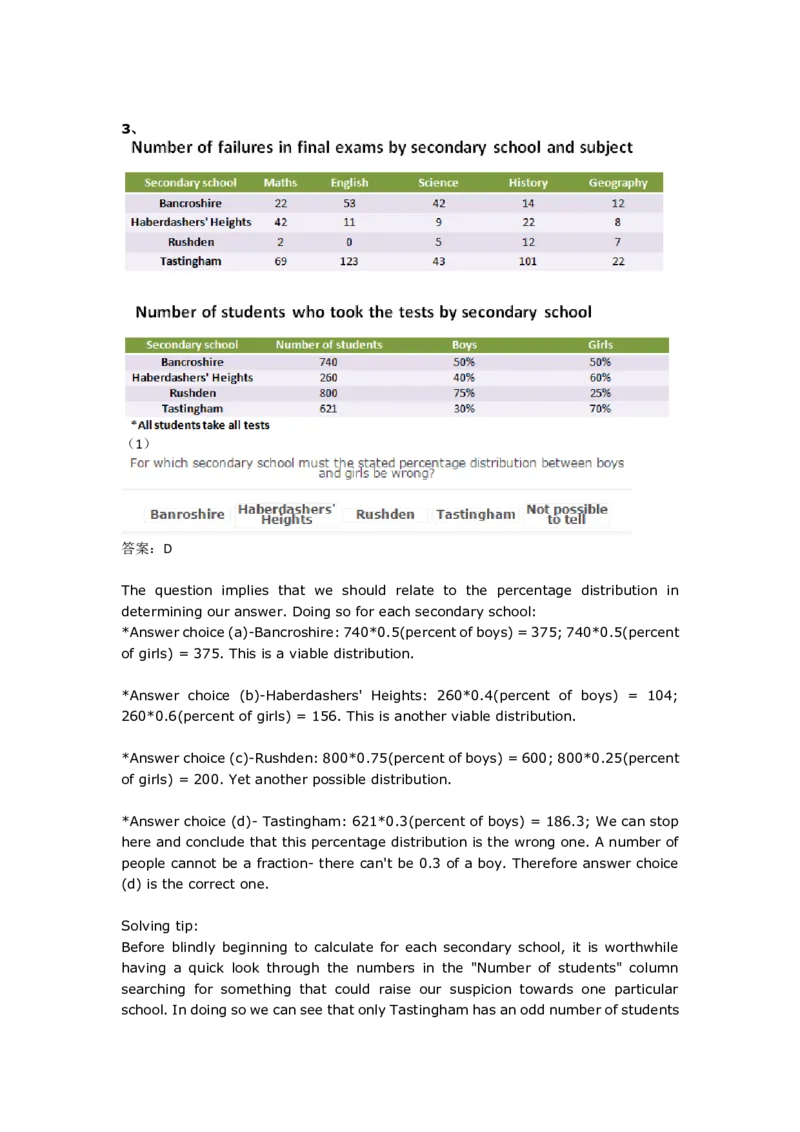
答案:D
The question implies that we should relate to the percentage distribution in
determining our answer. Doing so for each secondary school:
*Answer choice (a)-Bancroshire: 740*0.5(percent of boys) = 375; 740*0.5(percent
of girls) = 375. This is a viable distribution.
*Answer choice (b)-Haberdashers' Heights: 260*0.4(percent of boys) = 104;
260*0.6(percent of girls) = 156. This is another viable distribution.
*Answer choice (c)-Rushden: 800*0.75(percent of boys) = 600; 800*0.25(percent
of girls) = 200. Yet another possible distribution.
*Answer choice (d)- Tastingham: 621*0.3(percent of boys) = 186.3; We can stop
here and conclude that this percentage distribution is the wrong one. A number of
people cannot be a fraction- there can't be 0.3 of a boy. Therefore answer choice
(d) is the correct one.
Solving tip:
Before blindly beginning to calculate for each secondary school, it is worthwhile
having a quick look through the numbers in the "Number of students" column
searching for something that could raise our suspicion towards one particular
school. In doing so we can see that only Tastingham has an odd number of students(621) that should be multiplied by an even percentage number (30 percent). An
odd number multiplied by an even fraction (0.30) always yields a fraction- try it
out yourself! Even if you didn't realise this, then the mere uniqueness of this number
of students (621 being the only odd number) should draw you to start your
calculation with this school
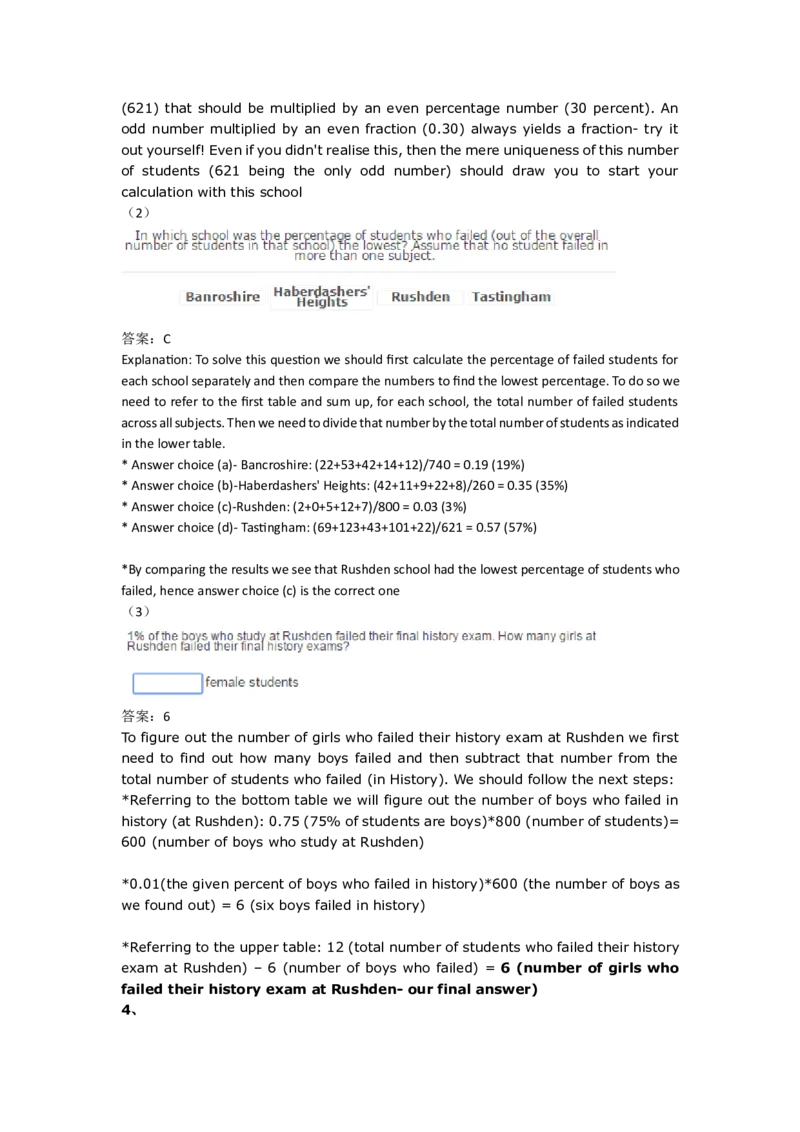
(2)
答案:C
Explanation: To solve this question we should first calculate the percentage of failed students for
each school separately and then compare the numbers to find the lowest percentage. To do so we
need to refer to the first table and sum up, for each school, the total number of failed students
across all subjects. Then we need to divide that number by the total number of students as indicated
in the lower table.
* Answer choice (a)- Bancroshire: (22+53+42+14+12)/740 = 0.19 (19%)
* Answer choice (b)-Haberdashers' Heights: (42+11+9+22+8)/260 = 0.35 (35%)
* Answer choice (c)-Rushden: (2+0+5+12+7)/800 = 0.03 (3%)
* Answer choice (d)- Tastingham: (69+123+43+101+22)/621 = 0.57 (57%)
*By comparing the results we see that Rushden school had the lowest percentage of students who
failed, hence answer choice (c) is the correct one
(3)
答案:6
To figure out the number of girls who failed their history exam at Rushden we first
need to find out how many boys failed and then subtract that number from the
total number of students who failed (in History). We should follow the next steps:
*Referring to the bottom table we will figure out the number of boys who failed in
history (at Rushden): 0.75 (75% of students are boys)*800 (number of students)=
600 (number of boys who study at Rushden)
*0.01(the given percent of boys who failed in history)*600 (the number of boys as
we found out) = 6 (six boys failed in history)
*Referring to the upper table: 12 (total number of students who failed their history
exam at Rushden) – 6 (number of boys who failed) = 6 (number of girls who
failed their history exam at Rushden- our final answer)
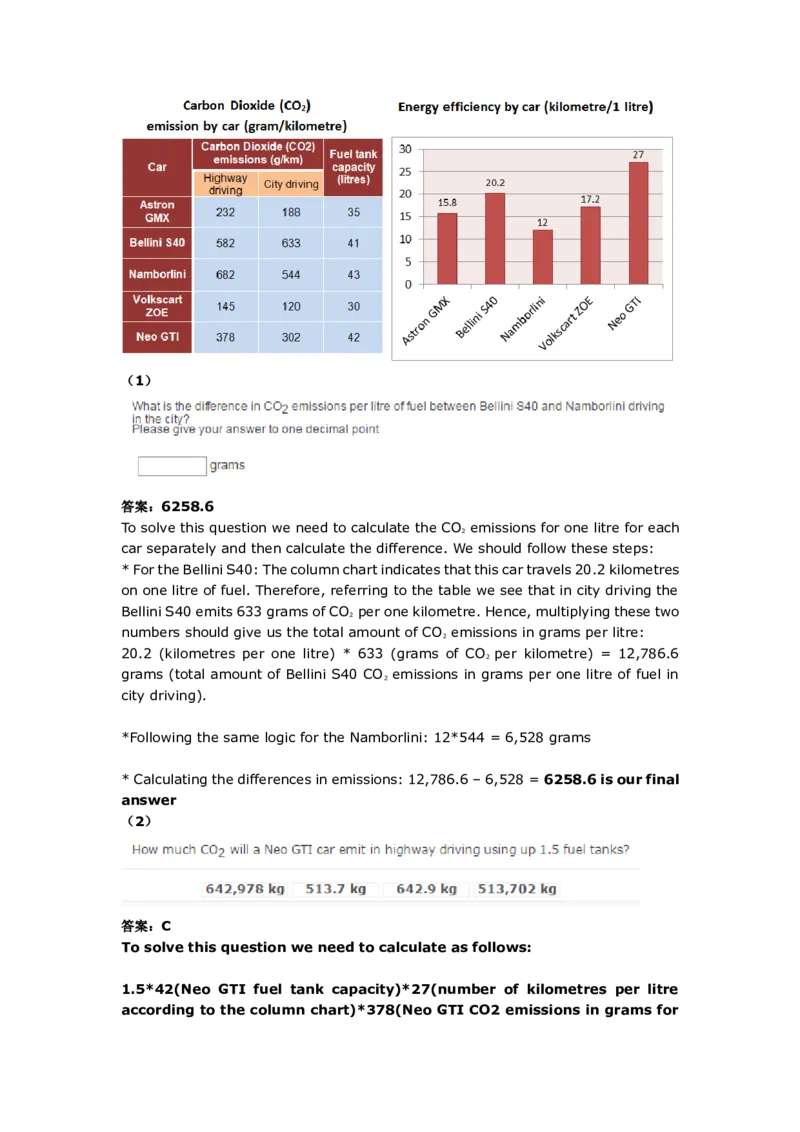
4、(1)
答案:6258.6
To solve this question we need to calculate the CO emissions for one litre for each
2
car separately and then calculate the difference. We should follow these steps:
* For the Bellini S40: The column chart indicates that this car travels 20.2 kilometres
on one litre of fuel. Therefore, referring to the table we see that in city driving the
Bellini S40 emits 633 grams of CO per one kilometre. Hence, multiplying these two
2
numbers should give us the total amount of CO emissions in grams per litre:
2
20.2 (kilometres per one litre) * 633 (grams of CO per kilometre) = 12,786.6
2
grams (total amount of Bellini S40 CO emissions in grams per one litre of fuel in
2
city driving).
*Following the same logic for the Namborlini: 12*544 = 6,528 grams
* Calculating the differences in emissions: 12,786.6 – 6,528 = 6258.6 is our final
answer
(2)
答案:C
To solve this question we need to calculate as follows:
1.5*42(Neo GTI fuel tank capacity)*27(number of kilometres per litre
according to the column chart)*378(Neo GTI CO2 emissions in grams forhighway driving- according to the table) = 642,978 grams.
*Now, noting that the answer choices are stated in kilograms, we should
mentally convert our result to 642,978/1,000 = 642.9 kg which
corresponds to answer choice (c)
(3)
答案:C
To solve this question we should follow these steps:
*Referring to the table: Half of a Volskart ZOE fuel tank capacity is: 30/2
= 15 litres
*Referring to the column chart to determine the amount of kilometres
Volskart ZOE drives on 1 litre: 17.2 km
*Referring back to the table to find out this car's CO2 emissions for one
kilometre in city driving and in highway driving: 120 and 145 grams/km
respectively
*Formulating our calculation: 15 (half a fuel tank)*17.2 (kilometres per 1
litre)*120 (city drive emission)+ 15 (the other half of the fuel
tank)*17.2*145(highway driving emission) = 68,370 grams.
*In order to find the average CO2 emissions per litre we now need to divide
the number we got by the number of litres in a full fuel tank: 68,370/30 =
2,279 (grams per litre)
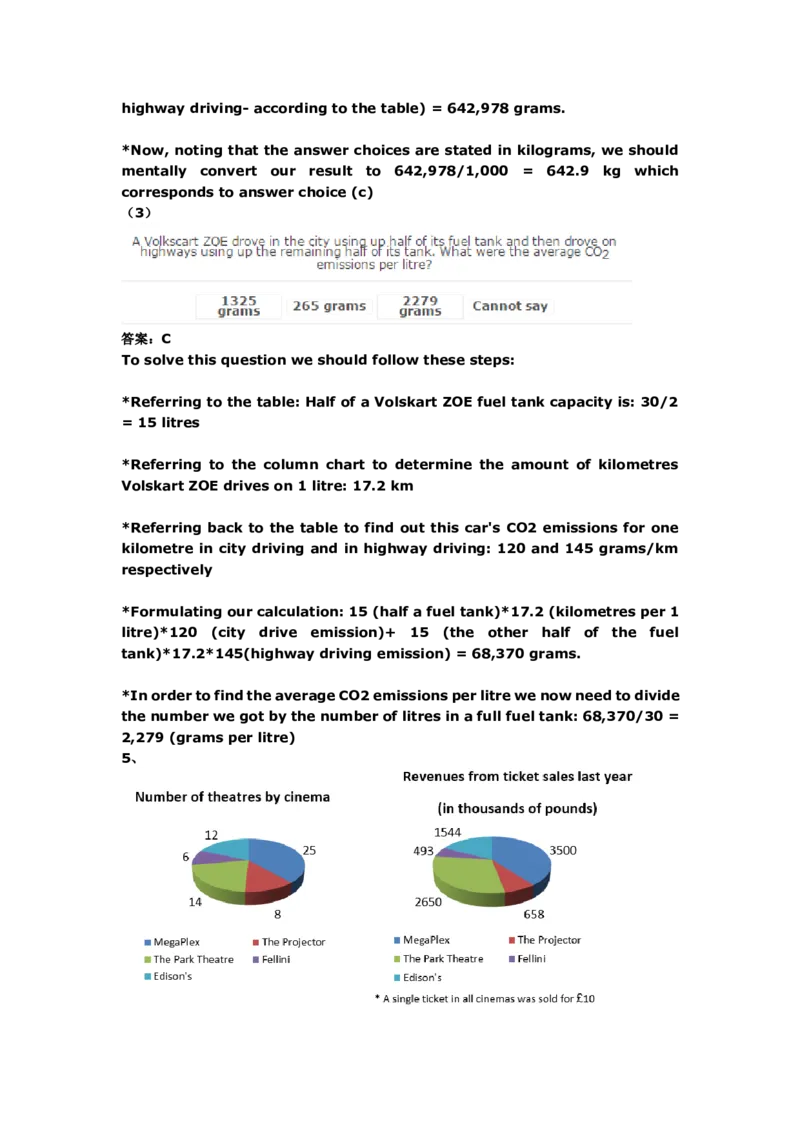
5、(1)
答案:E
To solve this question we need to calculate how many tickets were sold
for all MegaPlex theatres combined and then divide the result by the
number of theatres in MegaPlex:
* It is indicated below the right pie chart that a single ticket in all cinemas
was sold for £10. According to this pie chart we also know that MegaPlex
earned a total of 3500 thousand pounds from ticket sales. Therefore, we
can deduce that the number of tickets sold by MegaPlex was: 3,500,000/10
= 350,000 tickets.
*Dividing this number by the number of theatres (as indicated in the left
pie chart) we get the average of: 350,000/25 = 14,000. Therefore, we
should select answer choice (e)
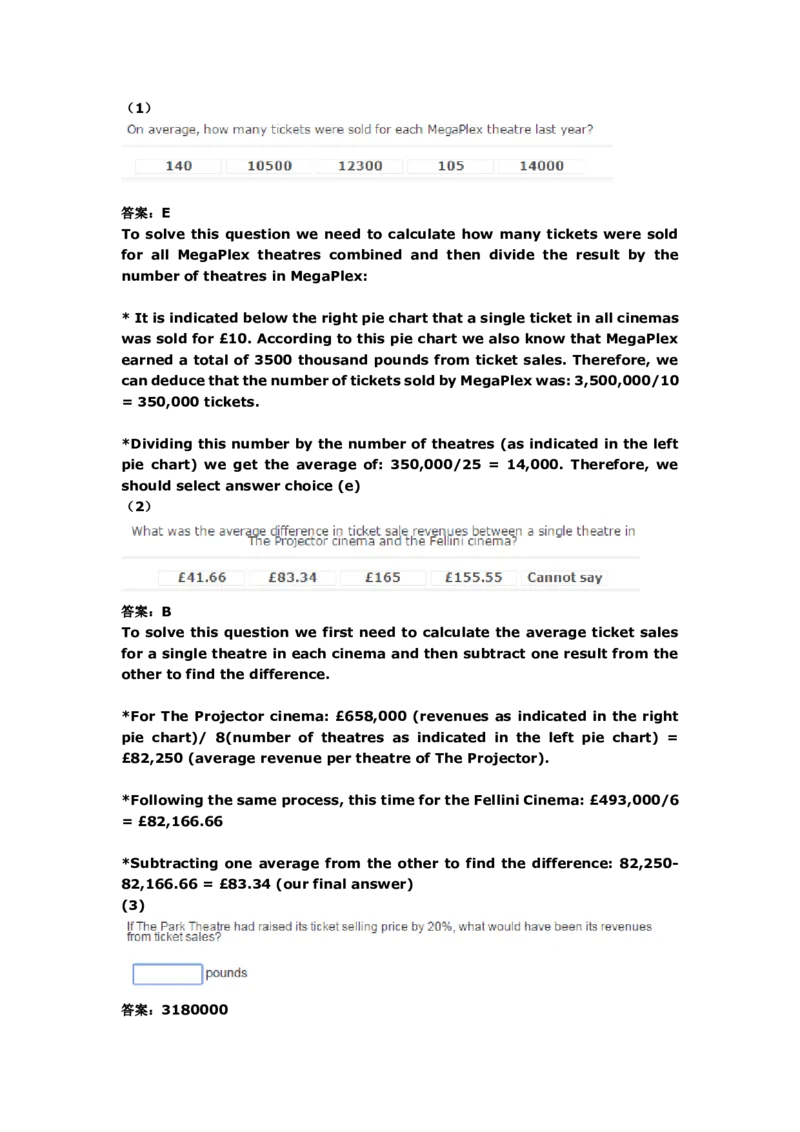
(2)
答案:B
To solve this question we first need to calculate the average ticket sales
for a single theatre in each cinema and then subtract one result from the
other to find the difference.
*For The Projector cinema: £658,000 (revenues as indicated in the right
pie chart)/ 8(number of theatres as indicated in the left pie chart) =
£82,250 (average revenue per theatre of The Projector).
*Following the same process, this time for the Fellini Cinema: £493,000/6
= £82,166.66
*Subtracting one average from the other to find the difference: 82,250-
82,166.66 = £83.34 (our final answer)
(3)
答案:3180000In order to solve this question we simply need to multiply The Park Theatre revenues
as presented in the right pie chart by 1.2 (a 20% increase):
*2,650,000*1.2 = 3180000 pounds; this is our final answer.
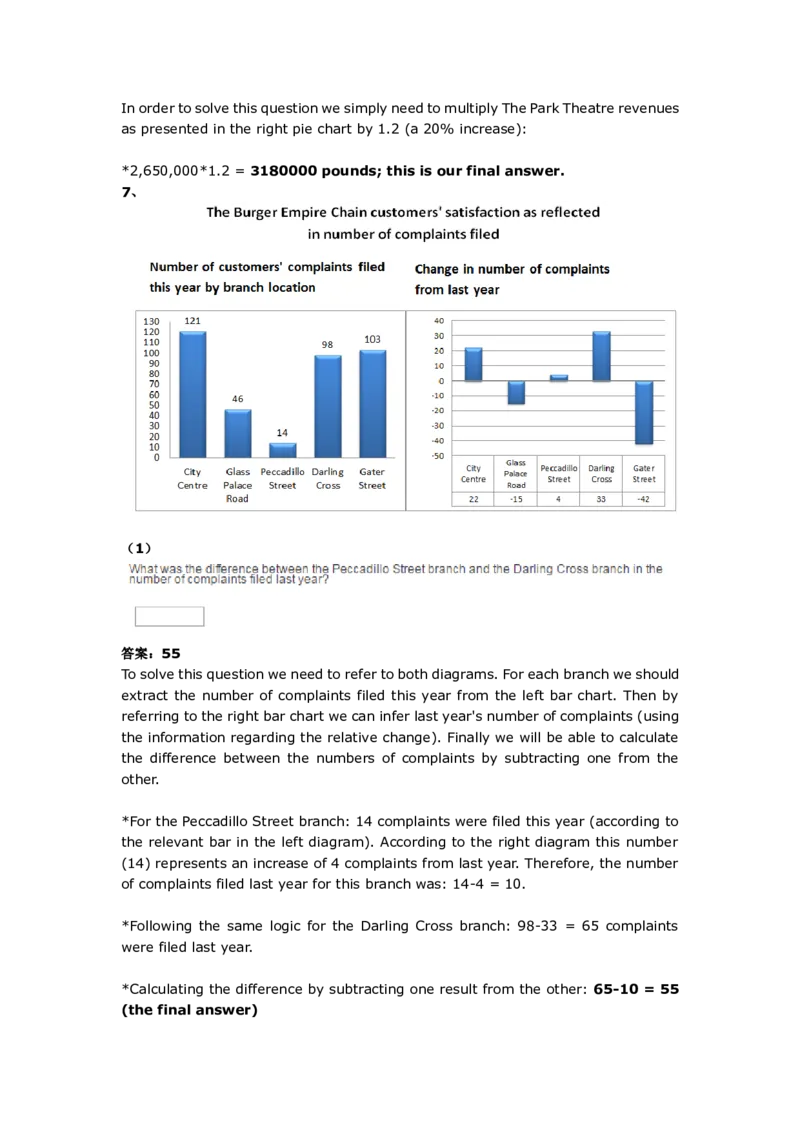
7、
(1)
答案:55
To solve this question we need to refer to both diagrams. For each branch we should
extract the number of complaints filed this year from the left bar chart. Then by
referring to the right bar chart we can infer last year's number of complaints (using
the information regarding the relative change). Finally we will be able to calculate
the difference between the numbers of complaints by subtracting one from the
other.
*For the Peccadillo Street branch: 14 complaints were filed this year (according to
the relevant bar in the left diagram). According to the right diagram this number
(14) represents an increase of 4 complaints from last year. Therefore, the number
of complaints filed last year for this branch was: 14-4 = 10.
*Following the same logic for the Darling Cross branch: 98-33 = 65 complaints
were filed last year.
*Calculating the difference by subtracting one result from the other: 65-10 = 55
(the final answer)(2)
答案:E
In figuring out relative improvement we should only take into account
relative changes from last year and not the absolute number of complaints.
We should therefore focus solely on the right diagram. Note that
improvement will in fact be denoted by a negative number in the right
diagram (indicating that this year's number of complaints was less than
that of last year). Keeping that in mind we can straight away rule out all
the branches showing positive numbers. We remain with the Glass Palace
Road branch and the Gater Street branch to choose from.
The Gater Street branch column shows a reduction of -42 complaints from
last year. This means that the number of complaints last year was 103+42
= 145 and that the relative improvement was of 42/145 = 0.28 or 28%.
The Glass Palace Road branch reduction was -15. The number of complaints
last year was 46+15 = 61 and the relative improvement was of 15/61 =
0.24 or 24%. It follows that the branch that showed the greatest
improvement was Gater Street Branch which means that answer choice
(e) is the correct one
(3)
答案:90.4
To solve this question we need to divide the total number of complaints filed last
year by the total number of complaints filed three years ago. Both these numbers
are not directly given to us, so we need to calculate them, as follows:
*Calculating for three years ago: the average number of complaints per branch was
84. From the average formula we know that average=sum of items/number of
items. Placing our numbers in the formula:
84 = sum of complaints/5(number of branches)
Cross multiplying we arrive at: sum of complaints three years ago = 84*5 =
420.*Calculating for last year’s number of complaints: We should first find the
number of complaints filed for each branch by extracting the number of complaints
filed this year from the left diagram and adding or subtracting the change asindicated in the right diagram. For instance, last year's number of complaints for
Peccadillo Street branch would be 14(this year's number of complaints)-4 (minus
four since this year's number indicates an increase(!) from last year)= 10 complaints
last year. Following this reasoning the total number of complaints filed last year
was: (121-22)+(46+15)+(14-4)+(98-33)+(103+42) = 380.
*Finally, remember that we were asked to find out the percentage of the total
number of complaints filed last year out of that of three years ago. Our calculation
should therefore be as follows: 380/420 = 0.9047. Finally remembering to convert
our result to percentage terms we get 90.4% which is the final answer (recall
that the instructions for the test stated explicitly that you should not round
the final answer)
