 夜雨聆风
夜雨聆风


推荐一个超买超买多信号共振指标公式代码
/@version=5
indicator(\”超买超卖多信号共振\”, overlay=false)
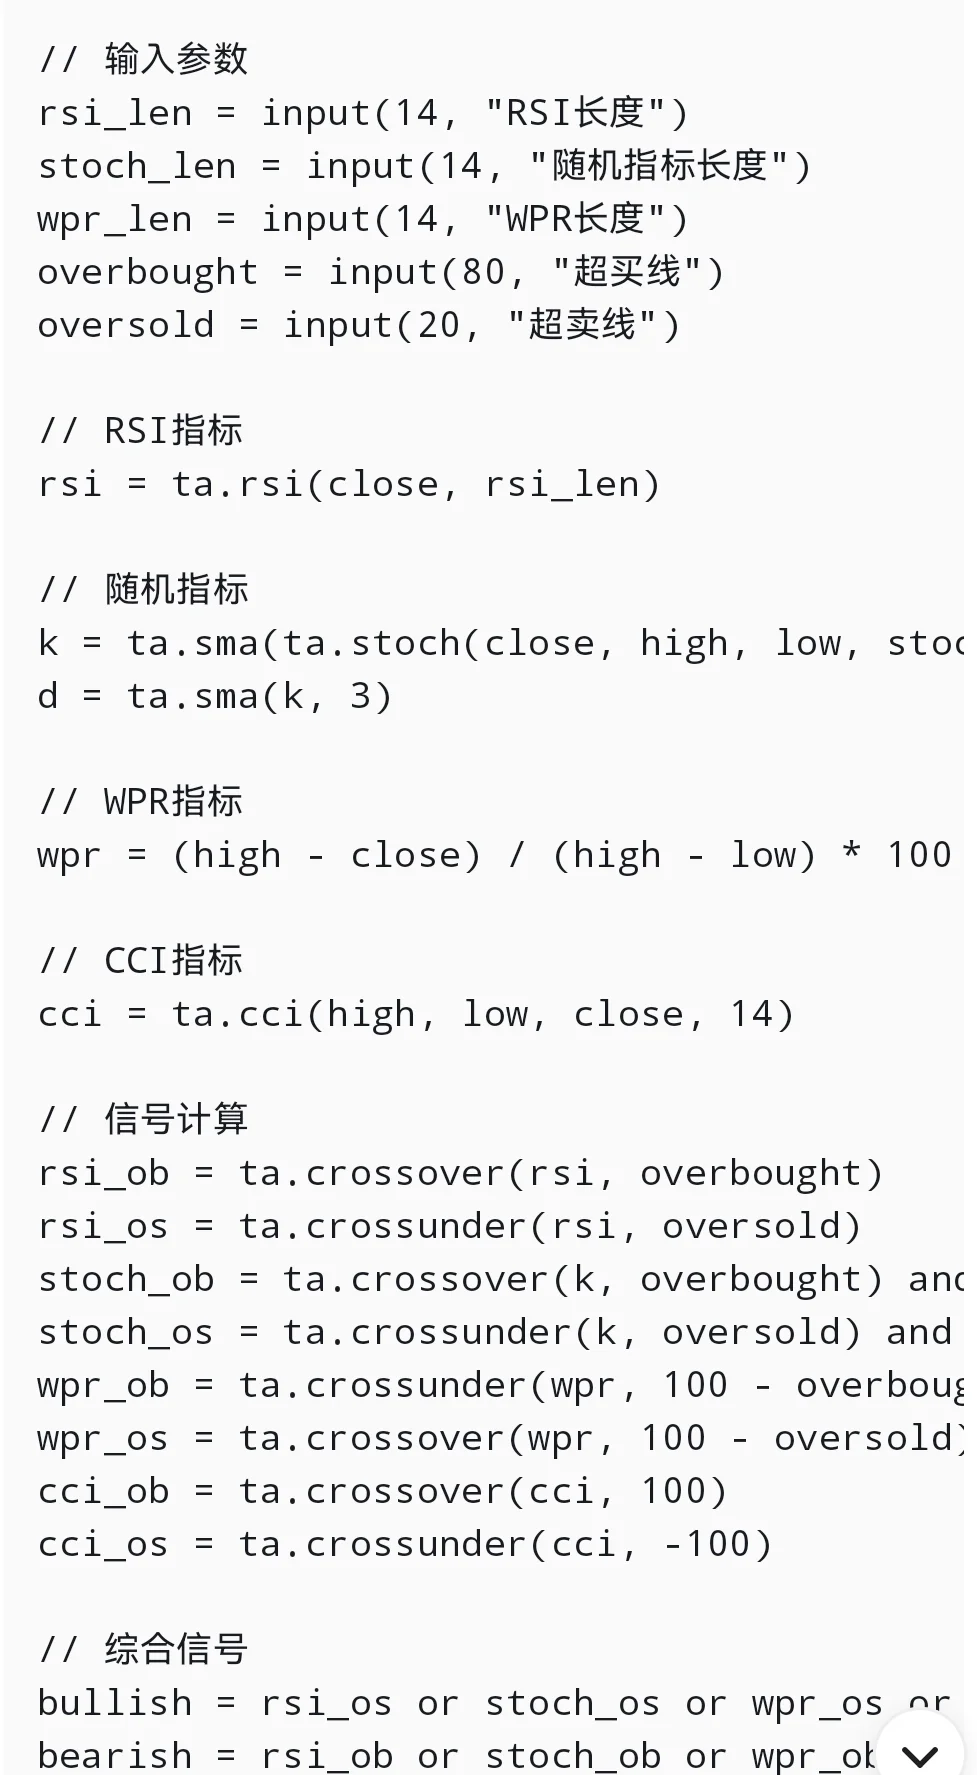
// 输入参数
rsi_len = input(14, \”RSI长度\”)
stoch_len = input(14, \”随机指标长度\”)
wpr_len = input(14, \”WPR长度\”)
overbought = input(80, \”超买线\”)
oversold = input(20, \”超卖线\”)
// RSI指标
rsi = ta.rsi(close, rsi_len)
// 随机指标
k = ta.sma(ta.stoch(close, high, low, stoch_len), 3)
d = ta.sma(k, 3)
// WPR指标
wpr = (high – close) / (high – low) * 100
// CCI指标
cci = ta.cci(high, low, close, 14)
// 信号计算
rsi_ob = ta.crossover(rsi, overbought)
rsi_os = ta.crossunder(rsi, oversold)
stoch_ob = ta.crossover(k, overbought) and k > d
stoch_os = ta.crossunder(k, oversold) and k < d
wpr_ob = ta.crossunder(wpr, 100 – overbought)
wpr_os = ta.crossover(wpr, 100 – oversold)
cci_ob = ta.crossover(cci, 100)
cci_os = ta.crossunder(cci, -100)
// 综合信号
bullish = rsi_os or stoch_os or wpr_os or cci_os
bearish = rsi_ob or stoch_ob or wpr_ob or cci_ob
// 绘图
plot(rsi, \”RSI\”, color=color.blue)
plot(k, \”Stoch\”, color=color.orange)
hline(overbought, \”超买线\”, color=color.red)
hline(oversold, \”超卖线\”, color=color.green)
plotshape(bullish, \”买入信号\”, shape.triangleup, location.bottom, color.green)
plotshape(bearish, \”卖出信号\”, shape.triangledown, location.top, color.red)
indicator(\”超买超卖多信号共振\”, overlay=false)
// 输入参数
rsi_len = input(14, \”RSI长度\”)
stoch_len = input(14, \”随机指标长度\”)
wpr_len = input(14, \”WPR长度\”)
overbought = input(80, \”超买线\”)
oversold = input(20, \”超卖线\”)
// RSI指标
rsi = ta.rsi(close, rsi_len)
// 随机指标
k = ta.sma(ta.stoch(close, high, low, stoch_len), 3)
d = ta.sma(k, 3)
// WPR指标
wpr = (high – close) / (high – low) * 100
// CCI指标
cci = ta.cci(high, low, close, 14)
// 信号计算
rsi_ob = ta.crossover(rsi, overbought)
rsi_os = ta.crossunder(rsi, oversold)
stoch_ob = ta.crossover(k, overbought) and k > d
stoch_os = ta.crossunder(k, oversold) and k < d
wpr_ob = ta.crossunder(wpr, 100 – overbought)
wpr_os = ta.crossover(wpr, 100 – oversold)
cci_ob = ta.crossover(cci, 100)
cci_os = ta.crossunder(cci, -100)
// 综合信号
bullish = rsi_os or stoch_os or wpr_os or cci_os
bearish = rsi_ob or stoch_ob or wpr_ob or cci_ob
// 绘图
plot(rsi, \”RSI\”, color=color.blue)
plot(k, \”Stoch\”, color=color.orange)
hline(overbought, \”超买线\”, color=color.red)
hline(oversold, \”超卖线\”, color=color.green)
plotshape(bullish, \”买入信号\”, shape.triangleup, location.bottom, color.green)
plotshape(bearish, \”卖出信号\”, shape.triangledown, location.top, color.red)
