 夜雨聆风
夜雨聆风


【GIS】手把手打造属于自己的地图编辑器!TIF影像+GeoJSON矢量+可拖动标注,轻松搞定
无需安装任何软件 · 打开浏览器就能用的轻量GIS工具 · 完全本地运行 · 隐私安全
你是否也曾幻想过,能像专业GIS软件一样,随心所欲地加载卫星影像、绘制行政边界、添加文字说明,甚至直接拖拽移动地图上的标注?今天,我们就用一套简洁高效的Web工具,帮你实现这一切——无需安装任何软件,打开浏览器,就能拥有一个轻量级、功能强大的在线地图编辑器。
📍 开箱即用的地图舞台
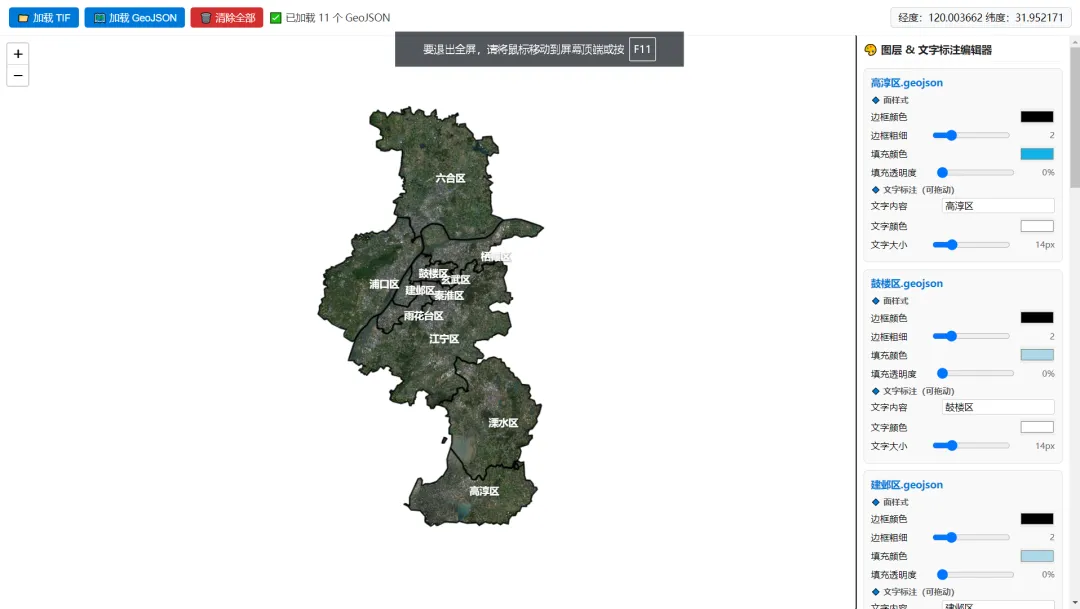
我们基于 Leaflet 构建了核心地图引擎,它不仅轻巧,而且扩展性极强。页面一打开,就是一个全屏地图,支持鼠标拖拽、缩放,实时显示经纬度。更重要的是,它完全透明背景,与任何页面风格都能完美融合。
📂 多源数据一键加载
编辑器支持两种最重要的地理数据格式:
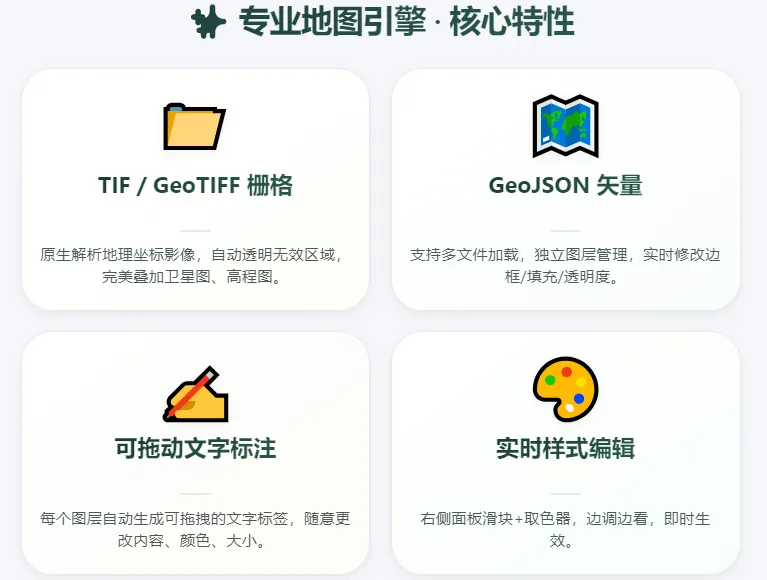
- TIF/GeoTIFF 栅格影像
无论是卫星图、高程图,还是扫描的历史地图,只需点击“加载 TIF”按钮,选择文件,系统便会自动解析地理坐标、波段信息,并精准叠加到地图上。影像的无效区域(如黑色背景)会被自动透明处理,保证美观。 - GeoJSON 矢量数据
这是最常用的矢量交换格式。你可以一次加载多个GeoJSON文件,每个文件都会以独立图层呈现。默认风格(黑色边框、浅蓝填充、完全透明的填充色)让边界清晰可见,又不遮挡底图。
🎨 随心所欲的样式编辑
加载完数据后,右侧面板会立即显示每个GeoJSON图层的详细控制项。你可以实时调整:
- 边框颜色
通过取色器直接选取喜欢的颜色。 - 边框粗细
滑动条从0到10,自由控制线条宽度。 - 填充颜色
同样支持取色器,让你的区域填充心仪的色彩。 - 填充透明度
0%到100%任意调节,既可以让区域醒目,也能保持底层影像可见。
所有修改都会即时生效,无需刷新页面,真正所见即所得。
✍️ 可拖动的文字标注
最令人惊喜的功能是:每个GeoJSON图层都会自动生成一个可拖动的文字标注。标注默认位于图层几何中心位置,你也可以用鼠标直接拖拽到任意位置。同时,你还可以:
-
修改标注文本内容(例如“行政区A”、“水系B”)。 -
调整文字颜色和大小,让标注更符合整体风格。
这一功能完美解决了传统GIS中标注位置固定、样式单一的问题,特别适合制作演示图或互动地图。
🖱️ 实时交互与便捷操作
- 鼠标悬浮显示经纬度
地图实时反馈当前光标位置。 - 多文件同时加载
可以一次性选择多个GeoJSON文件,批量导入。 - 一键清空所有图层
点击“清除全部”,快速重置地图。 - 智能自适应视野
每次加载新数据后,地图会自动缩放到包含所有图层的合适范围,省去手动调整的麻烦。
🔧 技术实现亮点
这套工具虽然功能丰富,但底层代码非常简洁,主要依赖三个核心库:
- Leaflet
最受欢迎的Web地图框架,轻量且插件生态丰富。 - georaster + georaster-layer-for-leaflet
让浏览器原生解析并渲染GeoTIFF影像,无需后端服务。 - 自定义样式与标注系统
通过动态生成DivIcon实现可拖拽文字,并实时同步控制面板数值。
整个项目完全运行在浏览器中,不依赖任何服务器,数据完全本地处理,既保证了隐私安全,又无需搭建复杂环境。
🚀 立即体验,创造你的地图
无论是地理爱好者、数据可视化从业者,还是教育工作者,这个工具都能帮你快速搭建个性化地图展示。你可以:
-
加载本地高精度卫星影像,标注感兴趣的地点。 -
绘制行政区划,配合透明度观察地形地貌。 -
制作旅游路线图,为每个景点添加可拖拽的文字说明。
现在,就把下面这份完整代码复制保存为.html文件,双击打开,开启你的地图创作之旅吧!
📜 完整代码(可直接运行)
💡 使用提示:将下方代码完整复制,保存为 .html 文件,用浏览器打开即可开始编辑。支持 Chrome / Edge / Safari 等现代浏览器。🔒 所有数据均在本地处理,不会上传任何文件,放心使用。
<!DOCTYPE html><htmllang="zh-CN"><head><metacharset="UTF-8"><title>地图编辑器 - TIF+GeoJSON+可拖动文字标注</title><linkrel="stylesheet"href="https://unpkg.com/leaflet@1.9.4/dist/leaflet.css"><style>* { margin: 0; padding: 0; box-sizing: border-box; }body { height: 100vh; display: flex; flex-direction: column; font-family: system-ui, sans-serif; }.toolbar {padding: 10px 14px;background: #fff;border-bottom: 1px solid #eee;display: flex;gap: 8px;align-items: center;flex-wrap: wrap;}.btn {padding: 5px 12px;background: #0078d7;color: white;border: none;border-radius: 4px;cursor: pointer;font-size:14px;}.btn-clear {background: #d32f2f;}#status {color: #333;min-width: 240px;font-size:14px;}#coord {padding: 5px 10px;background: #f8f9fa;border: 1px solid #ccc;border-radius: 4px;font-size:14px;margin-left:auto;}.main {display: flex;flex:1;overflow:hidden;}#map {flex:1;background: transparent !important;}/* 右侧样式面板 */.panel {width: 320px;background: #fff;border-left:1px solid #ddd;padding:10px;overflow-y:auto;}.panel-title {font-weight:bold;margin-bottom:10px;font-size:15px;color:#222;padding-bottom:6px;border-bottom:1px solid #eee;}.layer-item {border:1px solid #ddd;border-radius:6px;padding:10px;margin-bottom:10px;background:#f9f9f9;}.layer-name {font-weight:bold;margin-bottom:8px;font-size:14px;color:#0078d7;word-break:break-all;}.section {font-size:12px;font-weight:bold;margin:8px 0 4px;color:#555;}.ctrl-row {display:flex;align-items:center;justify-content:space-between;margin-bottom:6px;font-size:13px;}.ctrl-row input {width:110px;cursor:pointer;}.ctrl-row input[type="color"] {width:50px;height:24px;padding:0;border:none;cursor:pointer;}.ctrl-row input[type="text"] {width:160px;padding:2px 4px;border:1px solid #ccc;border-radius:3px;}.val-text {font-size:12px;color:#666;min-width:28px;text-align:right;}/* 强制透明 */.leaflet-container,.georaster-layer-for-leaflet,.georaster-layer-for-leaflet canvas {background: transparent !important;border:none !important;box-shadow:none !important;}/* 自定义文字标注样式 */.map-label {background: transparent !important;border: none !important;font-weight: bold;text-shadow: 1px 1px 2px rgba(0,0,0,0.5);pointer-events: all !important;cursor: move !important;padding: 2px 4px;white-space: nowrap;}</style></head><body><divclass="toolbar"><inputtype="file"id="fileTif"accept=".tif,.tiff,.geotiff"style="display:none;"><inputtype="file"id="fileGeojson"accept=".geojson,.json"style="display:none;"multiple><buttonclass="btn"id="btnTif">📁 加载 TIF</button><buttonclass="btn"id="btnGeojson">🗺️ 加载 GeoJSON</button><buttonclass="btn btn-clear"id="btnClear">🗑️ 清除全部</button><spanid="status">就绪</span><divid="coord">经度:---- 纬度:----</div></div><divclass="main"><divid="map"></div><!-- 右侧样式控制面板 --><divclass="panel"id="stylePanel"><divclass="panel-title">🎨 图层 & 文字标注编辑器</div><divid="layerList">暂无图层</div></div></div><scriptsrc="https://unpkg.com/leaflet@1.9.4/dist/leaflet.js"></script><scriptsrc="https://unpkg.com/georaster@1.5.0/dist/georaster.browser.bundle.min.js"></script><scriptsrc="https://unpkg.com/georaster-layer-for-leaflet@3.10.0/dist/georaster-layer-for-leaflet.min.js"></script><script>const map = L.map('map', {center: [0,0], zoom:2,backgroundColor:'transparent',zoomControl:true, attributionControl:false});// 全局图层存储let tifLayers = [];let geojsonLayers = [];let layerId = 0;// 鼠标实时经纬度map.on('mousemove', e=>{document.getElementById('coord').innerText =`经度:${e.latlng.lng.toFixed(6)} 纬度:${e.latlng.lat.toFixed(6)}`;});// ====================== 加载 TIF ======================document.getElementById('btnTif').onclick = ()=>{document.getElementById('fileTif').click();};document.getElementById('fileTif').onchange = async e=>{const file = e.target.files[0];if(!file) return;setStatus('解析 TIF...');try{const buf = await file.arrayBuffer();const raster = await parseGeoraster(buf);const layer = new GeoRasterLayer({georaster:raster, opacity:1, resolution:256,mask:true, maskAlpha:0, drawBoundary:false, crop:true,pixelValuesToColorFn: values=>{const v = values[0];const nd = raster.noDataValue;if(v===nd || v==null || isNaN(v) || v===0) return null;if(values.length===1){const c = Math.max(0,Math.min(255,v));return `rgb(${c},${c},${c})`;}if(values.length>=3){const r=Math.max(0,Math.min(255,values[0]));const g=Math.max(0,Math.min(255,values[1]));const b=Math.max(0,Math.min(255,values[2]));return `rgb(${r},${g},${b})`;}return null;}}).addTo(map);tifLayers.push(layer);map.fitBounds(layer.getBounds(),{padding:[30,30]});setStatus(`✅ 已加载:${file.name}`);}catch(err){setStatus('❌ TIF 加载失败',true);console.error(err);}};// ====================== 加载 GeoJSON(多个) ======================document.getElementById('btnGeojson').onclick = ()=>{document.getElementById('fileGeojson').click();};document.getElementById('fileGeojson').onchange = async e=>{const files = Array.from(e.target.files);if(files.length===0) return;setStatus(`加载 ${files.length} 个 GeoJSON...`);try{for(const file of files){const txt = await file.text();const data = JSON.parse(txt);const id = layerId++;// ========== 默认样式修改 ==========// 边框:黑色 填充:浅蓝色 透明度:0const defaultStyle = {color:'#000000', // 边框:黑色weight:2, // 边框粗细opacity:0.9,fillColor:'#add8e6', // 填充:浅蓝色fillOpacity:0 // 填充透明度:0(完全透明)};// 默认文字样式const labelStyle = {text: file.name.replace(/\.(geojson|json)$/i,''),color: '#ffffff',size: 14,font: 'bold sans-serif'};// 创建GeoJSON图层const geo = L.geoJSON(data,{style: defaultStyle,pointToLayer:(f,ll)=>L.circleMarker(ll,{radius:5, fillColor:'#000000', color:'#fff', weight:2})}).addTo(map);// 获取中心点,创建可拖动文字标注const center = geo.getBounds().getCenter();const label = L.marker(center, {icon: L.divIcon({className: 'map-label',html: `<span style="color:${labelStyle.color}; font-size:${labelStyle.size}px; ${labelStyle.font}">${labelStyle.text}</span>`}),draggable: true}).addTo(map);// 存储图层信息geojsonLayers.push({id, name:file.name,layer:geo, label:label,style:defaultStyle, labelStyle:labelStyle});}refreshPanel();fitAllBounds();setStatus(`✅ 已加载 ${geojsonLayers.length} 个 GeoJSON`);}catch(err){setStatus('❌ GeoJSON 加载失败',true);console.error(err);}};// ====================== 刷新右侧面板(带数值显示) ======================function refreshPanel(){const container = document.getElementById('layerList');if(geojsonLayers.length===0){container.innerHTML = '<div style="font-size:13px;color:#666;">暂无图层</div>';return;}let html = '';geojsonLayers.forEach(item=>{html += `<div class="layer-item"><div class="layer-name">${item.name}</div><div class="section">🔹 面样式</div><div class="ctrl-row"><span>边框颜色</span><input type="color" value="${item.style.color}" onchange="updateStyle(${item.id},'color',this.value)"></div><div class="ctrl-row"><span>边框粗细</span><input type="range" min="0" max="10" value="${item.style.weight}" oninput="updateStyle(${item.id},'weight',this.value)"><span class="val-text">${item.style.weight}</span></div><div class="ctrl-row"><span>填充颜色</span><input type="color" value="${item.style.fillColor}" onchange="updateStyle(${item.id},'fillColor',this.value)"></div><div class="ctrl-row"><span>填充透明度</span><input type="range" min="0" max="100" value="${item.style.fillOpacity*100}" oninput="updateStyle(${item.id},'fillOpacity',this.value/100)"><span class="val-text">${Math.round(item.style.fillOpacity*100)}%</span></div><div class="section">🔹 文字标注(可拖动)</div><div class="ctrl-row"><span>文字内容</span><input type="text" value="${item.labelStyle.text}" onchange="updateLabel(${item.id},'text',this.value)"></div><div class="ctrl-row"><span>文字颜色</span><input type="color" value="${item.labelStyle.color}" onchange="updateLabel(${item.id},'color',this.value)"></div><div class="ctrl-row"><span>文字大小</span><input type="range" min="8" max="36" value="${item.labelStyle.size}" oninput="updateLabel(${item.id},'size',this.value)"><span class="val-text">${item.labelStyle.size}px</span></div></div>`;});container.innerHTML = html;}// ====================== 更新GeoJSON样式 ======================window.updateStyle = function(id, key, val){const item = geojsonLayers.find(i=>i.id===id);if(!item) return;item.style[key] = val;item.layer.setStyle(item.style);refreshPanel(); // 刷新数值显示};// ====================== 更新文字标注 ======================window.updateLabel = function(id, key, val){const item = geojsonLayers.find(i=>i.id===id);if(!item) return;item.labelStyle[key] = val;// 重新渲染文字const s = item.labelStyle;item.label.setIcon(L.divIcon({className: 'map-label',html: `<span style="color:${s.color}; font-size:${s.size}px; font-weight:bold; font-family:sans-serif">${s.text}</span>`}));refreshPanel(); // 刷新数值显示};// ====================== 自适应所有图层 ======================function fitAllBounds(){const bounds = [];tifLayers.forEach(l=>bounds.push(l.getBounds()));geojsonLayers.forEach(i=>bounds.push(i.layer.getBounds()));if(bounds.length>0) map.fitBounds(bounds.reduce((a,b)=>a.extend(b),bounds[0]),{padding:[30,30]});}// ====================== 清空所有 ======================document.getElementById('btnClear').onclick = ()=>{tifLayers.forEach(l=>map.removeLayer(l));geojsonLayers.forEach(i=>{map.removeLayer(i.layer);map.removeLayer(i.label);});tifLayers = [];geojsonLayers = [];refreshPanel();setStatus('🗑️ 已清空所有图层');};function setStatus(msg, err){const el = document.getElementById('status');el.innerText = msg;el.style.color = err ? '#d32f2f' : '#333';}</script></body></html>