 夜雨聆风
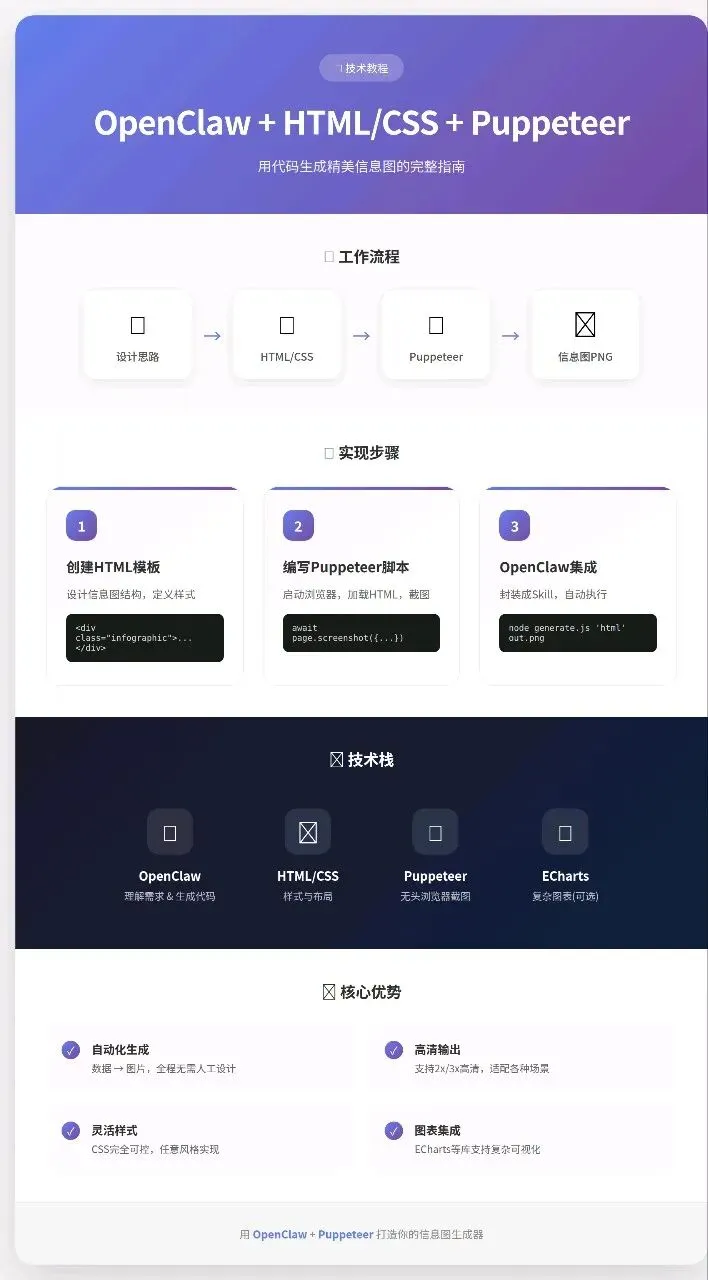
夜雨聆风用代码生成精美信息图的完整指南
核心思路
┌─────────────┐     ┌─────────────┐     ┌─────────────┐
│  设计思路   │────▶│  HTML+CSS   │────▶│  Puppeteer  │
│  (OpenClaw) │     │  (样式模板) │     │  (截图生成) │
└─────────────┘     └─────────────┘     └──────┬──────┘
                                                │
                                                ▼
                                         ┌─────────────┐
                                         │   信息图    │
                                         │  (PNG/PDF)  │
└─────────────┘OpenClaw的角色:
- 理解你的设计需求
- 生成HTML/CSS代码
- 调用Puppeteer执行截图
- 返回生成的图片
第一步:创建HTML模板
基础信息图模板
<!DOCTYPE html>
<html>
<head>
  <meta charset="UTF-8">
  <style>
    * { margin: 0; padding: 0; box-sizing: border-box; }

    .infographic {
      width: 800px;
      padding: 40px;
      background: linear-gradient(135deg, #667eea 0%, #764ba2 100%);
      font-family: -apple-system, BlinkMacSystemFont, "Segoe UI", sans-serif;
      color: white;
    }

    .header {
      text-align: center;
      margin-bottom: 30px;
    }

    .title {
      font-size: 32px;
      font-weight: bold;
      margin-bottom: 10px;
    }

    .subtitle {
      font-size: 16px;
      opacity: 0.9;
    }

    .stats-grid {
      display: grid;
      grid-template-columns: repeat(3, 1fr);
      gap: 20px;
      margin-top: 30px;
    }

    .stat-card {
      background: rgba(255,255,255,0.15);
      border-radius: 12px;
      padding: 20px;
      text-align: center;
      backdrop-filter: blur(10px);
    }

    .stat-number {
      font-size: 36px;
      font-weight: bold;
      margin-bottom: 8px;
    }

    .stat-label {
      font-size: 14px;
      opacity: 0.85;
    }
  </style>
</head>
<body>
  <div class="infographic">
    <div class="header">
      <div class="title">数据洞察报告</div>
      <div class="subtitle">2026年第一季度业务表现</div>
    </div>

    <div class="stats-grid">
      <div class="stat-card">
        <div class="stat-number">85%</div>
        <div class="stat-label">增长率</div>
      </div>
      <div class="stat-card">
        <div class="stat-number">12K</div>
        <div class="stat-label">活跃用户</div>
      </div>
      <div class="stat-card">
        <div class="stat-number">4.9</div>
        <div class="stat-label">用户评分</div>
      </div>
    </div>
  </div>
</body>
</html>
第二步:Puppeteer截图脚本
const puppeteer = require('puppeteer');
const fs = require('fs');
const path = require('path');

async function generateInfographic(htmlContent, outputPath) {
  const browser = await puppeteer.launch({
    headless: 'new',
    executablePath: '/usr/bin/google-chrome',  // 系统Chrome路径
    args: ['--no-sandbox', '--disable-setuid-sandbox']
  });

  try {
    const page = await browser.newPage();

    // 设置视口(根据信息图尺寸调整)
    await page.setViewport({
      width: 800,
      height: 600,
      deviceScaleFactor: 2  // 高清输出
    });

    // 加载HTML内容
    await page.setContent(htmlContent, {
      waitUntil: 'networkidle0'
    });

    // 等待字体和样式加载
    await new Promise(r => setTimeout(r, 500));

    // 获取实际内容高度
    const bodyHeight = await page.evaluate(() => {
      return document.body.scrollHeight;
    });

    // 截图
    await page.screenshot({
      path: outputPath,
      type: 'png',
      fullPage: true,
      clip: {
        x: 0,
        y: 0,
        width: 800,
        height: bodyHeight
      }
    });

    console.log(`✅ 信息图已生成: ${outputPath}`);
    return outputPath;

  } finally {
    await browser.close();
  }
}

// 使用示例
const html = `<!DOCTYPE html>...`; // 你的HTML代码
generateInfographic(html, './output.png');
第三步:OpenClaw集成方案
方案A:Node.js脚本方式(推荐)
在OpenClaw中执行:
# 1. 创建工作目录
mkdir -p ~/infographic-generator
cd ~/infographic-generator

# 2. 初始化项目
npm init -y
npm install puppeteer

# 3. 创建生成脚本
cat > generate.js << 'EOF'
const puppeteer = require('puppeteer');

(async () => {
  const html = process.argv[2];
  const output = process.argv[3] || 'output.png';

  const browser = await puppeteer.launch({
    headless: 'new',
    executablePath: '/usr/bin/google-chrome',
    args: ['--no-sandbox']
  });

  const page = await browser.newPage();
  await page.setViewport({ width: 800, height: 600, deviceScaleFactor: 2 });
  await page.setContent(html);
  await new Promise(r => setTimeout(r, 500));

  const height = await page.evaluate(() => document.body.scrollHeight);
  await page.screenshot({
    path: output,
    clip: { x: 0, y: 0, width: 800, height }
  });

  await browser.close();
  console.log(output);
})();
EOF
方案B:Python + Playwright方式
# install: pip install playwright
# setup: playwright install chromium

from playwright.sync_api import sync_playwright
import base64

def generate_infographic(html_content, width=800, height=600):
    with sync_playwright() as p:
        browser = p.chromium.launch()
        page = browser.new_page(viewport={'width': width, 'height': height})
        page.set_content(html_content)
        page.wait_for_timeout(500)

        # 截图并转为base64
        screenshot = page.screenshot(type='png', full_page=True)
        browser.close()

        return base64.b64encode(screenshot).decode()

# 使用
html = """<!DOCTYPE html>..."""
img_base64 = generate_infographic(html)
print(f"data:image/png;base64,{img_base64}")
完整实战示例
需求:生成一个"能量银行"统计信息图
Step 1: 让OpenClaw生成HTML
用户:帮我生成一个家庭能量银行的周报信息图HTML,
      数据:涵涵 5颗星,梅子 3颗星,爸爸 4颗星
      风格:温馨家庭风,暖色调
OpenClaw生成:
<!DOCTYPE html>
<html>
<head>
  <meta charset="UTF-8">
  <style>
    @import url('https://fonts.googleapis.com/css2?family=Noto+Sans+SC:wght@400;700&display=swap');

    * { margin: 0; padding: 0; box-sizing: border-box; }

    .infographic {
      width: 600px;
      padding: 30px;
      background: linear-gradient(135deg, #ffeaa7 0%, #fab1a0 100%);
      font-family: 'Noto Sans SC', sans-serif;
      border-radius: 20px;
    }

    .title {
      text-align: center;
      font-size: 28px;
      color: #2d3436;
      margin-bottom: 25px;
    }

    .member-list {
      display: flex;
      flex-direction: column;
      gap: 15px;
    }

    .member {
      display: flex;
      align-items: center;
      background: white;
      padding: 15px 20px;
      border-radius: 12px;
      box-shadow: 0 2px 10px rgba(0,0,0,0.1);
    }

    .avatar {
      width: 50px;
      height: 50px;
      border-radius: 50%;
      background: #74b9ff;
      display: flex;
      align-items: center;
      justify-content: center;
      font-size: 20px;
      margin-right: 15px;
    }

    .info { flex: 1; }
    .name { font-size: 18px; font-weight: bold; color: #2d3436; }
    .role { font-size: 12px; color: #636e72; }

    .stars {
      display: flex;
      gap: 5px;
    }

    .star {
      font-size: 24px;
      color: #fdcb6e;
    }

    .footer {
      text-align: center;
      margin-top: 20px;
      font-size: 14px;
      color: #636e72;
    }
  </style>
</head>
<body>
  <div class="infographic">
    <div class="title">🏠 家庭能量银行周报</div>

    <div class="member-list">
      <div class="member">
        <div class="avatar">👧</div>
        <div class="info">
          <div class="name">涵涵</div>
          <div class="role">本周之星</div>
        </div>
        <div class="stars">
          <span class="star">⭐</span>
          <span class="star">⭐</span>
          <span class="star">⭐</span>
          <span class="star">⭐</span>
          <span class="star">⭐</span>
        </div>
      </div>

      <div class="member">
        <div class="avatar">👨</div>
        <div class="info">
          <div class="name">爸爸</div>
          <div class="role">稳健表现</div>
        </div>
        <div class="stars">
          <span class="star">⭐</span>
          <span class="star">⭐</span>
          <span class="star">⭐</span>
          <span class="star">⭐</span>
        </div>
      </div>

      <div class="member">
        <div class="avatar">👩</div>
        <div class="info">
          <div class="name">梅子</div>
          <div class="role">继续加油</div>
        </div>
        <div class="stars">
          <span class="star">⭐</span>
          <span class="star">⭐</span>
          <span class="star">⭐</span>
        </div>
      </div>
    </div>

    <div class="footer">2026年4月第1周 | 温暖每一个瞬间 💕</div>
  </div>
</body>
</html>
Step 2: 截图生成
cd ~/infographic-generator
node generate.js '<!DOCTYPE html>...' family-report.png
Step 3: 在飞书中发送
使用OpenClaw的 message 工具发送图片给用户。
高级技巧
1. 响应式高度
// 自动适应内容高度
const bodyHeight = await page.evaluate(() => {
  const element = document.querySelector('.infographic');
  return element ? element.offsetHeight : document.body.scrollHeight;
});

await page.setViewport({
  width: 800,
  height: bodyHeight,
  deviceScaleFactor: 2
});
2. 图表库集成
使用ECharts等库生成复杂图表:
<script src="https://cdn.jsdelivr.net/npm/echarts@5/dist/echarts.min.js"></script>
<div id="chart" style="width: 600px; height: 400px;"></div>
<script>
  const chart = echarts.init(document.getElementById('chart'));
  chart.setOption({
    series: [{
      type: 'pie',
      data: [
        { value: 35, name: '涵涵' },
        { value: 25, name: '爸爸' },
        { value: 20, name: '梅子' }
      ]
    }]
  });
</script>
3. 模板系统
创建可复用的模板:
const templates = {
  'weekly-report': (data) => `...HTML模板...`,
  'comparison': (data) => `...HTML模板...`,
  'timeline': (data) => `...HTML模板...`
};

function generate(type, data) {
  const html = templates[type](data);
  return screenshot(html);
}
完整OpenClaw Skill设计
如果你想封装成一个Skill:
# infographic-generator Skill

## 触发词
- 生成信息图
- 制作海报
- 数据可视化
- infographic

## 输入
- 数据内容(JSON或描述)
- 模板类型(report/comparison/timeline)
- 风格偏好(颜色、字体)

## 输出
- PNG图片(base64或直接发送)

## 工作流程
1. 理解用户需求,提取数据和样式要求
2. 生成HTML+CSS代码
3. 调用Puppeteer/Playwright截图
4. 返回生成的图片
常见问题
Q: Puppeteer启动慢怎么办?
A: 使用 puppeteer.connect() 连接已运行的Chrome实例,或使用Playwright。
Q: 中文字体显示异常?
A: 使用Google Fonts加载中文字体,或本地安装字体文件。
<style>
@import url('https://fonts.googleapis.com/css2?family=Noto+Sans+SC:wght@400;700&display=swap');
body { font-family: 'Noto Sans SC', sans-serif; }
</style>
Q: 图片清晰度不够?
A: 提高 deviceScaleFactor(如设为2或3),使用PNG格式。
Q: 如何在飞书中展示?
A: 将生成的图片转为base64,使用 message 工具的 buffer 参数发送。
下一步
- 安装依赖:
npm install puppeteer或pip install playwright - 创建模板库:收集常用信息图样式
- 封装成Skill:让OpenClaw自动完成"需求→代码→图片"全流程
文档生成时间:2026-04-02
作者:OpenClaw AI