 夜雨聆风
夜雨聆风
2026雅思小作文


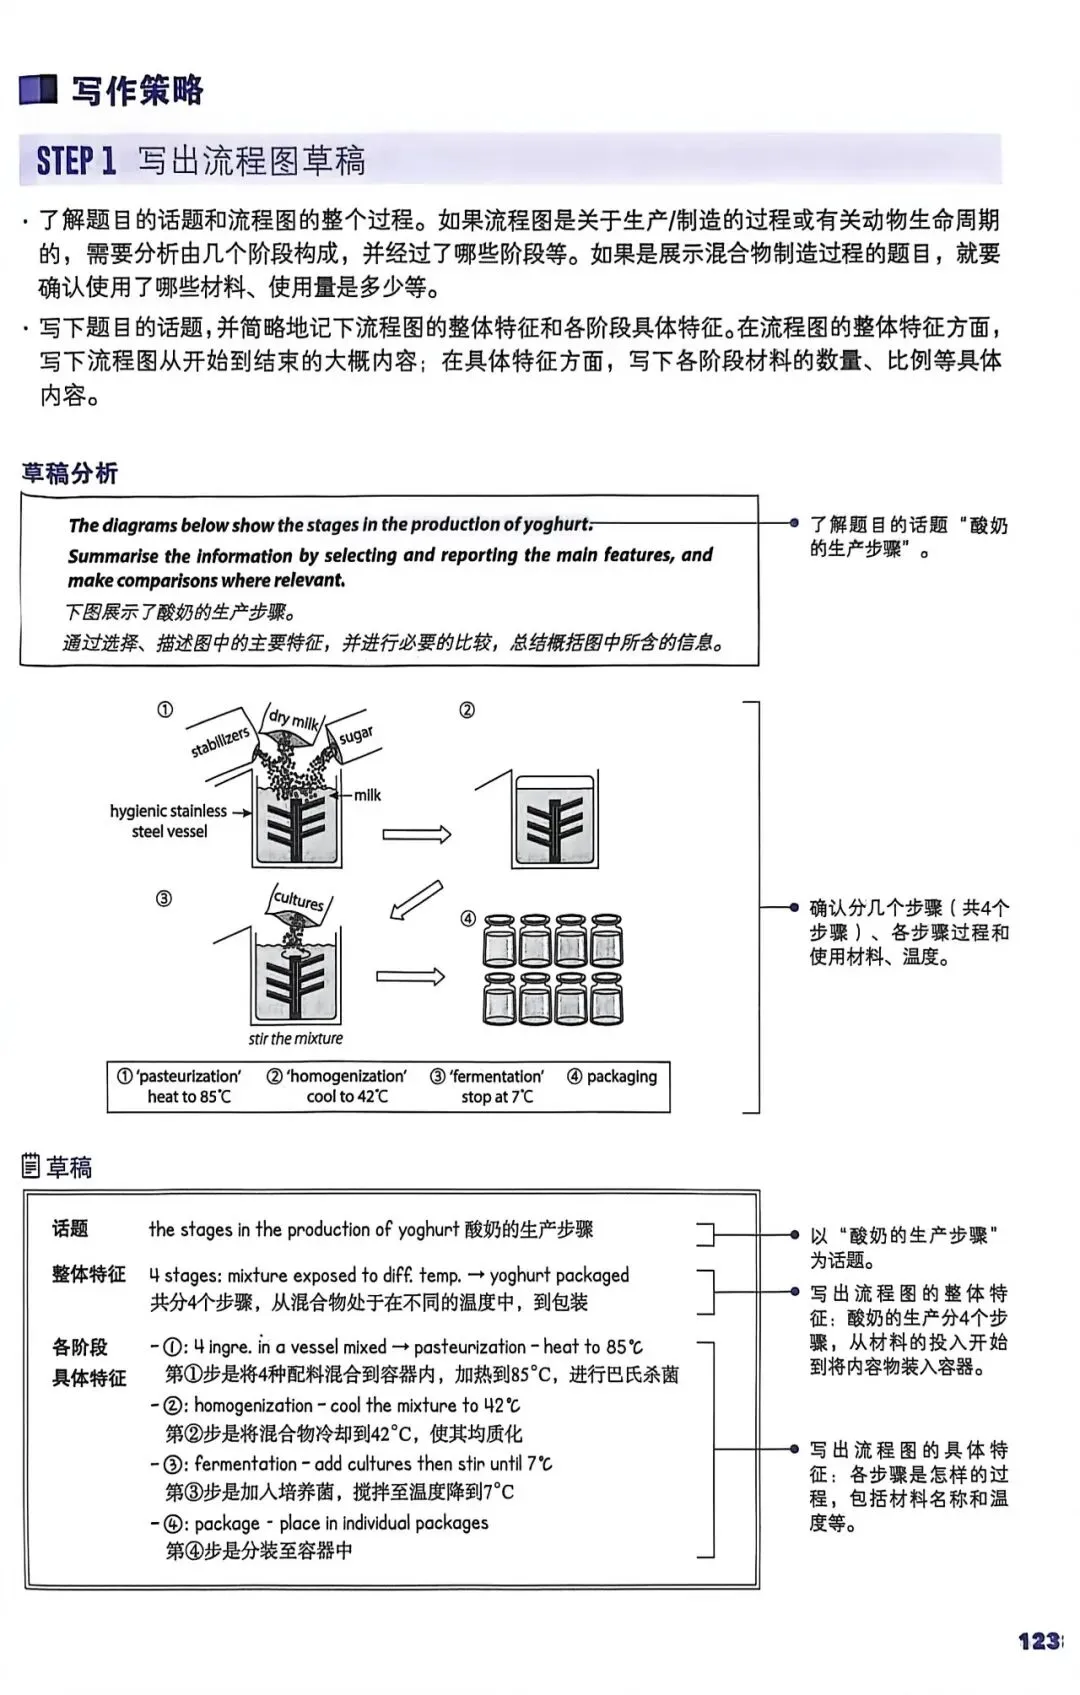
1. The diagram shows the_____________(多步骤的)process of producing ______.
2. Overall, it is clear that yoghurt is made through a ______-stage process in which a mixture of various substances ___ _____ _____different temperatures.This ______(将......变成) the mixture____ yohurt ,which is then packaged.
3. Looking at the diagram more closely, one can see thatthe process begins when the ingredientswhich consist of _______ ______ _____ and _______ , _____ _______in a______ ____ _____ _____(洁净的不锈钢容器).At this point , this mixture is _____ _____ _______,starting the homogenization process.Thenis cooled down to ______°C.
After this phrase is completed ,cultures ____ _____ (被添加)____ ______(搅拌) to begin the fermentation. and the mixture _____ ______(被搅拌、搅动)until the temperature drops to ______°C, and the fermentation process ends.In the final step,The_____ ______(成品)is ______ _______ ______ ______(被打包成单独的容器里)for sale.
二、地图变化类(萨默维尔镇)填空题
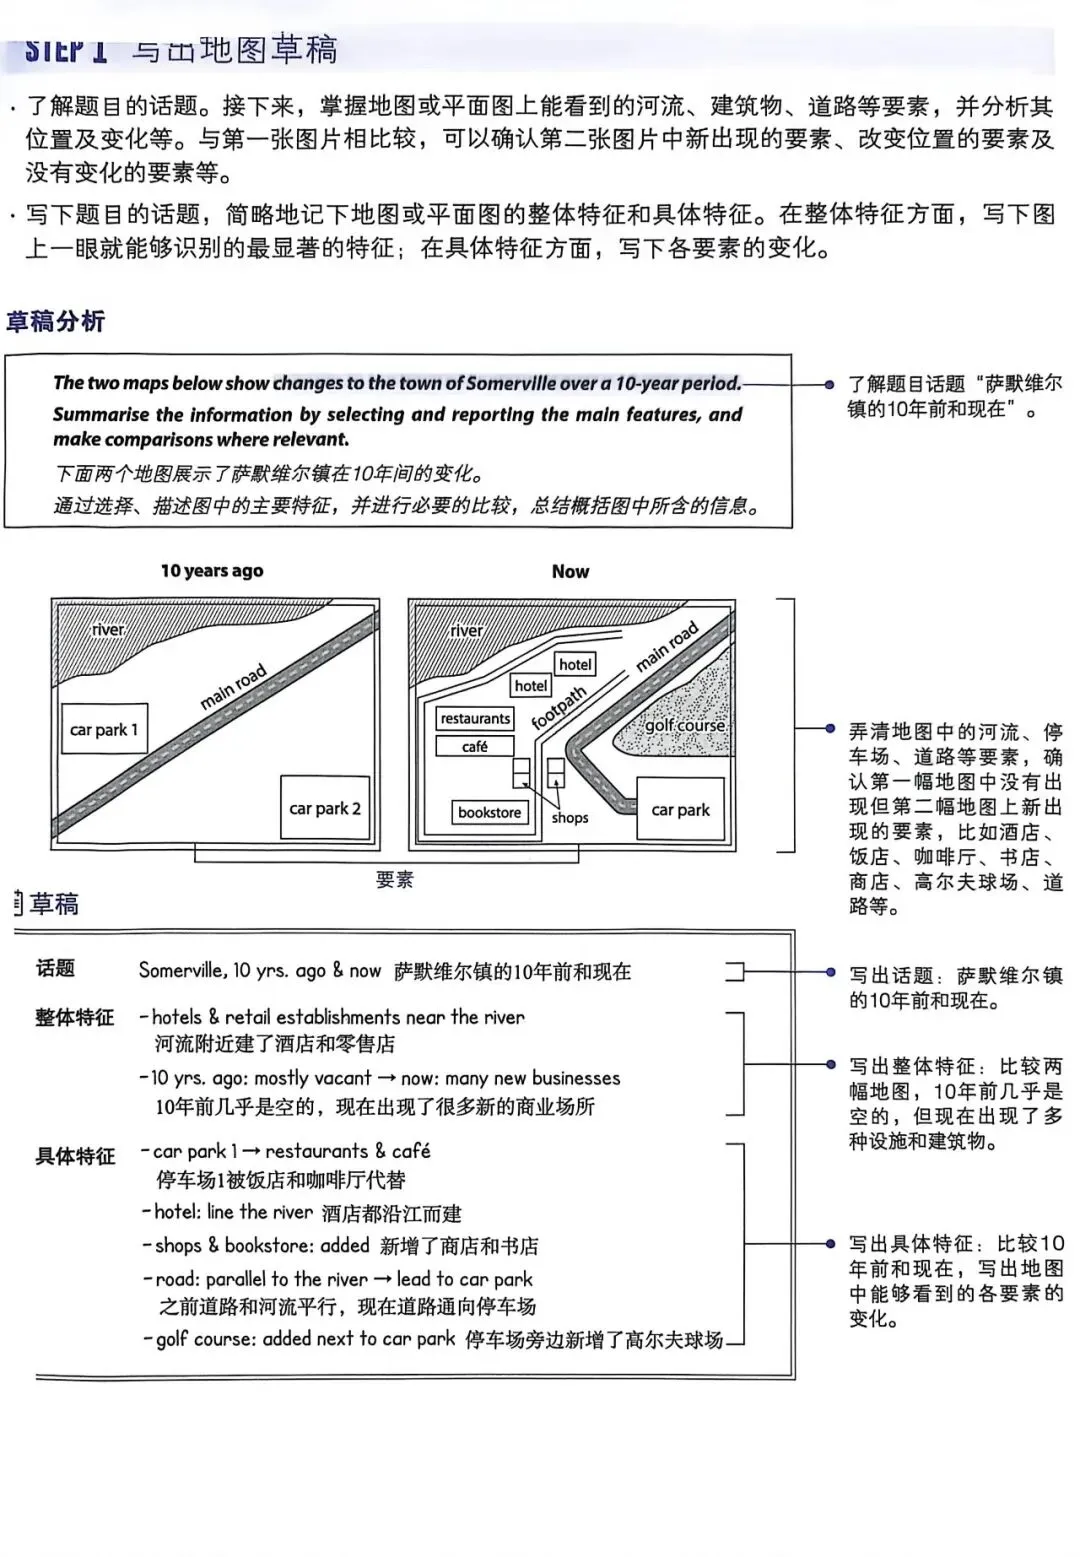
1. The maps show the__________ in the town of Somerville over a 10-year period.
2. Overall, it is clear that ______ and _____ ______ _________have been built near the river. Ten years ago, the land was mostly ________, but now ___________________________-.
3. Looking at the maps more closely, one can see that, ____ ______ ________ ______ to the town was _______ _______ ____ the car park(最大的变化是停车场1没有了)and _______ ________ ____________ _________ _______ _______ ____________ in its place.
4. Furthermore, hotels now line the river along _____ ______ ______(沿着河和一条新路修建.Some _______and a ______ have been also added near this areaover the years, completely_______ ________ _____ (完全改变了这个地方的原貌).The other ____________ ____________ was ______ ________ _______ ______ ________(另一个巨大的变化是道路的改道), which used to be _________ _______ _____ ______(与河流平行).It is now _____________________________________________________________.现在是弯曲向前,通向停车场. Finally, a large ______ ______ was__________next to the car park.

三、表格类(牛肉出口)填空题
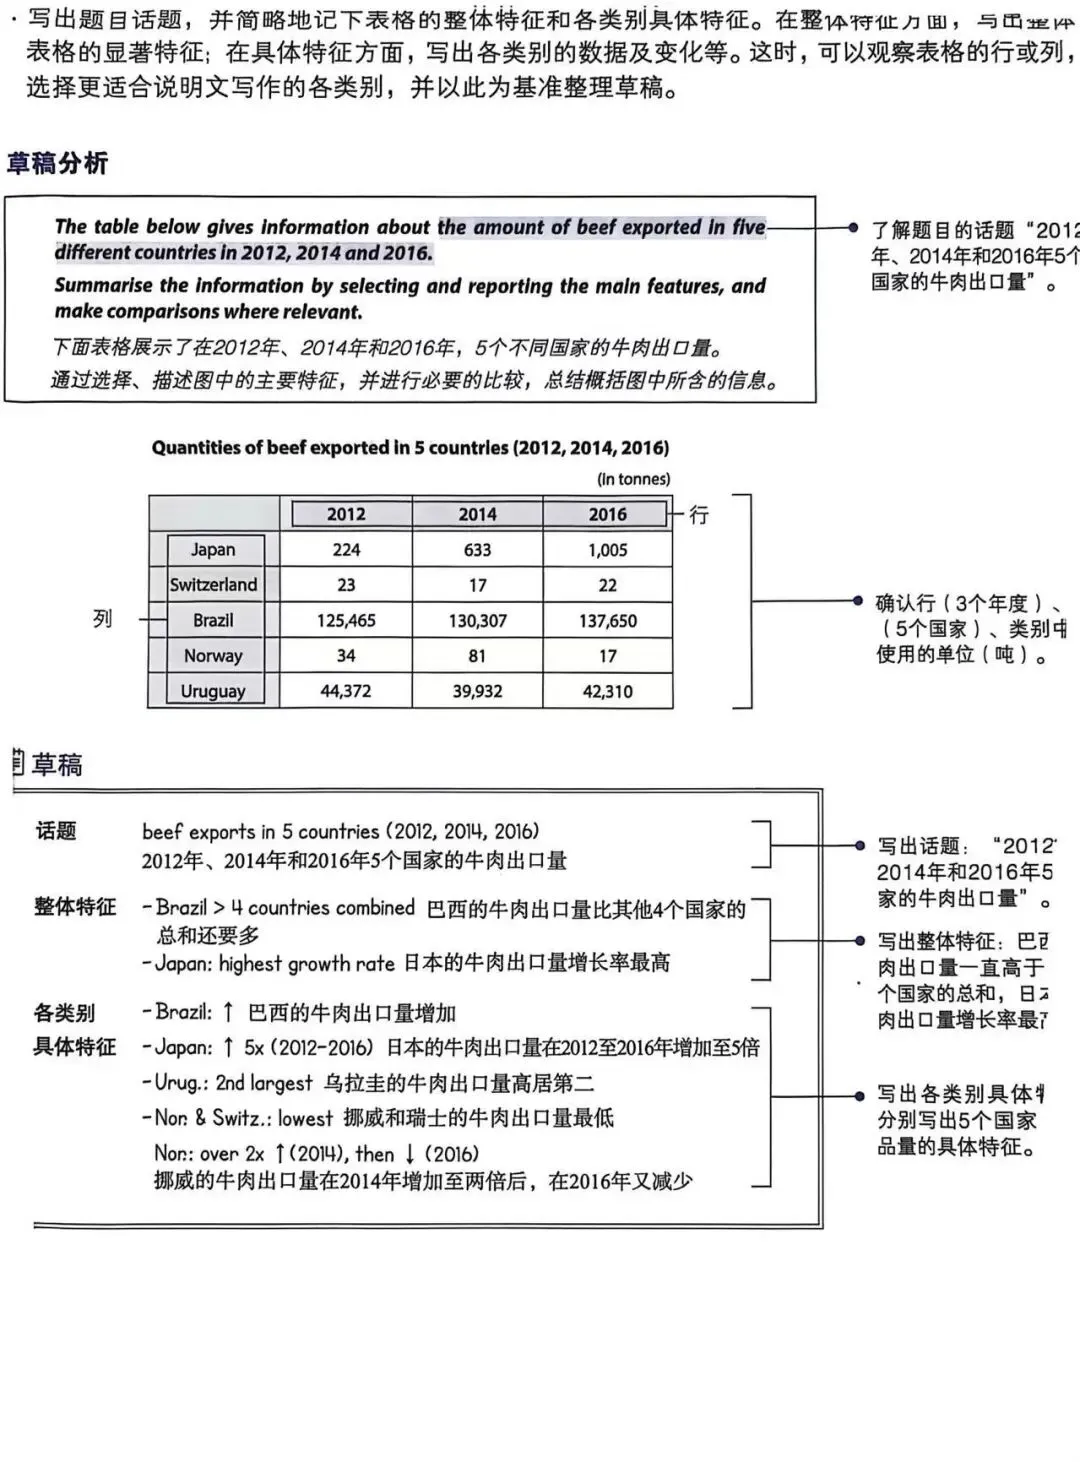
The table shows information about ____________________________________
_________ in the year 2012,2014,and2016.
Overall, it is clear that ________ exported _____ ______ than _____ _______ _______and _______ combined.It is noticeable that ________ had _____ _______growth rate during this period.
Looking at the table more closely, one can see that________________________exported_____ _________125,465 to 137,650 tonnes between 2012 and 2016. During the same period, a _____ _______ _________ was seen in Japan, where_______ _______ ______ ______ almost five times what they were in 2012.The second largest beef exporter was Uruguay, which consistently _________ around 40,000 tonnes every year.] In contrast, [Norway and Switzerland ____ _____ ____ _____ ______ , with both nations shipping out under 100 tonnes in all three years. Interestingly, Norway did experience_____ _____ in 2014, when its beef exports ____ _____ ____ , but this figure sharply _______ by the year 2016.]
四、饼图类(加拿大大学学位)填空题
1. The pie charts show the proportion of students pursuing specific types of degrees at a Canadian university in ______ and ______.
2. Overall, it is clear that most students were studying for a ______’s degree in both years, and the percentage of students in the other three degree programs increased, with the ______’s degree seeing a massive gain.
3. Looking at the pie charts more closely, one can see that:
◦ The proportion of bachelor’s degree students dropped from over three-quarters to ______ percent by 2000.
◦ The share of master’s degree students nearly ______ (quadrupled) from 9% in 1980.
◦ The shares of doctoral and associate degrees went up by only ______ and ______ percentage points respectively
五、线形图类(石油使用率)填空题
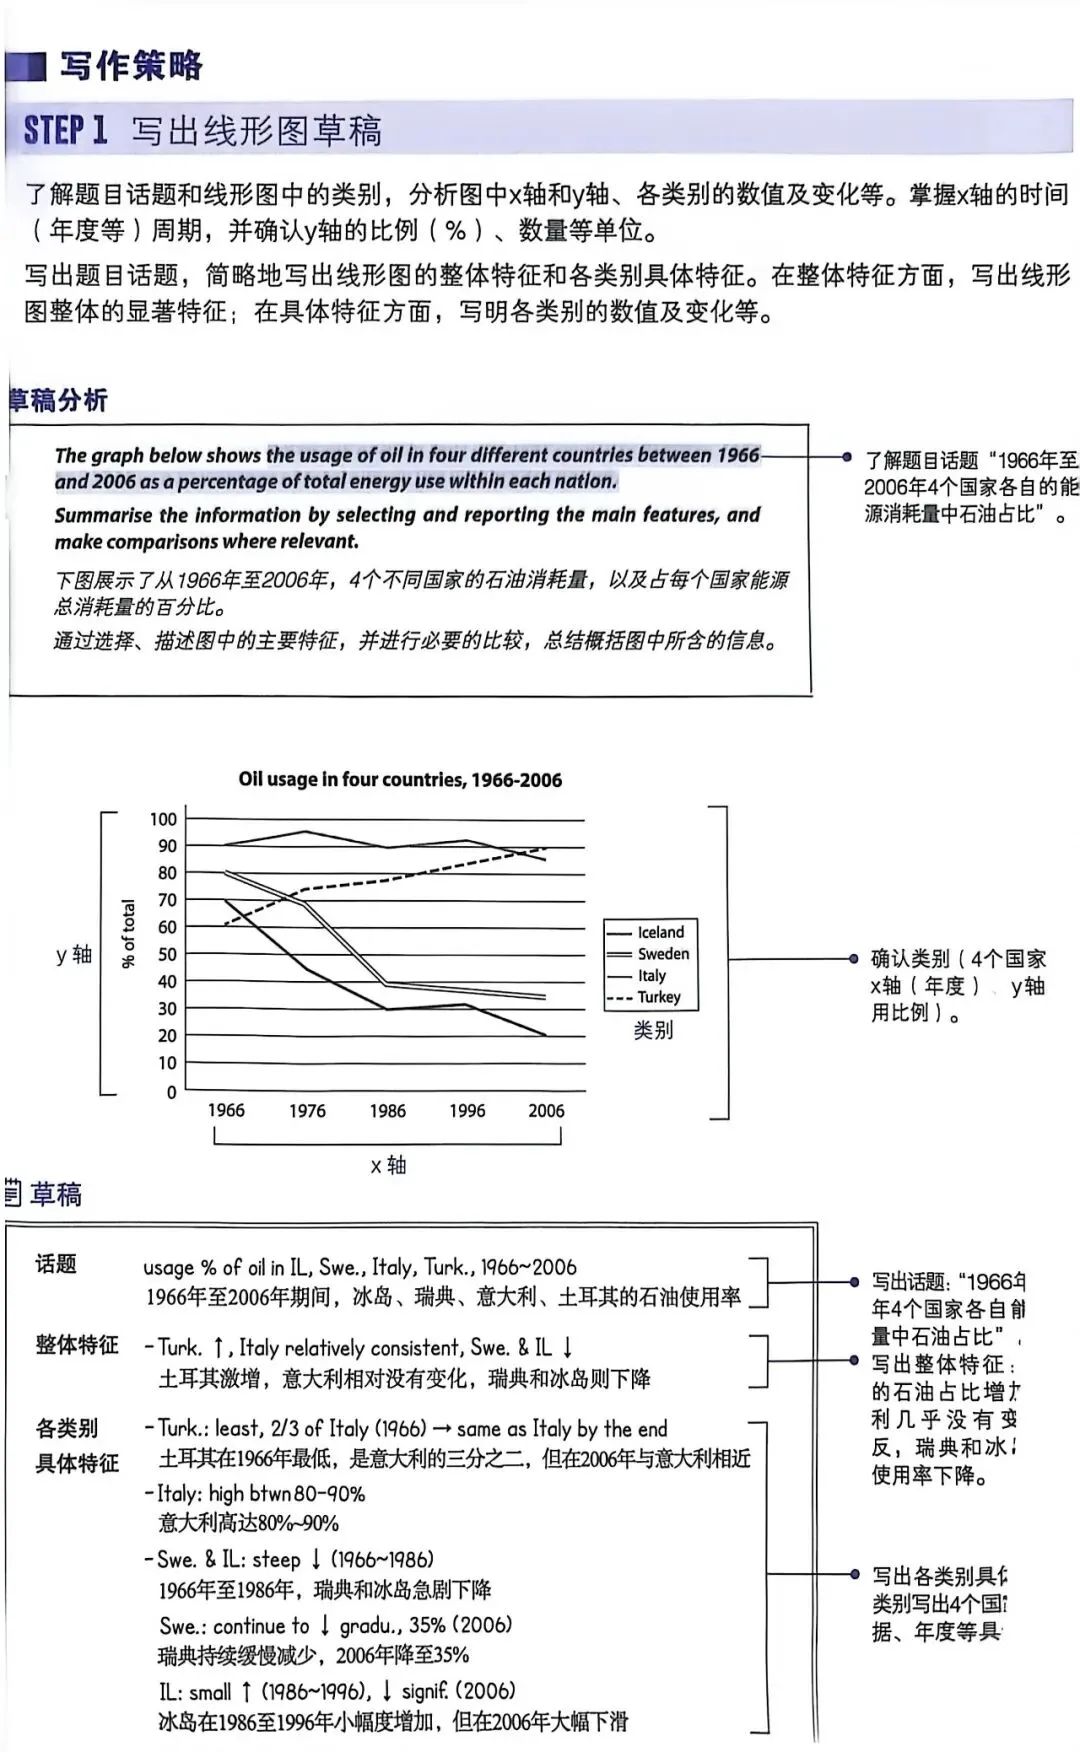
1. The line graph shows the percentage of oil used in Iceland, Sweden, Italy, and Turkey from ______ to ______.
2. Overall, it is clear that ______’s proportion of oil use surged over the period, while Italy remained _______ _______ , and Sweden and Iceland’s percentages ______.
3. Looking at the graph more closely, one can see thatTurkey had _____ ________oil use in 1966 (around ______ percent), but______90% by 2006,___________Italy.
4.Italy _______ (保持)a share of between ______ to ______ percent throughout the period.
5.Sweden and Iceland______ _____ ______ _______ in the first half of the period, each dropping approximately ______ percentage points.
6.By 2006, Sweden’s oil use____ _____ ______ percent, and Iceland’s ______ _____ around ______ percent, the lowest among the four countries.
六、柱状图(2002年4国男女就业率)填空题
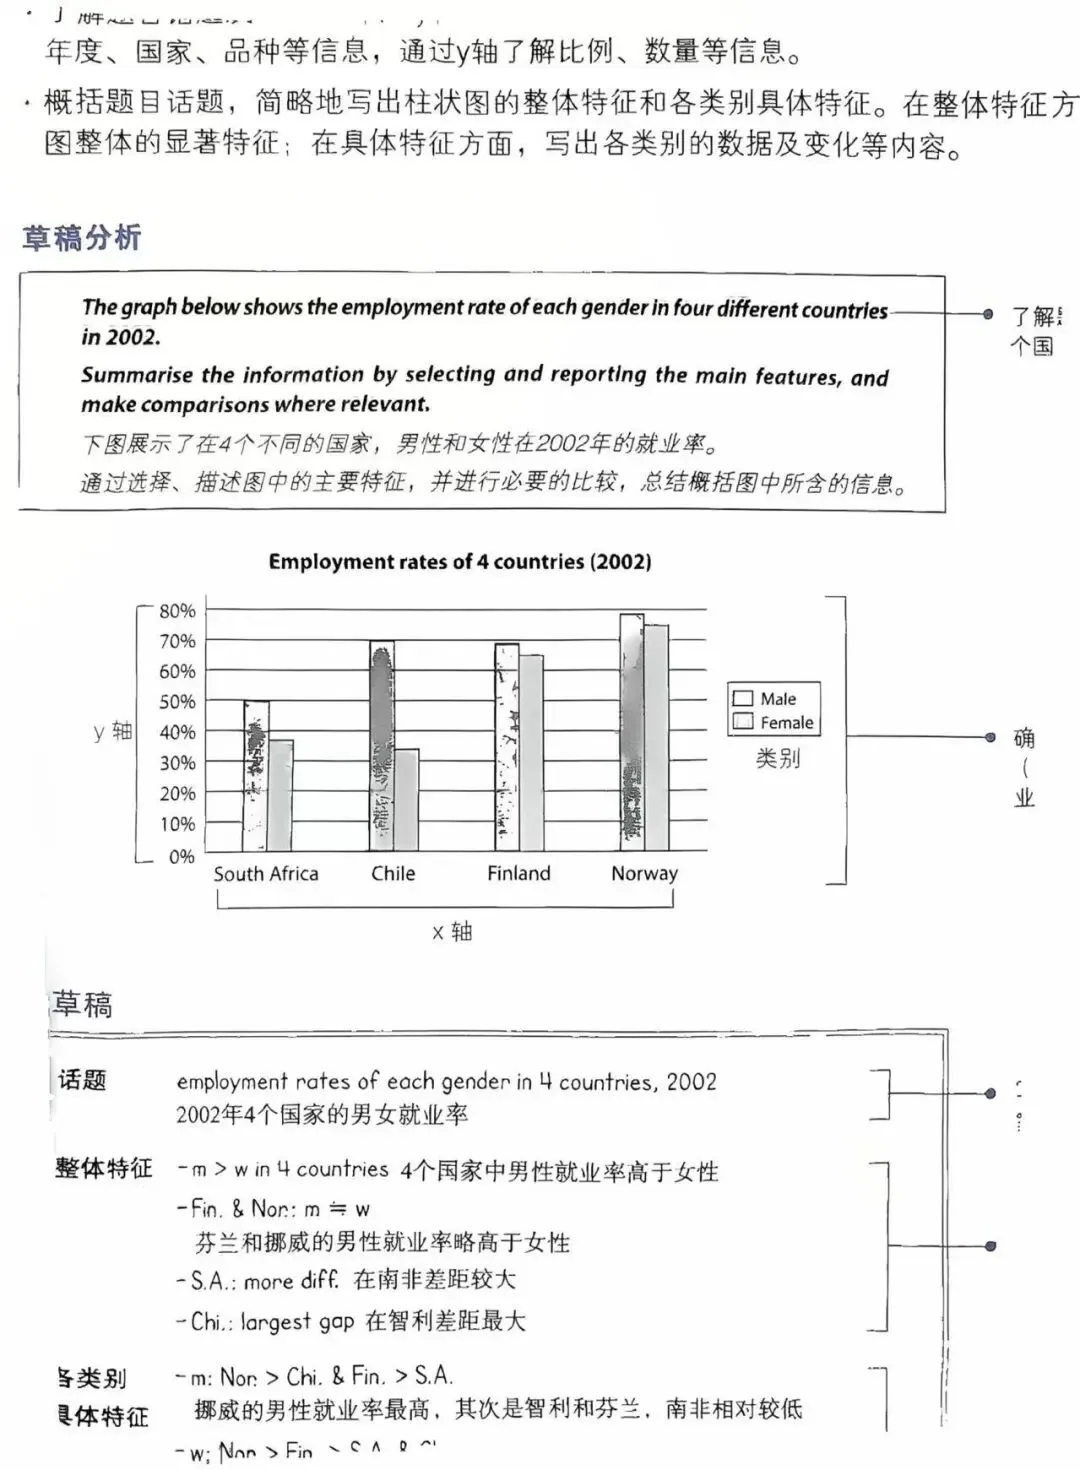
1. The bar graph shows the_________ _________of men and women in ______,______, _____, and _______in 2002.
2. Overall, it is clear that the proportion of men in the workforce was ______ than that of women in all four countries.
3. Also noticeable is that the employment figures for the two sexes in Finland and Norway were ______ __________, while there was _______ _______ ________in South Africa and Chile.In the latter case, the gap between the percentage of men and women was the _________.
4. Looking at the graph more closely, one can see that nearly ______ percent of Norwegian men were _____ __________, the______ ________among the four countries.
5. The proportions of employed Chilean and Finnish men were close at around ______ percent.
6. Only about ______ percent of South African men held jobs.
7. For women, ______ had the highest employment rate at above 70 percent, followed by Finland at around 65 percent.
8. The rates for South Africa and Chile were lower, with only about ______ percent of women working in both countries.
9. Notably, Chile’s female employment rate was only ______ of its male rate.
备注

一、2026 年雅思小作文新题专项训练材料
核心是6 类高频题型填空模板,帮考生快速套用写作、对标 6.5–7 分水平。
发布时间:2026 年 3 月 适用:雅思 A 类 Task 1 小作文 形式:写作方法 + 草稿分析 + 填空模板 覆盖:流程、地图、表格、饼图、线形图、柱状图
二、6 大题型核心内容
流程类(酸奶生产)4 个步骤:混合配料→巴氏杀菌 85°C→均质冷却 42°C→发酵加菌种至 7°C→包装模板:按步骤顺序写,用被动语态、温度与工序动词。
地图变化类(萨默维尔镇 10 年变迁)重点:沿河新建建筑、道路改道、停车场改造、新旧对比。模板:总述变化→分点讲拆除 / 新增 / 改道。
表格类(多国牛肉出口 2012–2016)重点:出口大国、倍数增长、稳定出口、微量出口、波动回落。模板:抓极值、对比、趋势。
饼图类(加拿大大学学位 1980–2000)重点:学士占比下降、硕士大幅增长、博士 / 副学士小幅上升。模板:占比、倍数、百分点变化。
线形图(4 国石油使用率 1966–2006)重点:土耳其飙升、意大利平稳、瑞典 / 冰岛下降。模板:总趋势→分段变化→终点对比。
柱状图(4 国男女就业率 2002)重点:男性就业率普遍更高;北欧差距小,南非 / 智利差距大。模板:性别差异、国家对比、极值比例。
三、写作方法(文档自带)
先写草稿:确定话题、总阶段 / 总变化、关键数据 结构:开头改写题目 → 概述总体特征 → 细节描述 要求:抓主要信息、做对比、不堆砌数字
四、分数定位
模板水平:雅思小作文 6.5 分 升级句型、加强对比后:可达到 7.0 分
