


文档内容
Numerical Critical Reasoning
Test 4
Solutions Booklet
Instructions
This numerical reasoning test comprises 20 questions, and you will have to correctly
answer as many as you can. Calculators are permitted for this test, and it is
recommended you have some rough paper to work on.
You will have to work quickly and accurately to perform well in this test. The test does
not have an overall time limit however each question does has a time limit. The first
question relating to each table or graph has 90 seconds, and subsequent questions
relating to the same table or graph have 75 seconds.
Try to find a time and place where you will not be interrupted during the test. The test
will begin on the next page.
AssessmentDay
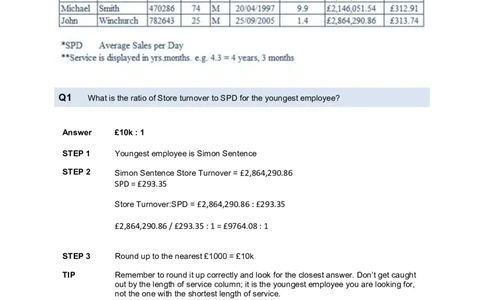
Practice Aptitude TestsQ1 What is the ratio of Store turnover to SPD for the youngest employee?
Answer £10k : 1
STEP 1 Youngest employee is Simon Sentence
STEP 2 Simon Sentence Store Turnover = £2,864,290.86
SPD = £293.35
Store Turnover:SPD = £2,864,290.86 : £293.35
£2,864,290.86 / £293.35 : 1 = £9764.08 : 1
STEP 3 Round up to the nearest £1000 = £10k
TIP Remember to round it up correctly and look for the closest answer. Don’t get caught
out by the length of service column; it is the youngest employee you are looking for,
not the one with the shortest length of service.
Copyright AssessmentDay. Unauthorised copying Page 2 AssessmentDay
or distribution in printed, electronic, or any other
form in whole or in part, is prohibited without
Document last updated 26-03-2013
www.assessmentday.co.uk
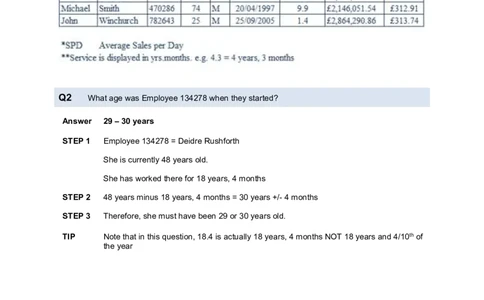
prior written permission from AssessmentDay.Q2 What age was Employee 134278 when they started?
Answer 29 – 30 years
STEP 1 Employee 134278 = Deidre Rushforth
She is currently 48 years old.
She has worked there for 18 years, 4 months
STEP 2 48 years minus 18 years, 4 months = 30 years +/- 4 months
STEP 3 Therefore, she must have been 29 or 30 years old.
TIP Note that in this question, 18.4 is actually 18 years, 4 months NOT 18 years and 4/10th of
the year
Copyright AssessmentDay. Unauthorised copying Page 3 AssessmentDay
or distribution in printed, electronic, or any other
form in whole or in part, is prohibited without
Document last updated 26-03-2013
www.assessmentday.co.uk
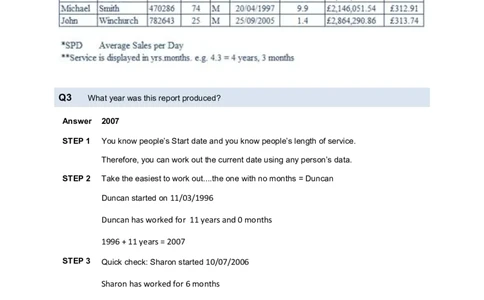
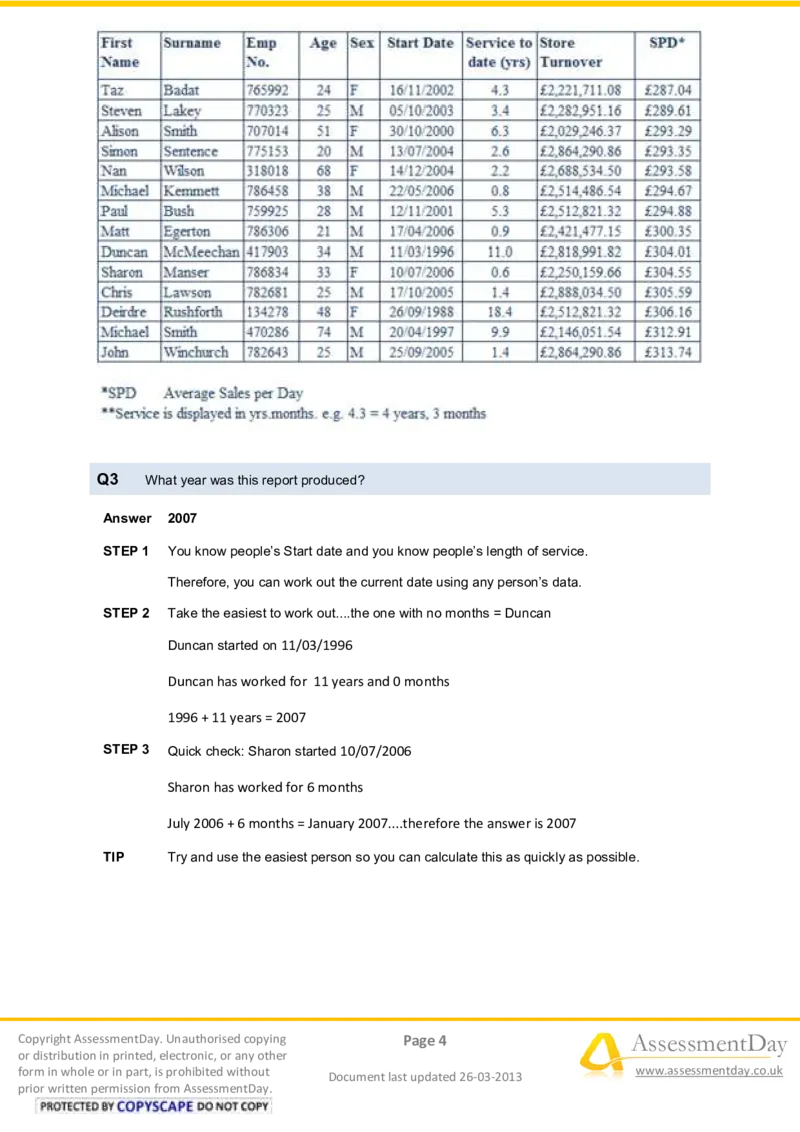
prior written permission from AssessmentDay.Q3 What year was this report produced?
Answer 2007
STEP 1 You know people’s Start date and you know people’s length of service.
Therefore, you can work out the current date using any person’s data.
STEP 2 Take the easiest to work out....the one with no months = Duncan
Duncan started on 11/03/1996
Duncan has worked for 11 years and 0 months
1996 + 11 years = 2007
STEP 3 Quick check: Sharon started 10/07/2006
Sharon has worked for 6 months
July 2006 + 6 months = January 2007....therefore the answer is 2007
TIP Try and use the easiest person so you can calculate this as quickly as possible.
Copyright AssessmentDay. Unauthorised copying Page 4 AssessmentDay
or distribution in printed, electronic, or any other
form in whole or in part, is prohibited without
Document last updated 26-03-2013
www.assessmentday.co.uk
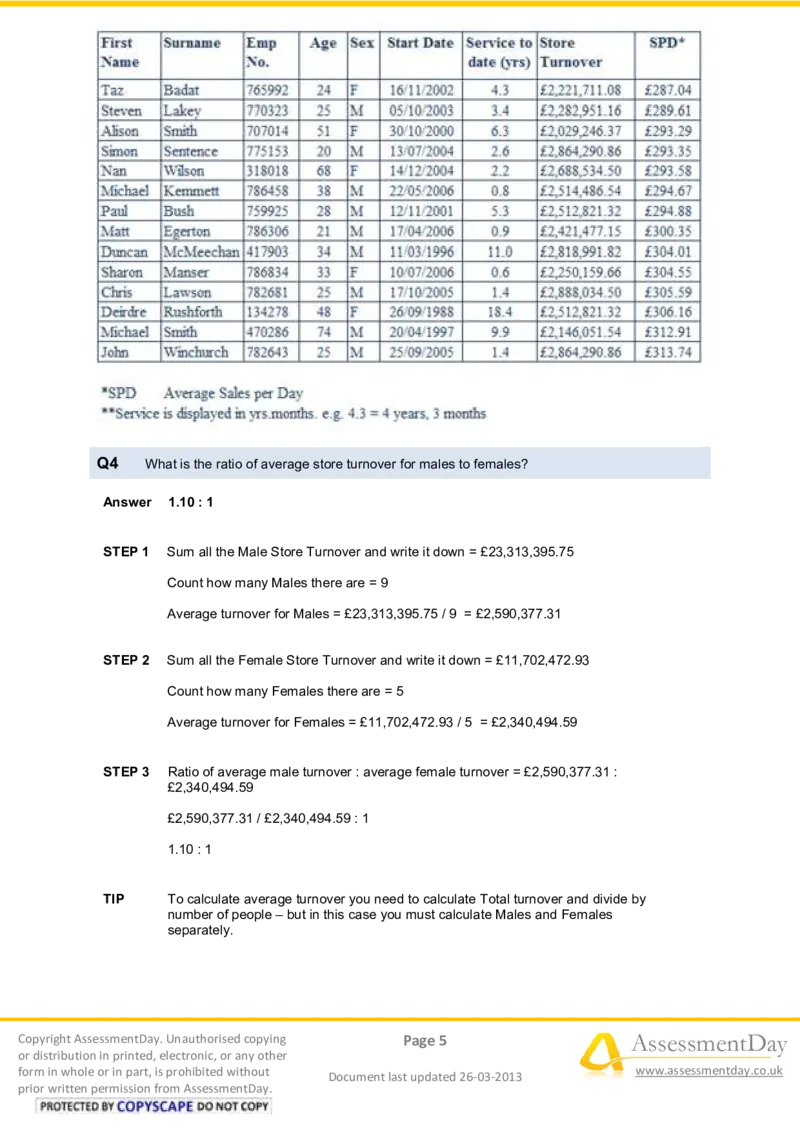
prior written permission from AssessmentDay.Q4 What is the ratio of average store turnover for males to females?
Answer 1.10 : 1
STEP 1 Sum all the Male Store Turnover and write it down = £23,313,395.75
Count how many Males there are = 9
Average turnover for Males = £23,313,395.75 / 9 = £2,590,377.31
STEP 2 Sum all the Female Store Turnover and write it down = £11,702,472.93
Count how many Females there are = 5
Average turnover for Females = £11,702,472.93 / 5 = £2,340,494.59
STEP 3 Ratio of average male turnover : average female turnover = £2,590,377.31 :
£2,340,494.59
£2,590,377.31 / £2,340,494.59 : 1
1.10 : 1
TIP To calculate average turnover you need to calculate Total turnover and divide by
number of people – but in this case you must calculate Males and Females
separately.
Copyright AssessmentDay. Unauthorised copying Page 5 AssessmentDay
or distribution in printed, electronic, or any other
form in whole or in part, is prohibited without
Document last updated 26-03-2013
www.assessmentday.co.uk
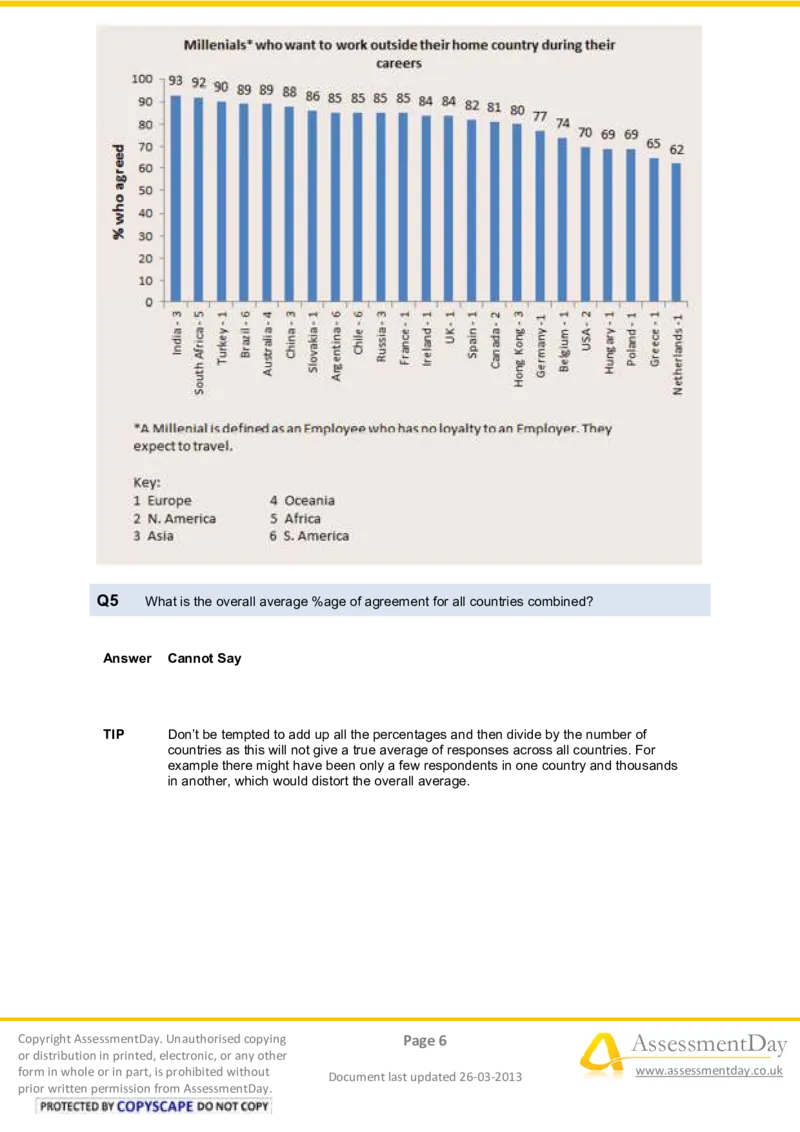
prior written permission from AssessmentDay.Q5 What is the overall average %age of agreement for all countries combined?
Answer Cannot Say
TIP Don’t be tempted to add up all the percentages and then divide by the number of
countries as this will not give a true average of responses across all countries. For
example there might have been only a few respondents in one country and thousands
in another, which would distort the overall average.
Copyright AssessmentDay. Unauthorised copying Page 6 AssessmentDay
or distribution in printed, electronic, or any other
form in whole or in part, is prohibited without
Document last updated 26-03-2013
www.assessmentday.co.uk
prior written permission from AssessmentDay.Q6 What was the highest %age of agreement for a country within Europe?
Answer 90%
STEP 1 Notice that the key tells us which countries are in Europe. All we have to do now is
read the highest percentage from the graph, which is for Turkey.
Therefore the correct answer is 90%.
TIP You are not expected to know which countries are in Europe – you have been told in
the data.
Copyright AssessmentDay. Unauthorised copying Page 7 AssessmentDay
or distribution in printed, electronic, or any other
form in whole or in part, is prohibited without
Document last updated 26-03-2013
www.assessmentday.co.uk
prior written permission from AssessmentDay.Q7 What percentage of Asian Millenials did not want to leave their country?
Answer Cannot Say
STEP 1 The data gives us the percent of people within each country who want to work outside
their home country during their careers. We should not assume the other side of the
results give people who actively do not want to leave; perhaps they are unsure or
perhaps they do want to leave the country but not during their careers.
The other reason this question is cannot say is that it would be wrong to add up the
percentages and divide by the number of Asian countries (four). This method would
only give the percentage for Asia as a whole if each of the four constituent counties
had exactly the same population.
Copyright AssessmentDay. Unauthorised copying Page 8 AssessmentDay
or distribution in printed, electronic, or any other
form in whole or in part, is prohibited without
Document last updated 26-03-2013
www.assessmentday.co.uk
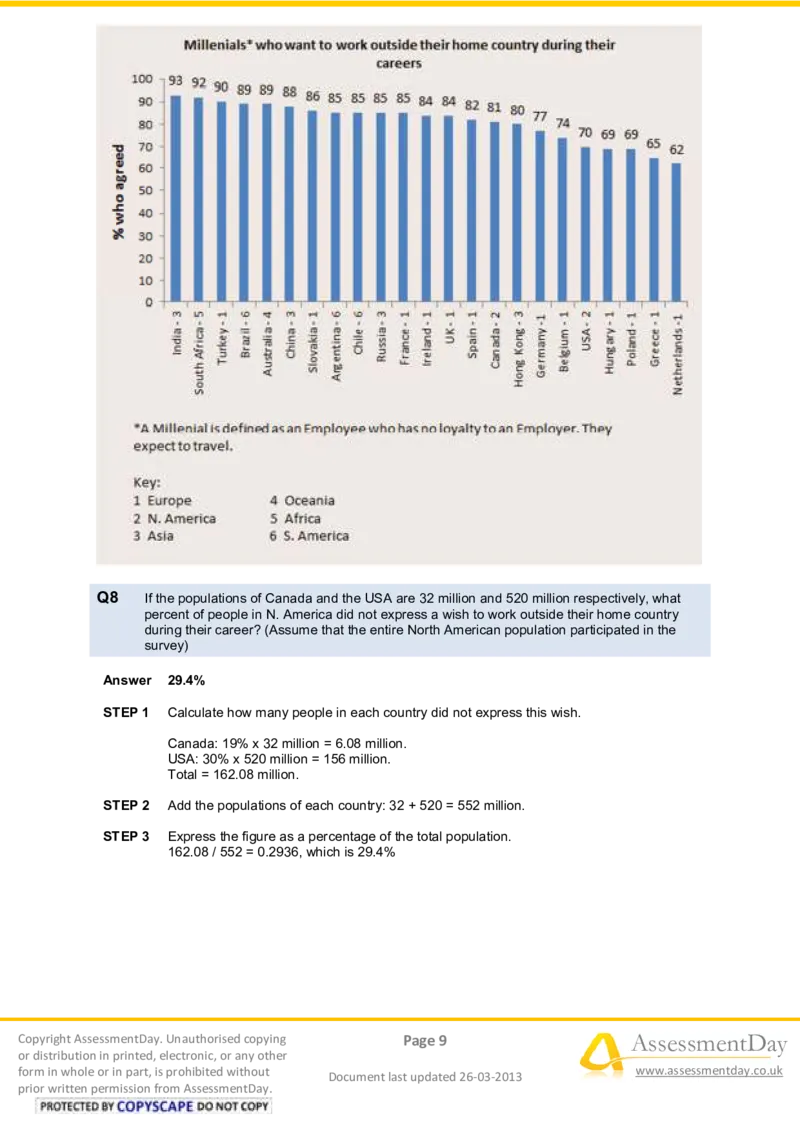
prior written permission from AssessmentDay.Q8 If the populations of Canada and the USA are 32 million and 520 million respectively, what
percent of people in N. America did not express a wish to work outside their home country
during their career? (Assume that the entire North American population participated in the
survey)
Answer 29.4%
STEP 1 Calculate how many people in each country did not express this wish.
Canada: 19% x 32 million = 6.08 million.
USA: 30% x 520 million = 156 million.
Total = 162.08 million.
STEP 2 Add the populations of each country: 32 + 520 = 552 million.
STEP 3 Express the figure as a percentage of the total population.
162.08 / 552 = 0.2936, which is 29.4%
Copyright AssessmentDay. Unauthorised copying Page 9 AssessmentDay
or distribution in printed, electronic, or any other
form in whole or in part, is prohibited without
Document last updated 26-03-2013
www.assessmentday.co.uk
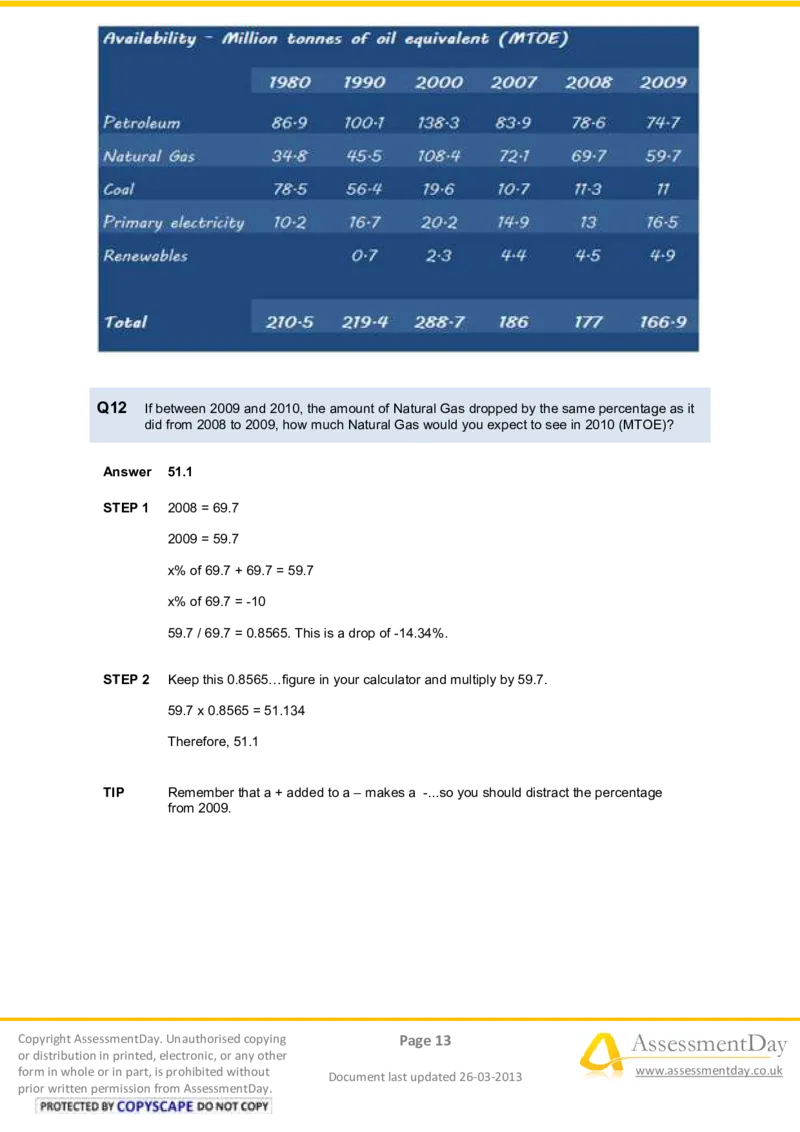
prior written permission from AssessmentDay.Q9 Which year recorded the most Coal availability?
Answer 1980
STEP 1 Simply look at the table and find which year had the most Coal = 1980
TIP Sometimes you aren’t expected to work anything out.
Copyright AssessmentDay. Unauthorised copying Page 10 AssessmentDay
or distribution in printed, electronic, or any other
form in whole or in part, is prohibited without
Document last updated 26-03-2013
www.assessmentday.co.uk
prior written permission from AssessmentDay.Q10 What was the percentage change in Natural Gas quantity from 1990 to 2000?
Answer Increase of >100%
STEP 1 1990 = 45.5 million tonnes
2000 = 108.4 million tonnes
STEP 2 108.4m / 45.5m = 2.3824. This is an increase of 138%
TIP You can see that there has been an increase from just looking at the figures.
Copyright AssessmentDay. Unauthorised copying Page 11 AssessmentDay
or distribution in printed, electronic, or any other
form in whole or in part, is prohibited without
Document last updated 26-03-2013
www.assessmentday.co.uk
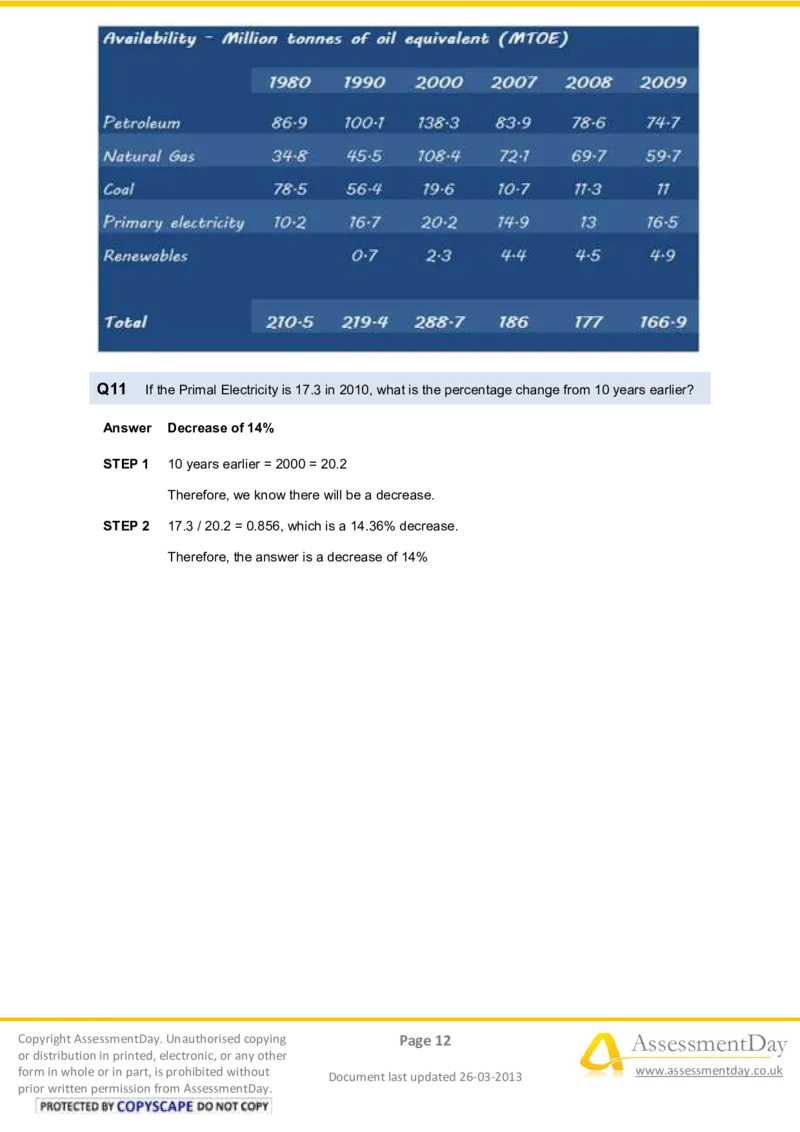
prior written permission from AssessmentDay.Q11 If the Primal Electricity is 17.3 in 2010, what is the percentage change from 10 years earlier?
Answer Decrease of 14%
STEP 1 10 years earlier = 2000 = 20.2
Therefore, we know there will be a decrease.
STEP 2 17.3 / 20.2 = 0.856, which is a 14.36% decrease.
Therefore, the answer is a decrease of 14%
Copyright AssessmentDay. Unauthorised copying Page 12 AssessmentDay
or distribution in printed, electronic, or any other
form in whole or in part, is prohibited without
Document last updated 26-03-2013
www.assessmentday.co.uk
prior written permission from AssessmentDay.Q12 If between 2009 and 2010, the amount of Natural Gas dropped by the same percentage as it
did from 2008 to 2009, how much Natural Gas would you expect to see in 2010 (MTOE)?
Answer 51.1
STEP 1 2008 = 69.7
2009 = 59.7
x% of 69.7 + 69.7 = 59.7
x% of 69.7 = -10
59.7 / 69.7 = 0.8565. This is a drop of -14.34%.
STEP 2 Keep this 0.8565…figure in your calculator and multiply by 59.7.
59.7 x 0.8565 = 51.134
Therefore, 51.1
TIP Remember that a + added to a – makes a -...so you should distract the percentage
from 2009.
Copyright AssessmentDay. Unauthorised copying Page 13 AssessmentDay
or distribution in printed, electronic, or any other
form in whole or in part, is prohibited without
Document last updated 26-03-2013
www.assessmentday.co.uk
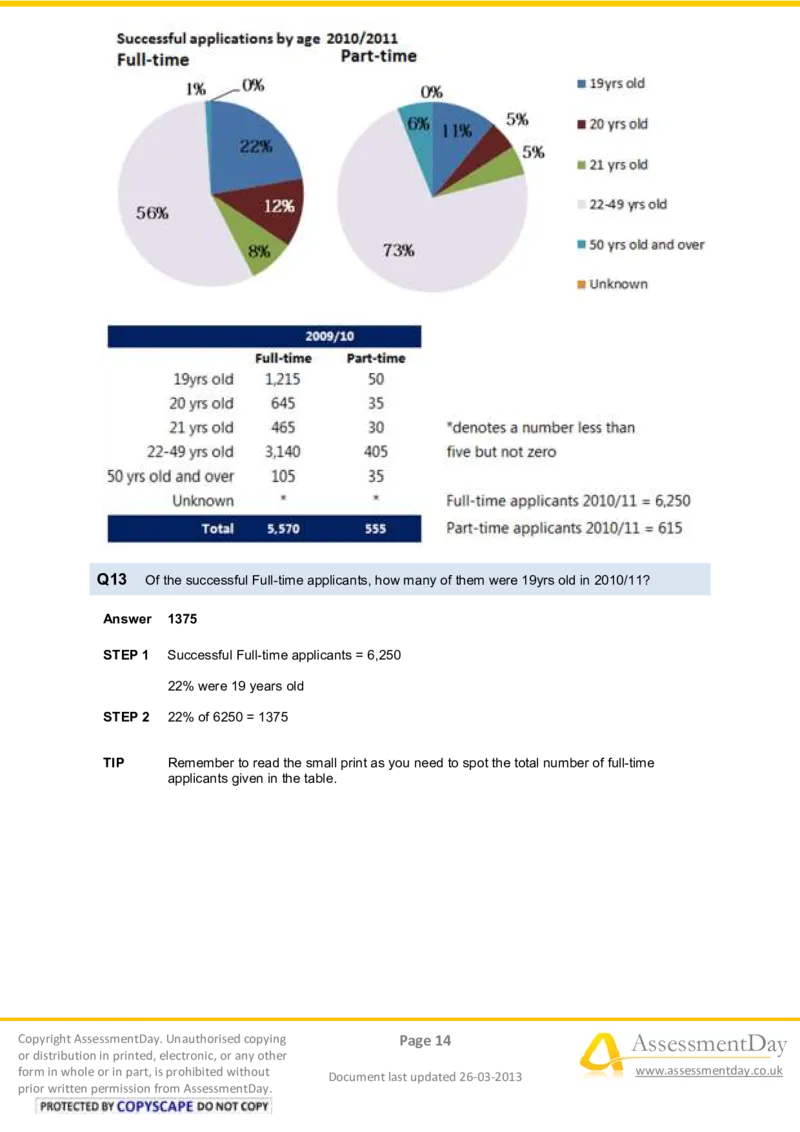
prior written permission from AssessmentDay.Q13 Of the successful Full-time applicants, how many of them were 19yrs old in 2010/11?
Answer 1375
STEP 1 Successful Full-time applicants = 6,250
22% were 19 years old
STEP 2 22% of 6250 = 1375
TIP Remember to read the small print as you need to spot the total number of full-time
applicants given in the table.
Copyright AssessmentDay. Unauthorised copying Page 14 AssessmentDay
or distribution in printed, electronic, or any other
form in whole or in part, is prohibited without
Document last updated 26-03-2013
www.assessmentday.co.uk
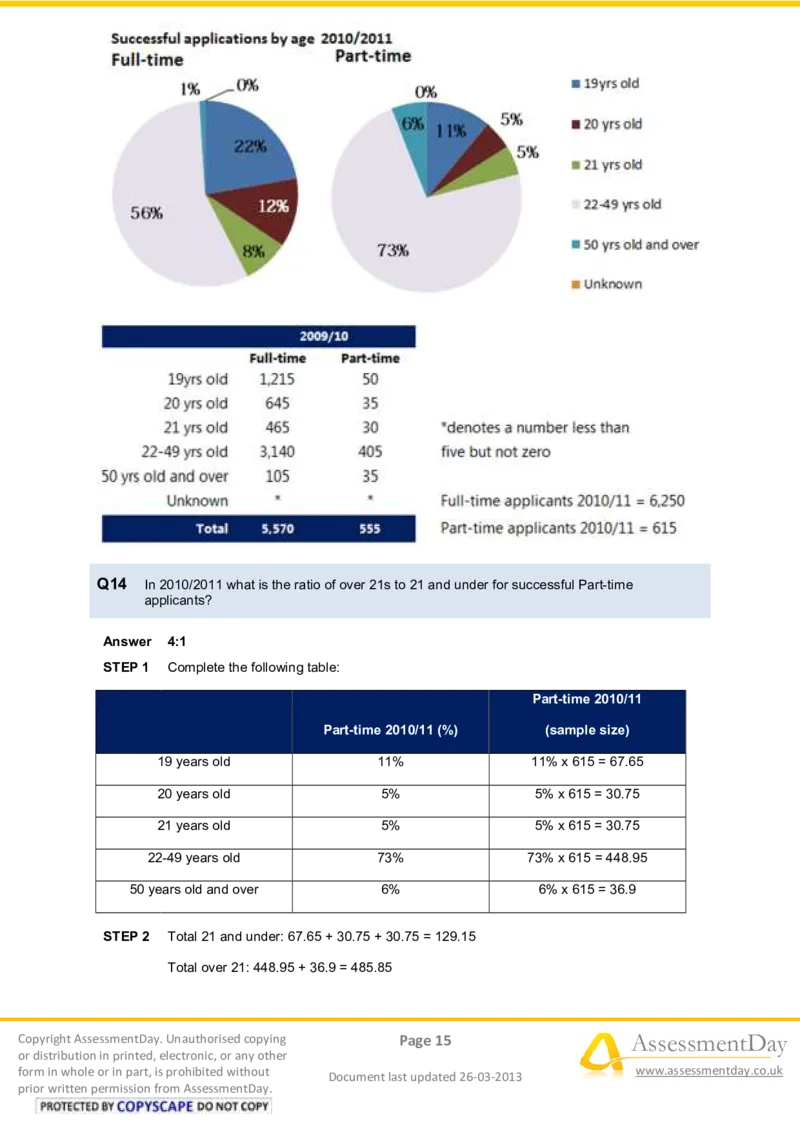
prior written permission from AssessmentDay.Q14 In 2010/2011 what is the ratio of over 21s to 21 and under for successful Part-time
applicants?
Answer 4:1
STEP 1 Complete the following table:
Part-time 2010/11
Part-time 2010/11 (%) (sample size)
19 years old 11% 11% x 615 = 67.65
20 years old 5% 5% x 615 = 30.75
21 years old 5% 5% x 615 = 30.75
22-49 years old 73% 73% x 615 = 448.95
50 years old and over 6% 6% x 615 = 36.9
STEP 2 Total 21 and under: 67.65 + 30.75 + 30.75 = 129.15
Total over 21: 448.95 + 36.9 = 485.85
Copyright AssessmentDay. Unauthorised copying Page 15 AssessmentDay
or distribution in printed, electronic, or any other
form in whole or in part, is prohibited without
Document last updated 26-03-2013
www.assessmentday.co.uk
prior written permission from AssessmentDay.STEP 3 Calculate the ratio of Over 21 : 21 and under
485.85 : 129.15 which if you divide both sides by 129.15 simplifies to
1 = 3.76
Copyright AssessmentDay. Unauthorised copying Page 16 AssessmentDay
or distribution in printed, electronic, or any other
form in whole or in part, is prohibited without
Document last updated 26-03-2013
www.assessmentday.co.uk
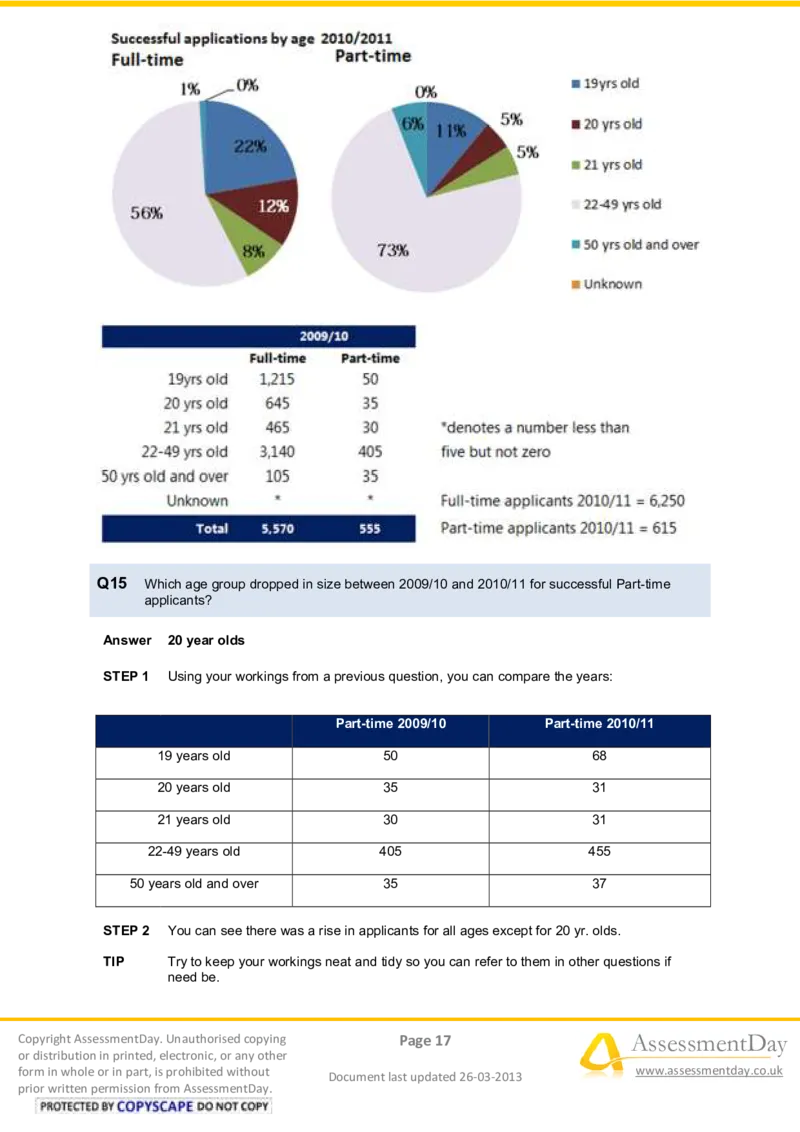
prior written permission from AssessmentDay.Q15 Which age group dropped in size between 2009/10 and 2010/11 for successful Part-time
applicants?
Answer 20 year olds
STEP 1 Using your workings from a previous question, you can compare the years:
Part-time 2009/10 Part-time 2010/11
19 years old 50 68
20 years old 35 31
21 years old 30 31
22-49 years old 405 455
50 years old and over 35 37
STEP 2 You can see there was a rise in applicants for all ages except for 20 yr. olds.
TIP Try to keep your workings neat and tidy so you can refer to them in other questions if
need be.
Copyright AssessmentDay. Unauthorised copying Page 17 AssessmentDay
or distribution in printed, electronic, or any other
form in whole or in part, is prohibited without
Document last updated 26-03-2013
www.assessmentday.co.uk
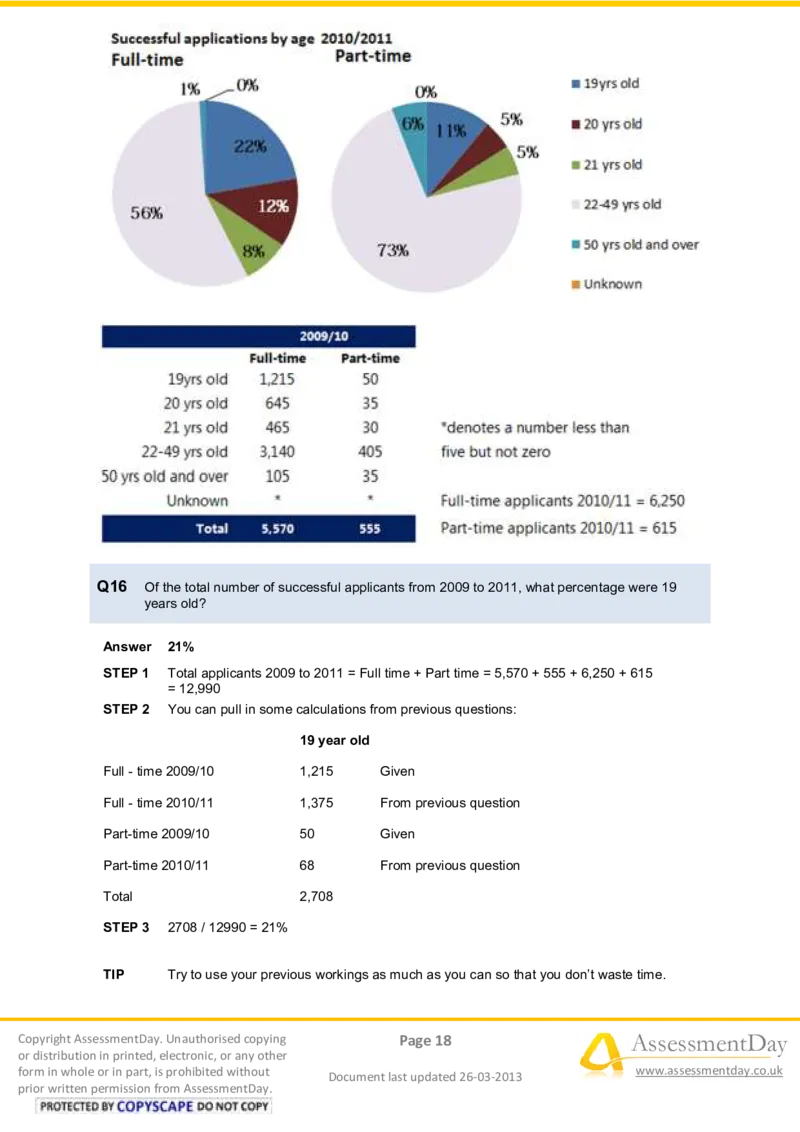
prior written permission from AssessmentDay.Q16 Of the total number of successful applicants from 2009 to 2011, what percentage were 19
years old?
Answer 21%
STEP 1 Total applicants 2009 to 2011 = Full time + Part time = 5,570 + 555 + 6,250 + 615
= 12,990
STEP 2 You can pull in some calculations from previous questions:
19 year old
Full - time 2009/10 1,215 Given
Full - time 2010/11 1,375 From previous question
Part-time 2009/10 50 Given
Part-time 2010/11 68 From previous question
Total 2,708
STEP 3 2708 / 12990 = 21%
TIP Try to use your previous workings as much as you can so that you don’t waste time.
Copyright AssessmentDay. Unauthorised copying Page 18 AssessmentDay
or distribution in printed, electronic, or any other
form in whole or in part, is prohibited without
Document last updated 26-03-2013
www.assessmentday.co.uk
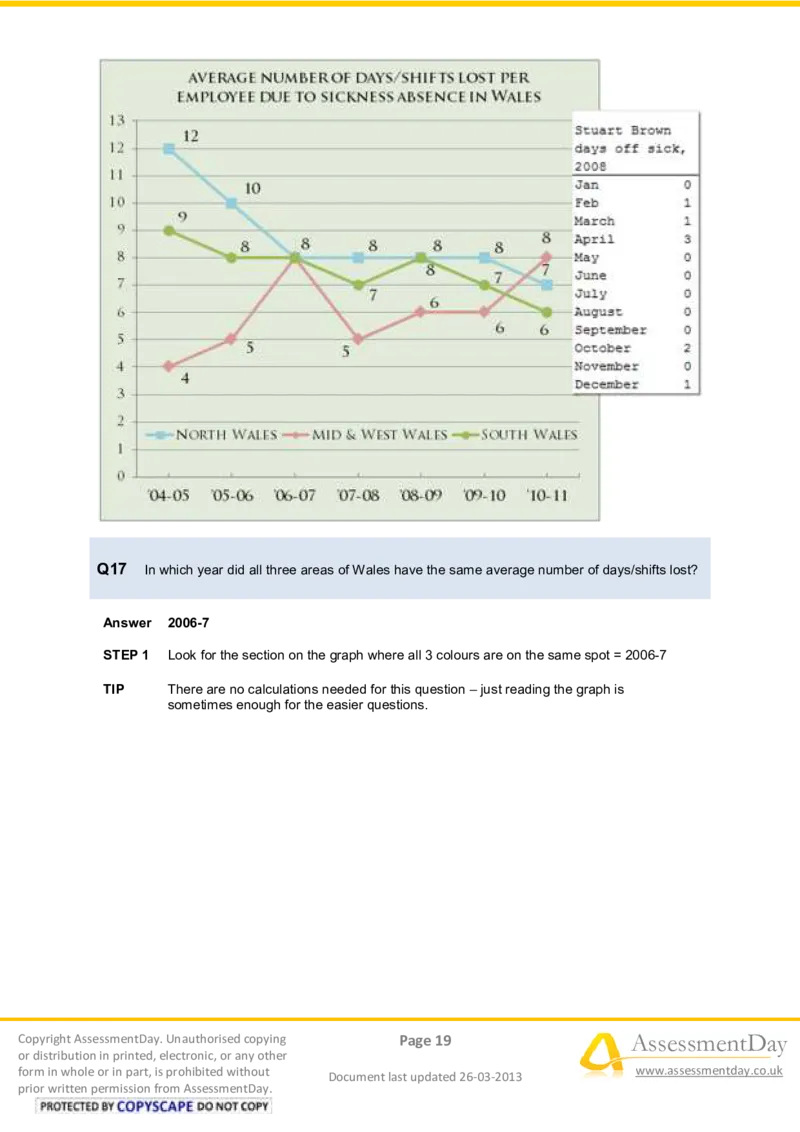
prior written permission from AssessmentDay.Q17 In which year did all three areas of Wales have the same average number of days/shifts lost?
Answer 2006-7
STEP 1 Look for the section on the graph where all 3 colours are on the same spot = 2006-7
TIP There are no calculations needed for this question – just reading the graph is
sometimes enough for the easier questions.
Copyright AssessmentDay. Unauthorised copying Page 19 AssessmentDay
or distribution in printed, electronic, or any other
form in whole or in part, is prohibited without
Document last updated 26-03-2013
www.assessmentday.co.uk
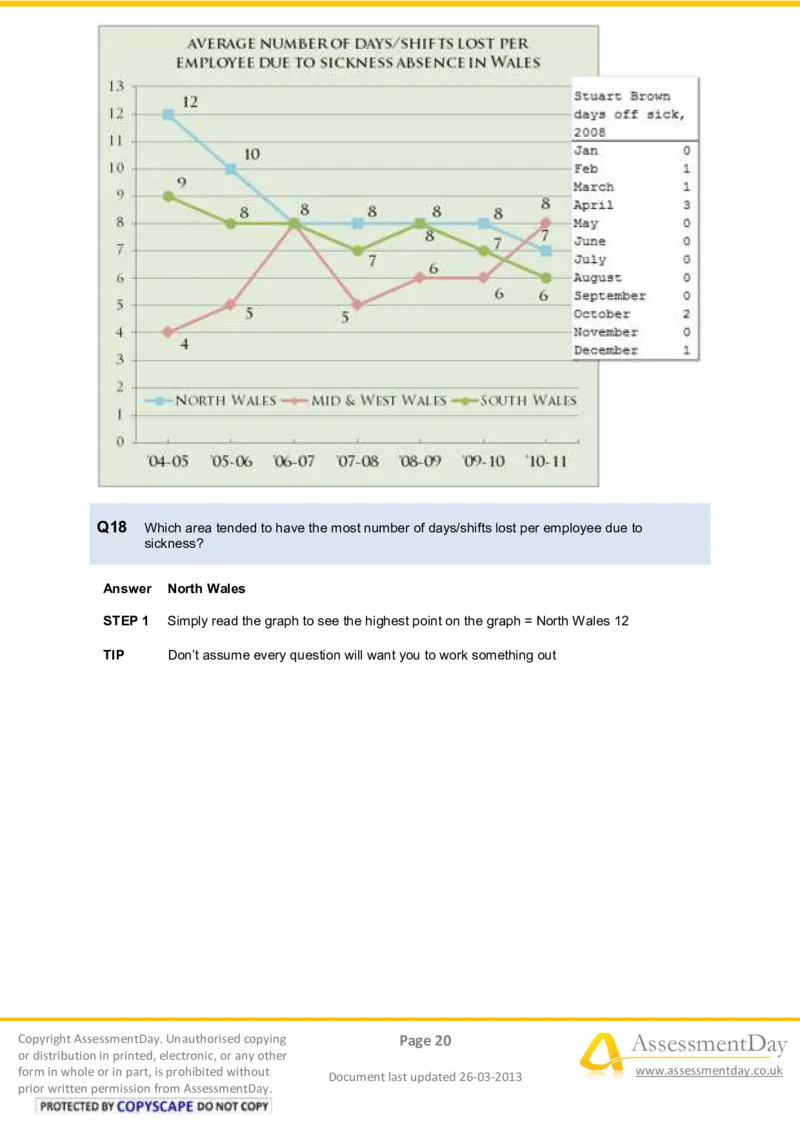
prior written permission from AssessmentDay.Q18 Which area tended to have the most number of days/shifts lost per employee due to
sickness?
Answer North Wales
STEP 1 Simply read the graph to see the highest point on the graph = North Wales 12
TIP Don’t assume every question will want you to work something out
Copyright AssessmentDay. Unauthorised copying Page 20 AssessmentDay
or distribution in printed, electronic, or any other
form in whole or in part, is prohibited without
Document last updated 26-03-2013
www.assessmentday.co.uk
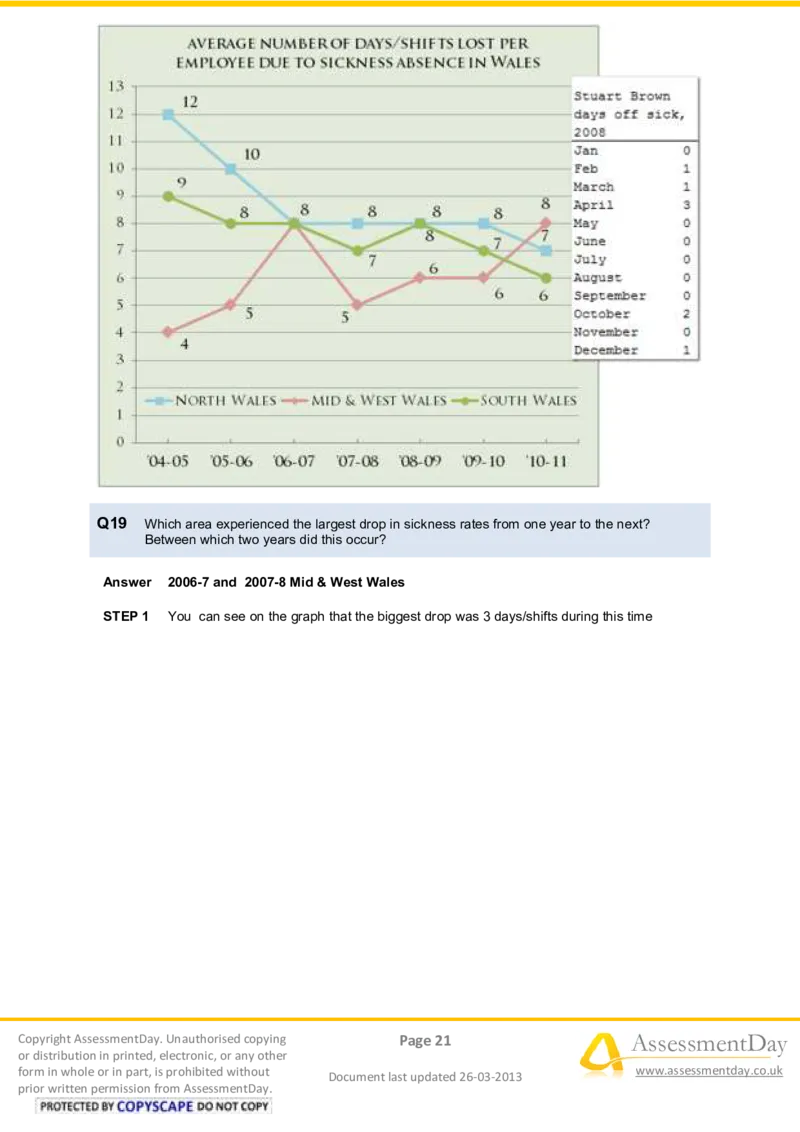
prior written permission from AssessmentDay.Q19 Which area experienced the largest drop in sickness rates from one year to the next?
Between which two years did this occur?
Answer 2006-7 and 2007-8 Mid & West Wales
STEP 1 You can see on the graph that the biggest drop was 3 days/shifts during this time
Copyright AssessmentDay. Unauthorised copying Page 21 AssessmentDay
or distribution in printed, electronic, or any other
form in whole or in part, is prohibited without
Document last updated 26-03-2013
www.assessmentday.co.uk
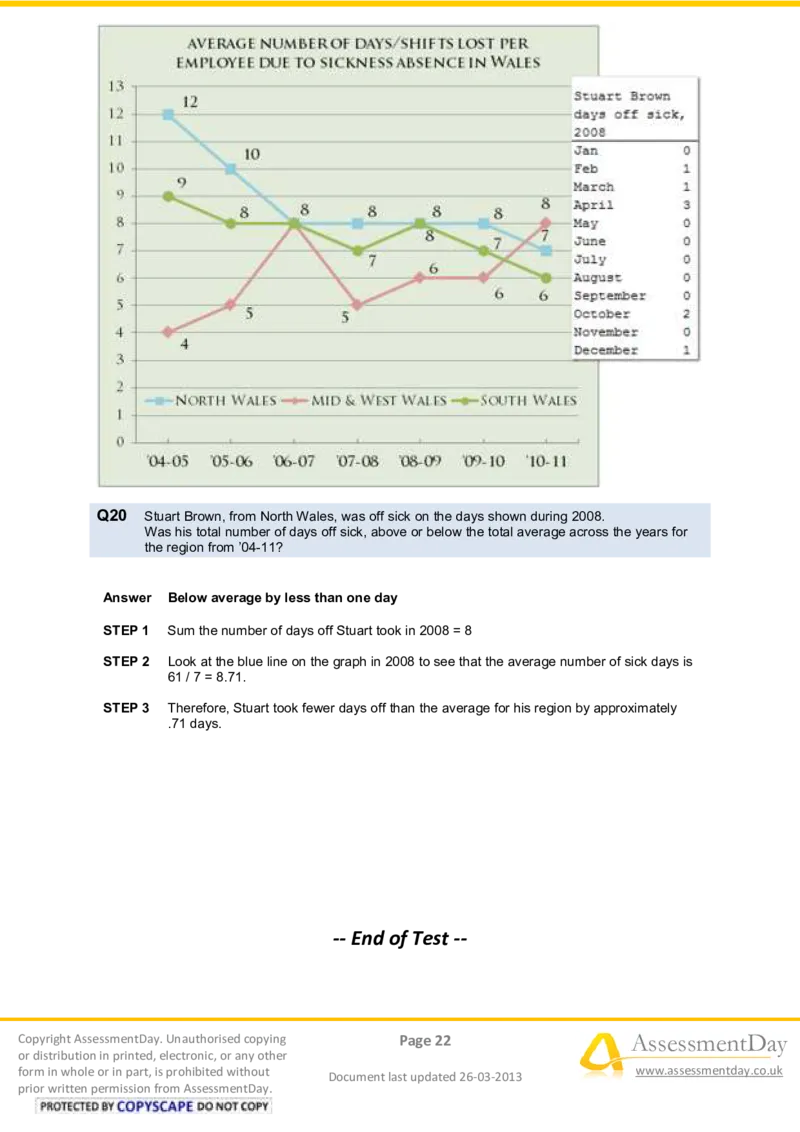
prior written permission from AssessmentDay.Q20 Stuart Brown, from North Wales, was off sick on the days shown during 2008.
Was his total number of days off sick, above or below the total average across the years for
the region from ’04-11?
Answer Below average by less than one day
STEP 1 Sum the number of days off Stuart took in 2008 = 8
STEP 2 Look at the blue line on the graph in 2008 to see that the average number of sick days is
61 / 7 = 8.71.
STEP 3 Therefore, Stuart took fewer days off than the average for his region by approximately
.71 days.
-- End of Test --
Copyright AssessmentDay. Unauthorised copying Page 22 AssessmentDay
or distribution in printed, electronic, or any other
form in whole or in part, is prohibited without
Document last updated 26-03-2013
www.assessmentday.co.uk
prior written permission from AssessmentDay.

