文档内容
关注B站AI归来和公众号考研人的解忧杂货店获取更多考研资料
历年图画作文描述
前言:图画作文、图表作文的第一段是至关重要的。由于该部分内容和题目强相
关,因此自己写的部分占比较高,这也导致改卷老师会更加关注。本资料用于帮
助大家理解和灵活运用大作文模板中出现的公式。建议大家先自己练习,然后对
照本资料学习,或当作答案参考使用。
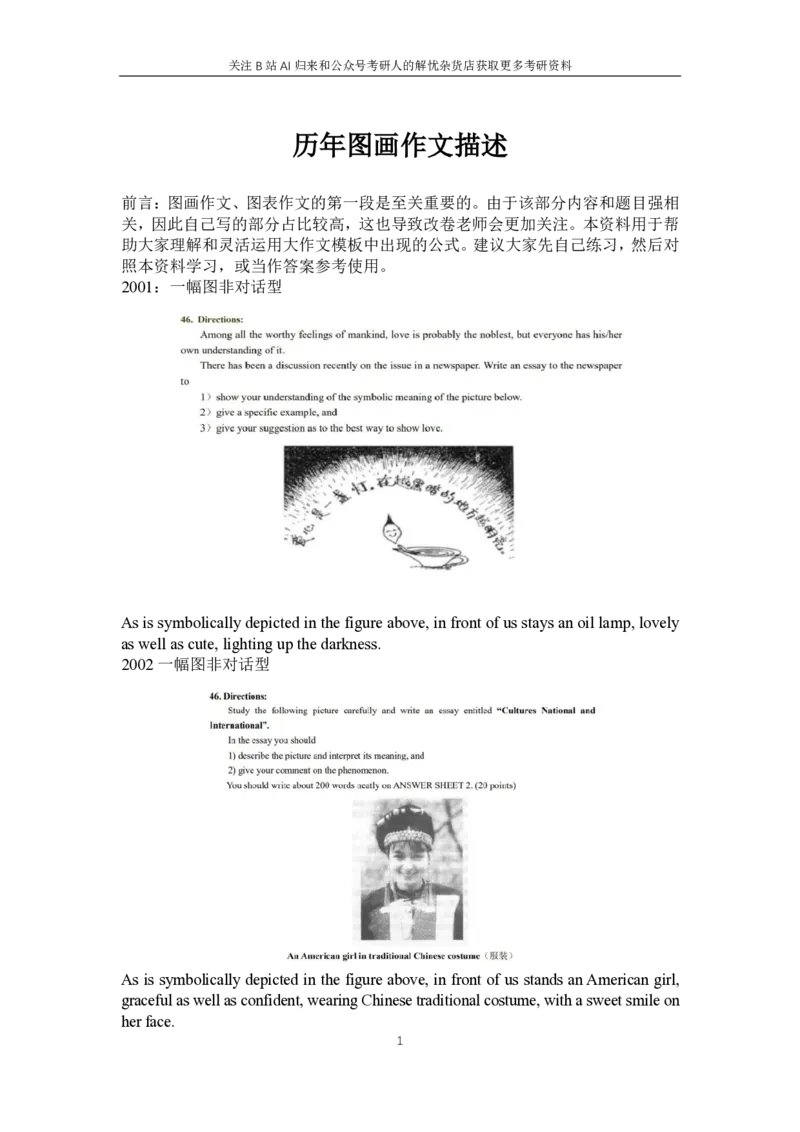
2001:一幅图非对话型
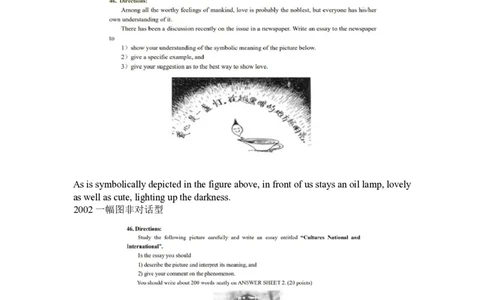
As is symbolically depicted in the figure above, in front of us stays an oil lamp, lovely
as well as cute, lighting up the darkness.
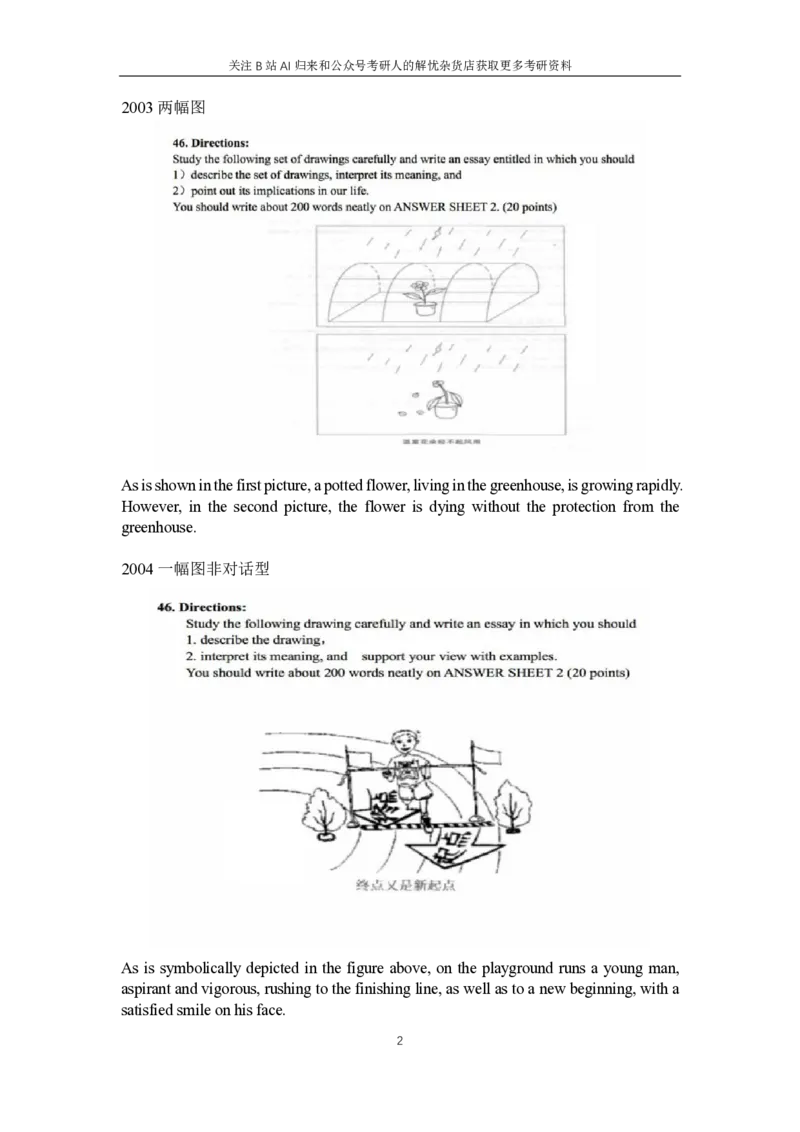
2002一幅图非对话型
As is symbolically depicted in the figure above, in front of us stands an American girl,
graceful as well as confident, wearing Chinese traditional costume, with a sweet smile on
her face.
1关注B站AI归来和公众号考研人的解忧杂货店获取更多考研资料
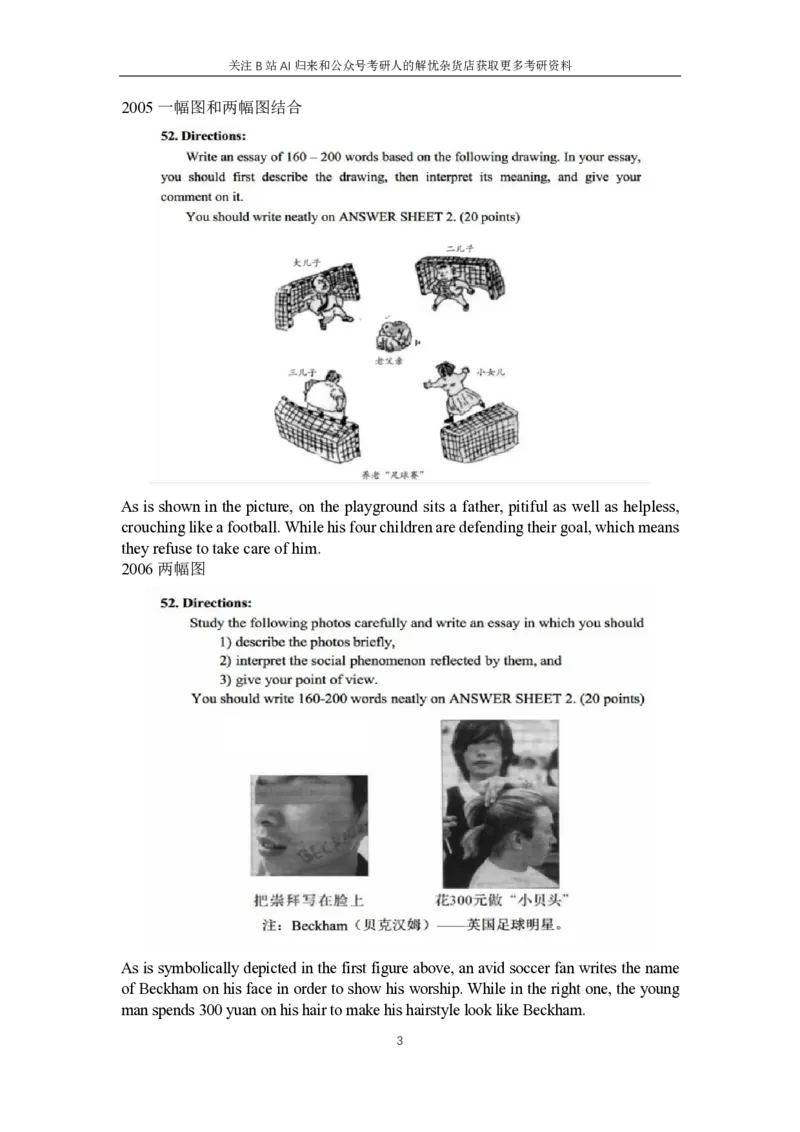
2003两幅图
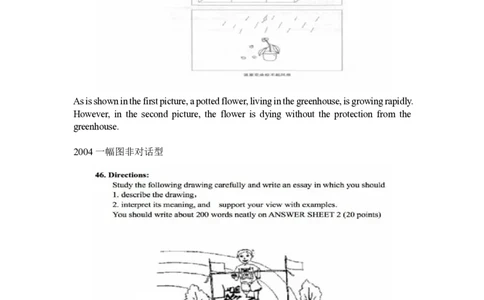
As is shown in the first picture, a potted flower, living in the greenhouse, is growing rapidly.
However, in the second picture, the flower is dying without the protection from the
greenhouse.
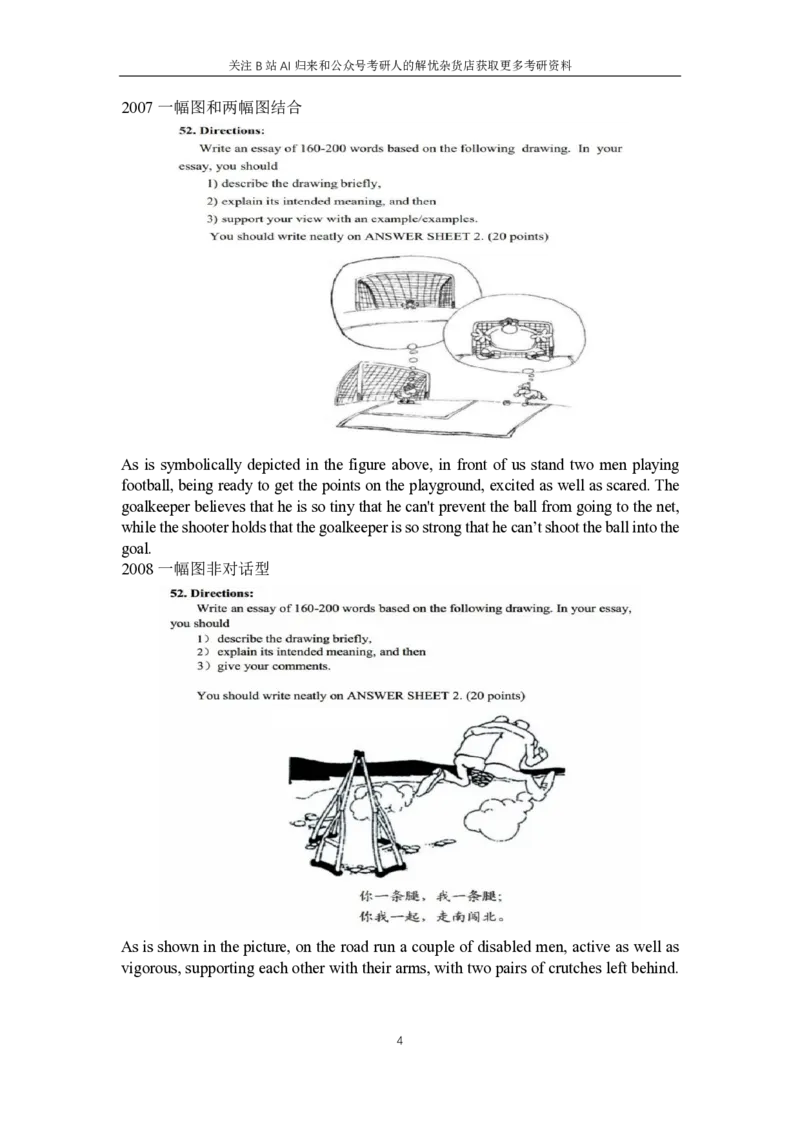
2004一幅图非对话型
As is symbolically depicted in the figure above, on the playground runs a young man,
aspirant and vigorous, rushing to the finishing line, as well as to a new beginning, with a
satisfied smile on his face.
2关注B站AI归来和公众号考研人的解忧杂货店获取更多考研资料
2005一幅图和两幅图结合
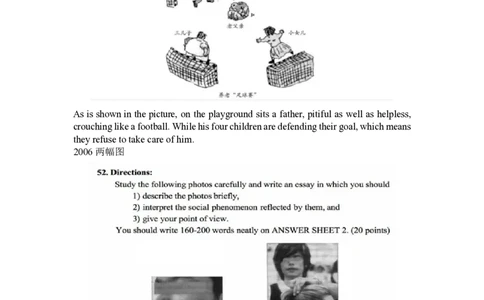
As is shown in the picture, on the playground sits a father, pitiful as well as helpless,
crouching like a football. While his four children are defending their goal, which means
they refuse to take care of him.
2006两幅图
As is symbolically depicted in the first figure above, an avid soccer fan writes the name
of Beckham on his face in order to show his worship. While in the right one, the young
man spends 300 yuan on his hair to make his hairstyle look like Beckham.
3关注B站AI归来和公众号考研人的解忧杂货店获取更多考研资料
2007一幅图和两幅图结合
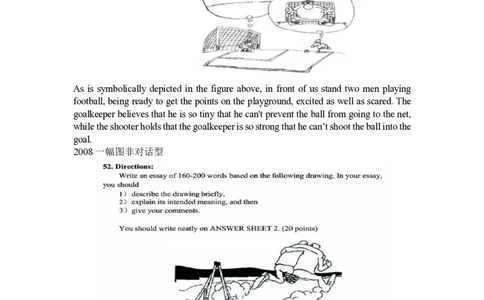
As is symbolically depicted in the figure above, in front of us stand two men playing
football, being ready to get the points on the playground, excited as well as scared. The
goalkeeper believes that he is so tiny that he can't prevent the ball from going to the net,
while the shooter holds that the goalkeeper is so strong that he can’t shoot the ball into the
goal.
2008一幅图非对话型
As is shown in the picture, on the road run a couple of disabled men, active as well as
vigorous, supporting each other with their arms, with two pairs of crutches left behind.
4关注B站AI归来和公众号考研人的解忧杂货店获取更多考研资料
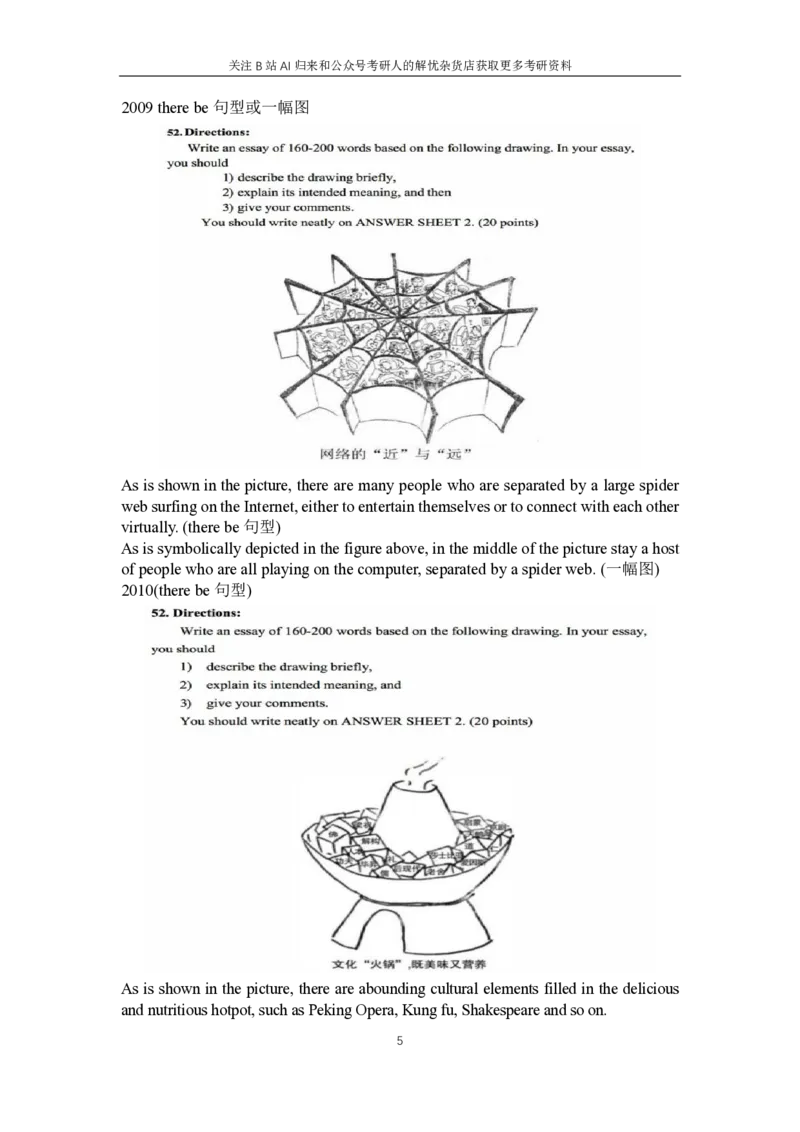
2009 there be句型或一幅图
As is shown in the picture, there are many people who are separated by a large spider
web surfing on the Internet, either to entertain themselves or to connect with each other
virtually. (there be句型)
As is symbolically depicted in the figure above, in the middle of the picture stay a host
of people who are all playing on the computer, separated by a spider web. (一幅图)
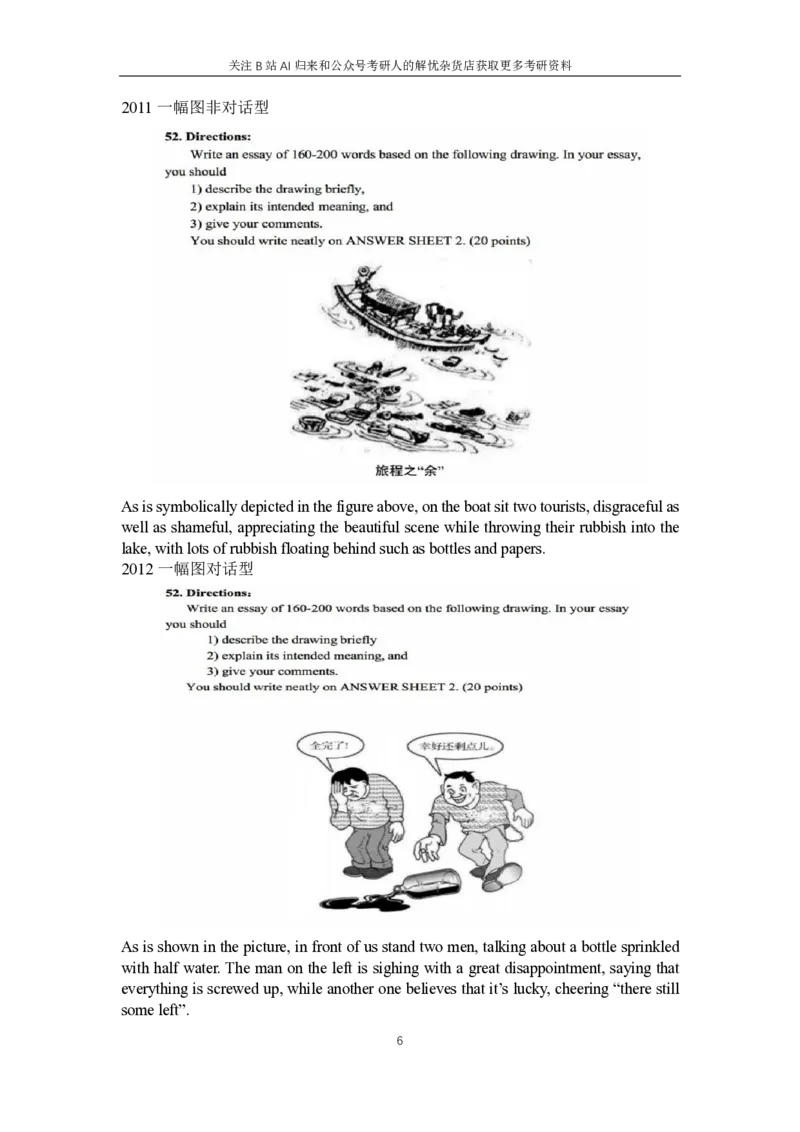
2010(there be句型)
As is shown in the picture, there are abounding cultural elements filled in the delicious
and nutritious hotpot, such as Peking Opera, Kung fu, Shakespeare and so on.
5关注B站AI归来和公众号考研人的解忧杂货店获取更多考研资料
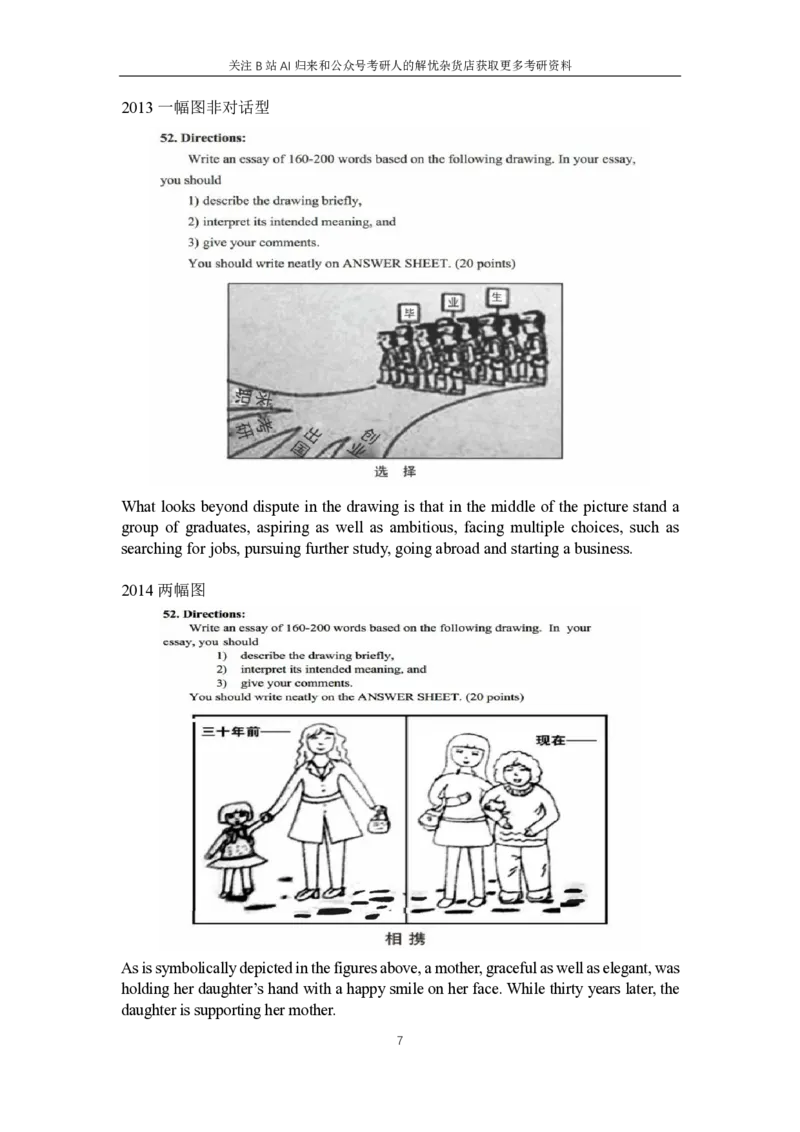
2011一幅图非对话型
As is symbolically depicted in the figure above, on the boat sit two tourists, disgraceful as
well as shameful, appreciating the beautiful scene while throwing their rubbish into the
lake, with lots of rubbish floating behind such as bottles and papers.
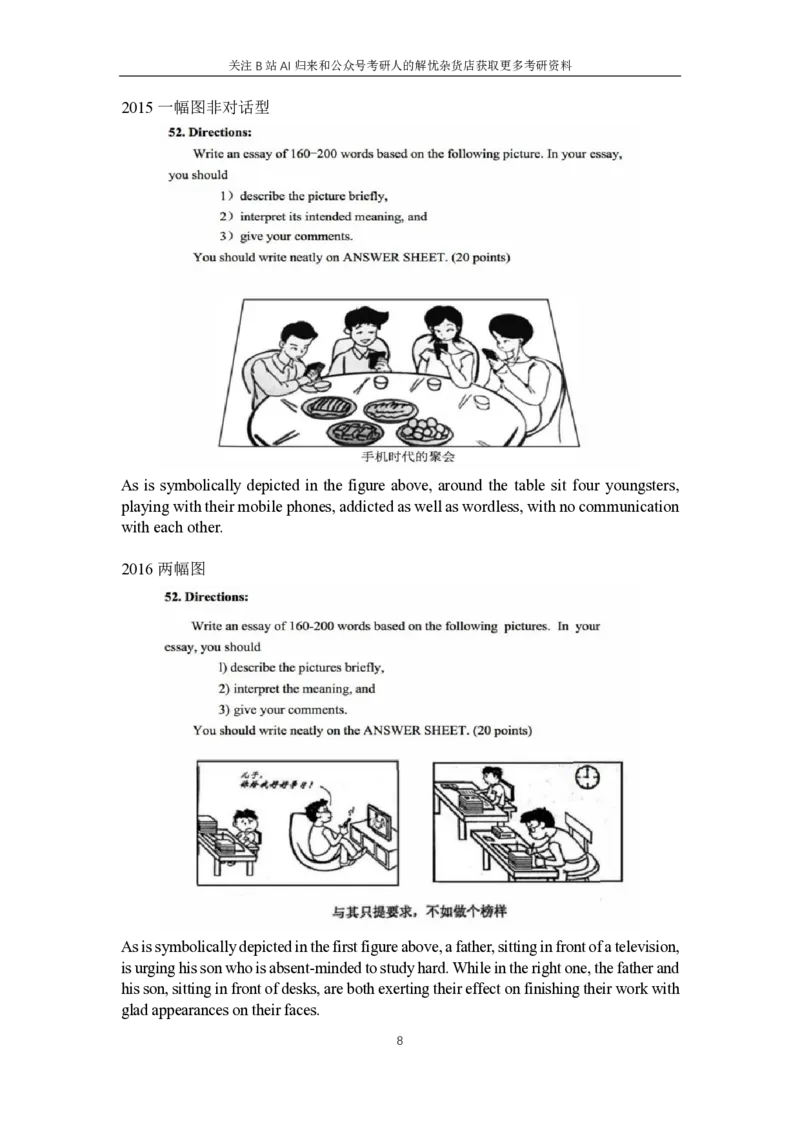
2012一幅图对话型
As is shown in the picture, in front of us stand two men, talking about a bottle sprinkled
with half water. The man on the left is sighing with a great disappointment, saying that
everything is screwed up, while another one believes that it’s lucky, cheering “there still
some left”.
6关注B站AI归来和公众号考研人的解忧杂货店获取更多考研资料
2013一幅图非对话型
What looks beyond dispute in the drawing is that in the middle of the picture stand a
group of graduates, aspiring as well as ambitious, facing multiple choices, such as
searching for jobs, pursuing further study, going abroad and starting a business.
2014两幅图
As is symbolically depicted in the figures above, a mother, graceful as well as elegant, was
holding her daughter’s hand with a happy smile on her face. While thirty years later, the
daughter is supporting her mother.
7关注B站AI归来和公众号考研人的解忧杂货店获取更多考研资料
2015一幅图非对话型
As is symbolically depicted in the figure above, around the table sit four youngsters,
playing with their mobile phones, addicted as well as wordless, with no communication
with each other.
2016两幅图
As is symbolically depicted in the first figure above, a father, sitting in front of a television,
is urging his son who is absent-minded to study hard. While in the right one, the father and
his son, sitting in front of desks, are both exerting their effect on finishing their work with
glad appearances on their faces.
8关注B站AI归来和公众号考研人的解忧杂货店获取更多考研资料
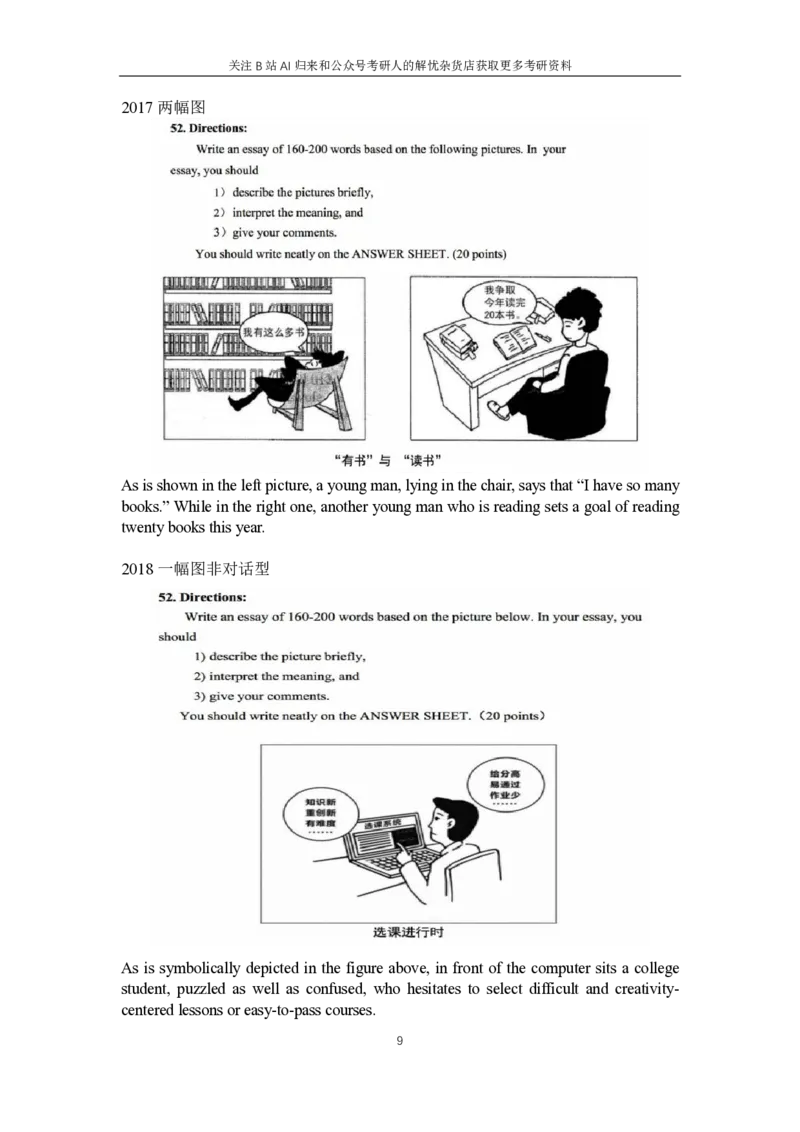
2017两幅图
As is shown in the left picture, a young man, lying in the chair, says that “I have so many
books.” While in the right one, another young man who is reading sets a goal of reading
twenty books this year.
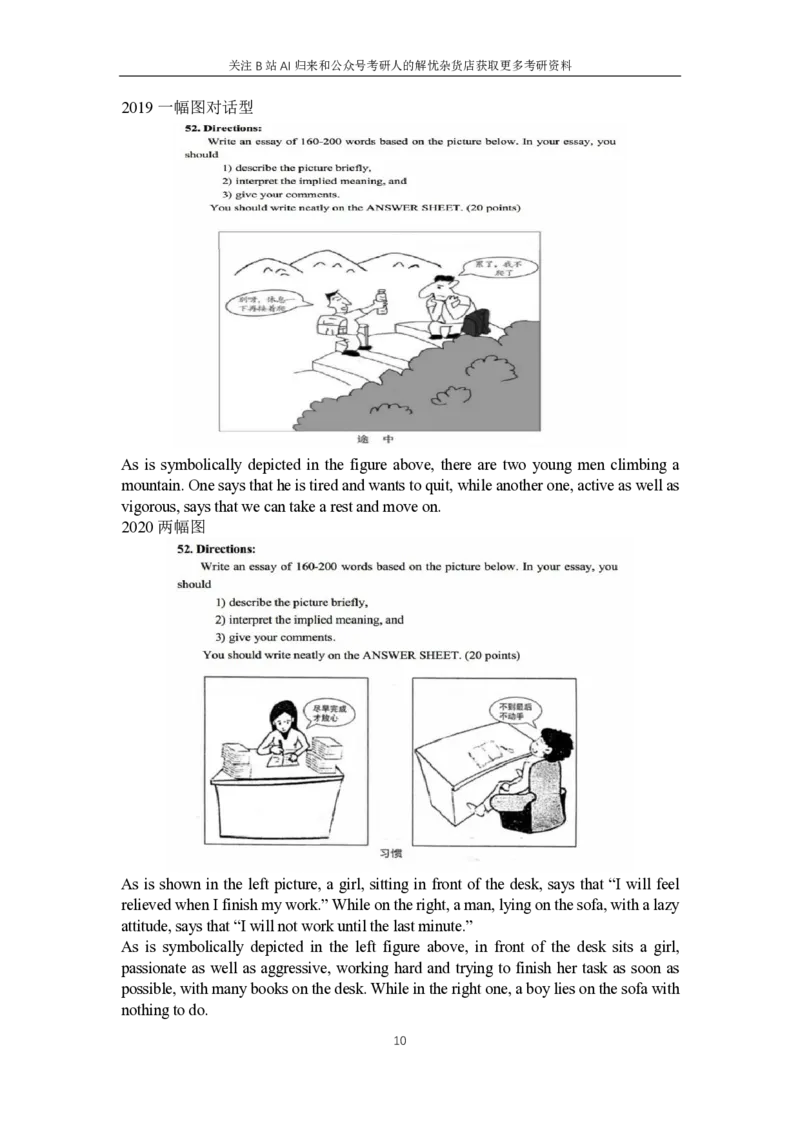
2018一幅图非对话型
As is symbolically depicted in the figure above, in front of the computer sits a college
student, puzzled as well as confused, who hesitates to select difficult and creativity-
centered lessons or easy-to-pass courses.
9关注B站AI归来和公众号考研人的解忧杂货店获取更多考研资料
2019一幅图对话型
As is symbolically depicted in the figure above, there are two young men climbing a
mountain. One says that he is tired and wants to quit, while another one, active as well as
vigorous, says that we can take a rest and move on.
2020两幅图
As is shown in the left picture, a girl, sitting in front of the desk, says that “I will feel
relieved when I finish my work.” While on the right, a man, lying on the sofa, with a lazy
attitude, says that “I will not work until the last minute.”
As is symbolically depicted in the left figure above, in front of the desk sits a girl,
passionate as well as aggressive, working hard and trying to finish her task as soon as
possible, with many books on the desk. While in the right one, a boy lies on the sofa with
nothing to do.
10关注B站AI归来和公众号考研人的解忧杂货店获取更多考研资料
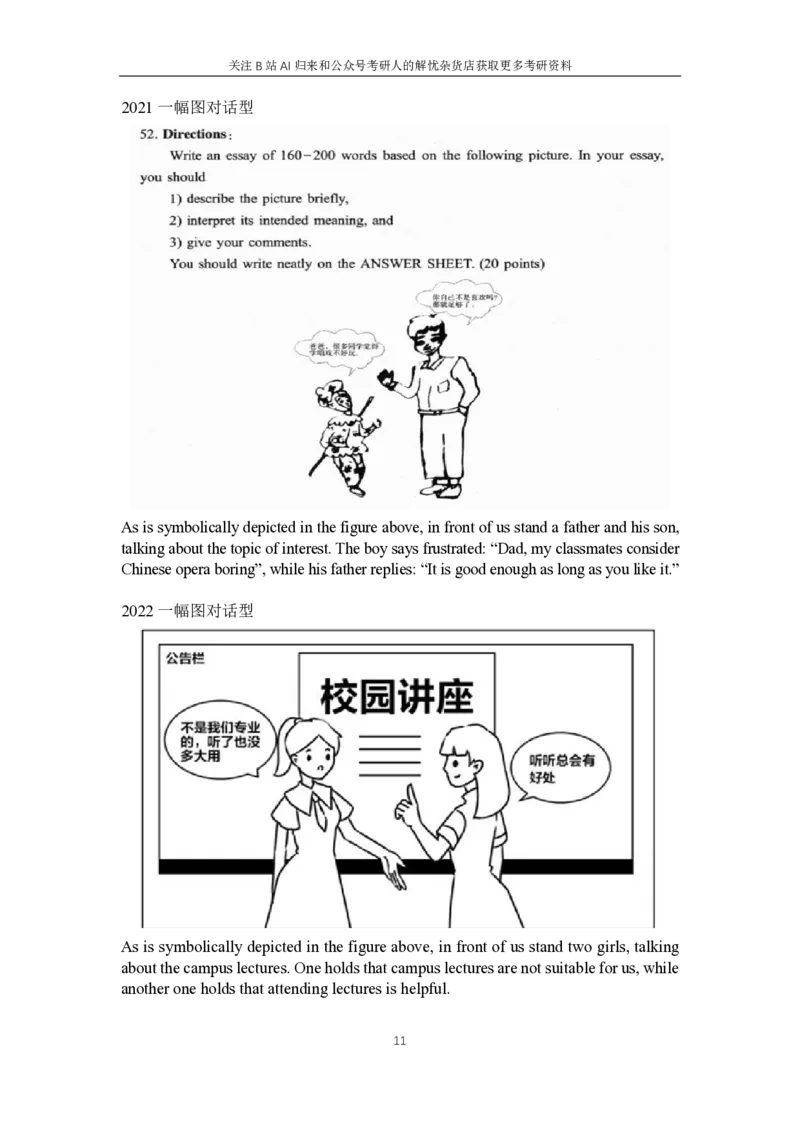
2021一幅图对话型
As is symbolically depicted in the figure above, in front of us stand a father and his son,
talking about the topic of interest. The boy says frustrated: “Dad, my classmates consider
Chinese opera boring”, while his father replies: “It is good enough as long as you like it.”
2022一幅图对话型
As is symbolically depicted in the figure above, in front of us stand two girls, talking
about the campus lectures. One holds that campus lectures are not suitable for us, while
another one holds that attending lectures is helpful.
11关注B站AI归来和公众号考研人的解忧杂货店获取更多考研资料
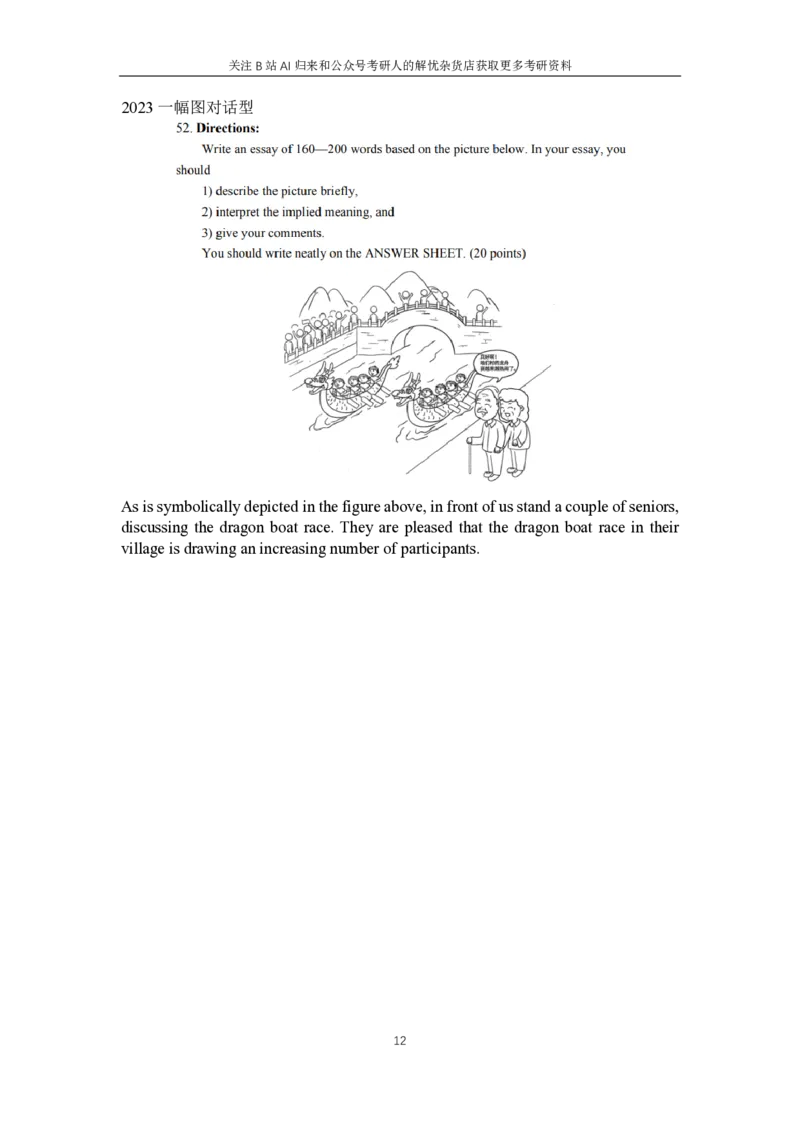
2023一幅图对话型
As is symbolically depicted in the figure above, in front of us stand a couple of seniors,
discussing the dragon boat race. They are pleased that the dragon boat race in their
village is drawing an increasing number of participants.
12关注B站AI归来和公众号考研人的解忧杂货店获取更多考研资料
历年图表作文描述
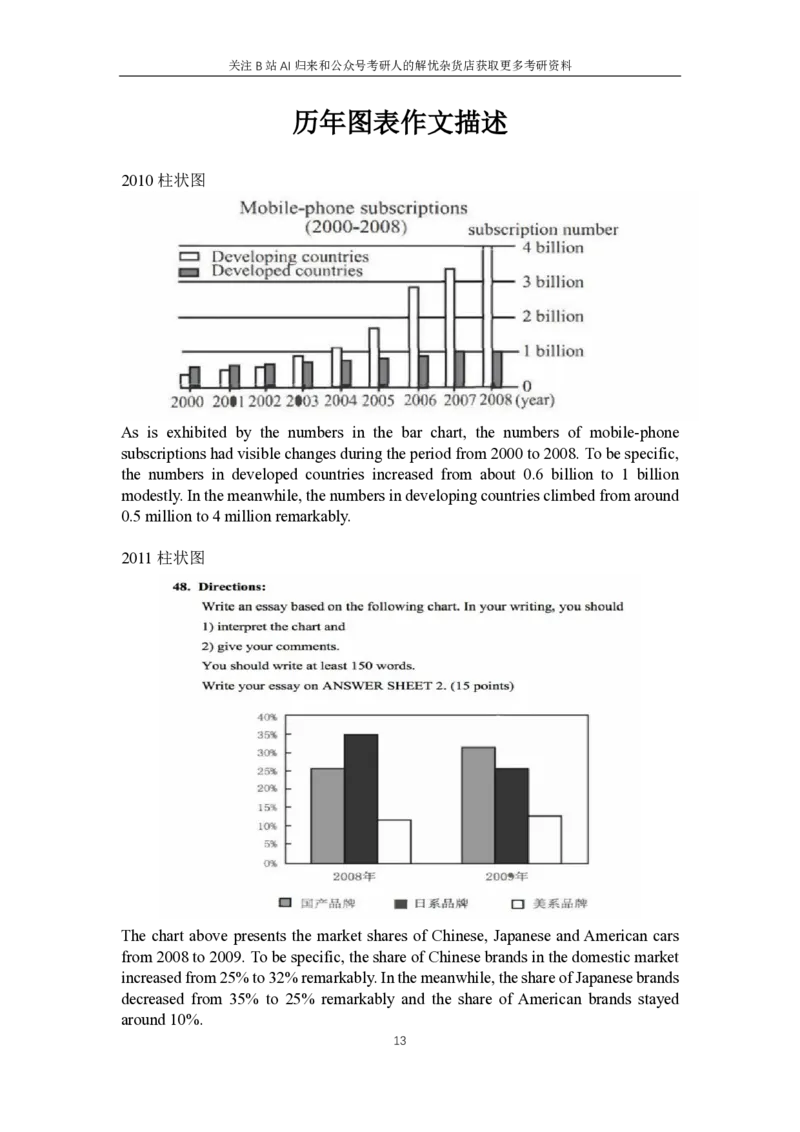
2010柱状图
As is exhibited by the numbers in the bar chart, the numbers of mobile-phone
subscriptions had visible changes during the period from 2000 to 2008. To be specific,
the numbers in developed countries increased from about 0.6 billion to 1 billion
modestly. In the meanwhile, the numbers in developing countries climbed from around
0.5 million to 4 million remarkably.
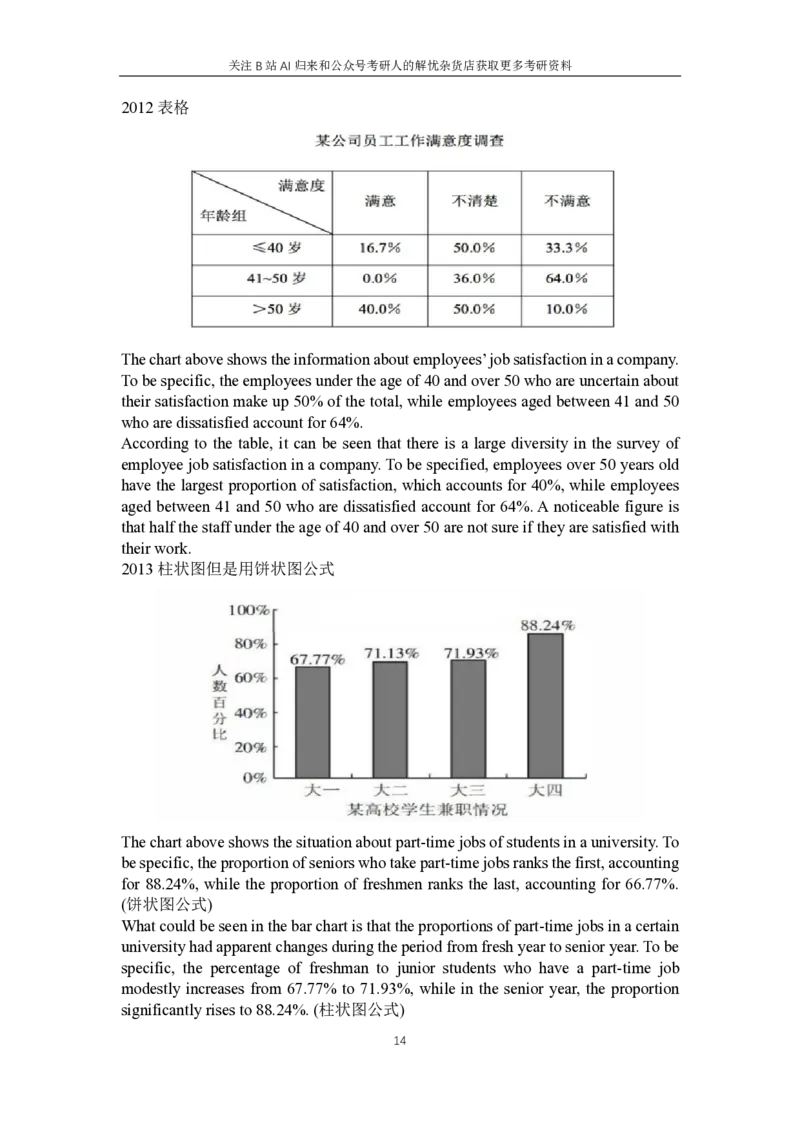
2011柱状图
The chart above presents the market shares of Chinese, Japanese and American cars
from 2008 to 2009. To be specific, the share of Chinese brands in the domestic market
increased from 25% to 32% remarkably. In the meanwhile, the share of Japanese brands
decreased from 35% to 25% remarkably and the share of American brands stayed
around 10%.
13关注B站AI归来和公众号考研人的解忧杂货店获取更多考研资料
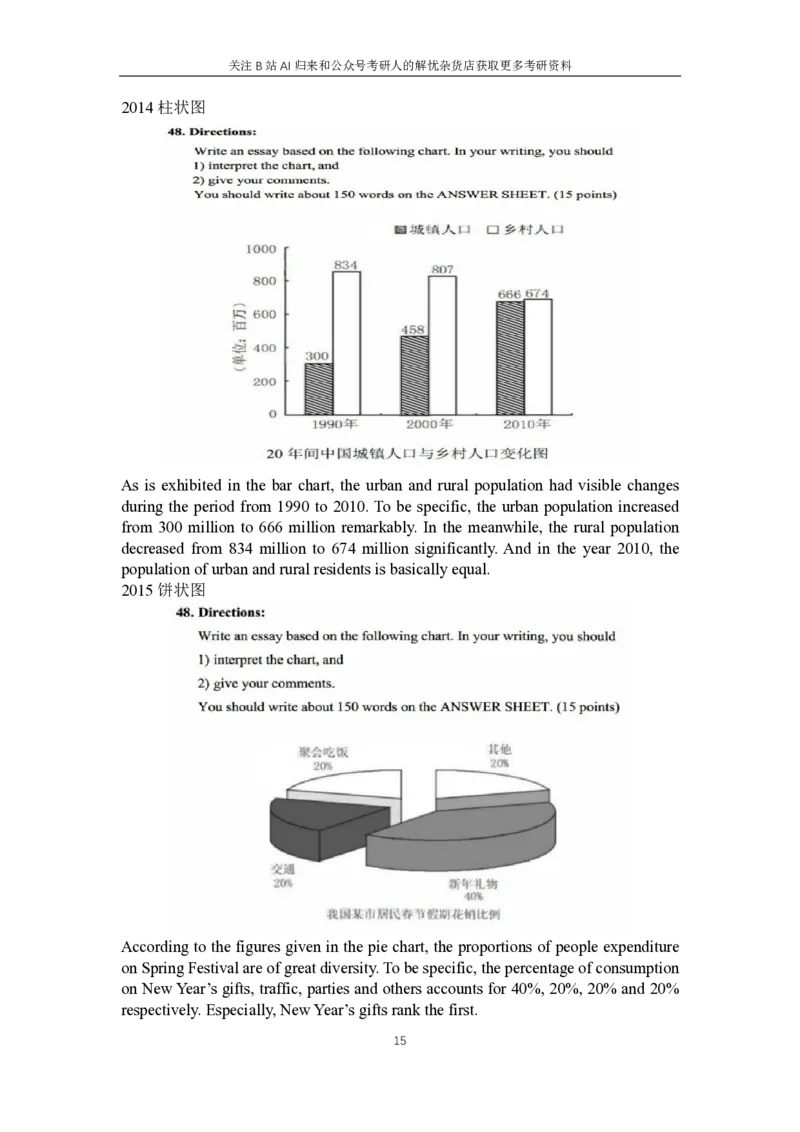
2012表格
The chart above shows the information about employees’ job satisfaction in a company.
To be specific, the employees under the age of 40 and over 50 who are uncertain about
their satisfaction make up 50% of the total, while employees aged between 41 and 50
who are dissatisfied account for 64%.
According to the table, it can be seen that there is a large diversity in the survey of
employee job satisfaction in a company. To be specified, employees over 50 years old
have the largest proportion of satisfaction, which accounts for 40%, while employees
aged between 41 and 50 who are dissatisfied account for 64%. A noticeable figure is
that half the staff under the age of 40 and over 50 are not sure if they are satisfied with
their work.
2013柱状图但是用饼状图公式
The chart above shows the situation about part-time jobs of students in a university. To
be specific, the proportion of seniors who take part-time jobs ranks the first, accounting
for 88.24%, while the proportion of freshmen ranks the last, accounting for 66.77%.
(饼状图公式)
What could be seen in the bar chart is that the proportions of part-time jobs in a certain
university had apparent changes during the period from fresh year to senior year. To be
specific, the percentage of freshman to junior students who have a part-time job
modestly increases from 67.77% to 71.93%, while in the senior year, the proportion
significantly rises to 88.24%. (柱状图公式)
14关注B站AI归来和公众号考研人的解忧杂货店获取更多考研资料
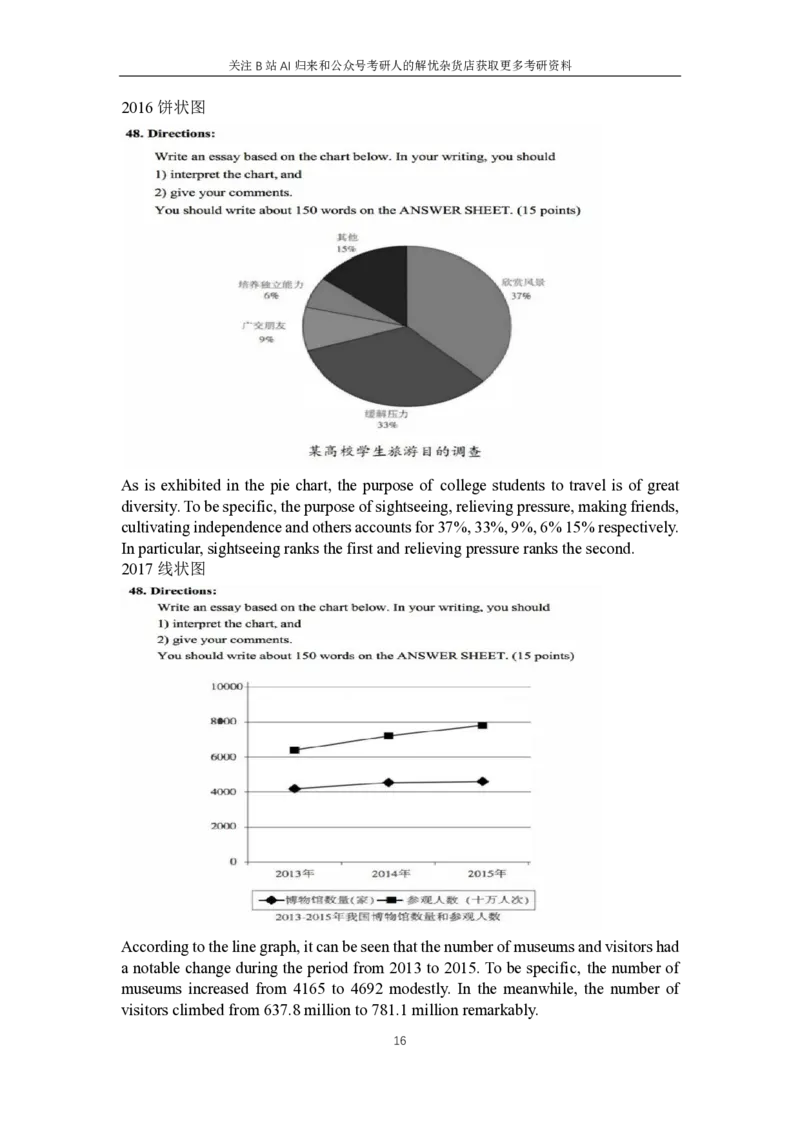
2014柱状图
As is exhibited in the bar chart, the urban and rural population had visible changes
during the period from 1990 to 2010. To be specific, the urban population increased
from 300 million to 666 million remarkably. In the meanwhile, the rural population
decreased from 834 million to 674 million significantly. And in the year 2010, the
population of urban and rural residents is basically equal.
2015饼状图
According to the figures given in the pie chart, the proportions of people expenditure
on Spring Festival are of great diversity. To be specific, the percentage of consumption
on New Year’s gifts, traffic, parties and others accounts for 40%, 20%, 20% and 20%
respectively. Especially, New Year’s gifts rank the first.
15关注B站AI归来和公众号考研人的解忧杂货店获取更多考研资料
2016饼状图
As is exhibited in the pie chart, the purpose of college students to travel is of great
diversity. To be specific, the purpose of sightseeing, relieving pressure, making friends,
cultivating independence and others accounts for 37%, 33%, 9%, 6% 15% respectively.
In particular, sightseeing ranks the first and relieving pressure ranks the second.
2017线状图
According to the line graph, it can be seen that the number of museums and visitors had
a notable change during the period from 2013 to 2015. To be specific, the number of
museums increased from 4165 to 4692 modestly. In the meanwhile, the number of
visitors climbed from 637.8 million to 781.1 million remarkably.
16关注B站AI归来和公众号考研人的解忧杂货店获取更多考研资料
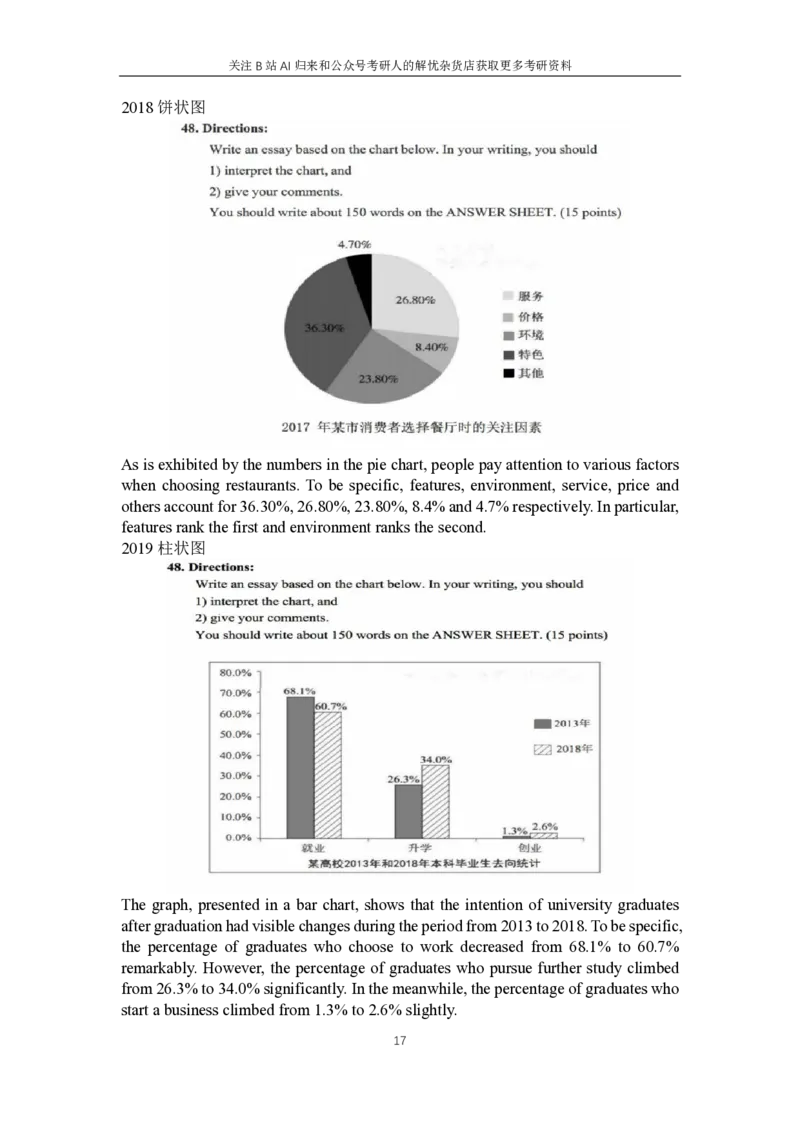
2018饼状图
As is exhibited by the numbers in the pie chart, people pay attention to various factors
when choosing restaurants. To be specific, features, environment, service, price and
others account for 36.30%, 26.80%, 23.80%, 8.4% and 4.7% respectively. In particular,
features rank the first and environment ranks the second.
2019柱状图
The graph, presented in a bar chart, shows that the intention of university graduates
after graduation had visible changes during the period from 2013 to 2018. To be specific,
the percentage of graduates who choose to work decreased from 68.1% to 60.7%
remarkably. However, the percentage of graduates who pursue further study climbed
from 26.3% to 34.0% significantly. In the meanwhile, the percentage of graduates who
start a business climbed from 1.3% to 2.6% slightly.
17关注B站AI归来和公众号考研人的解忧杂货店获取更多考研资料
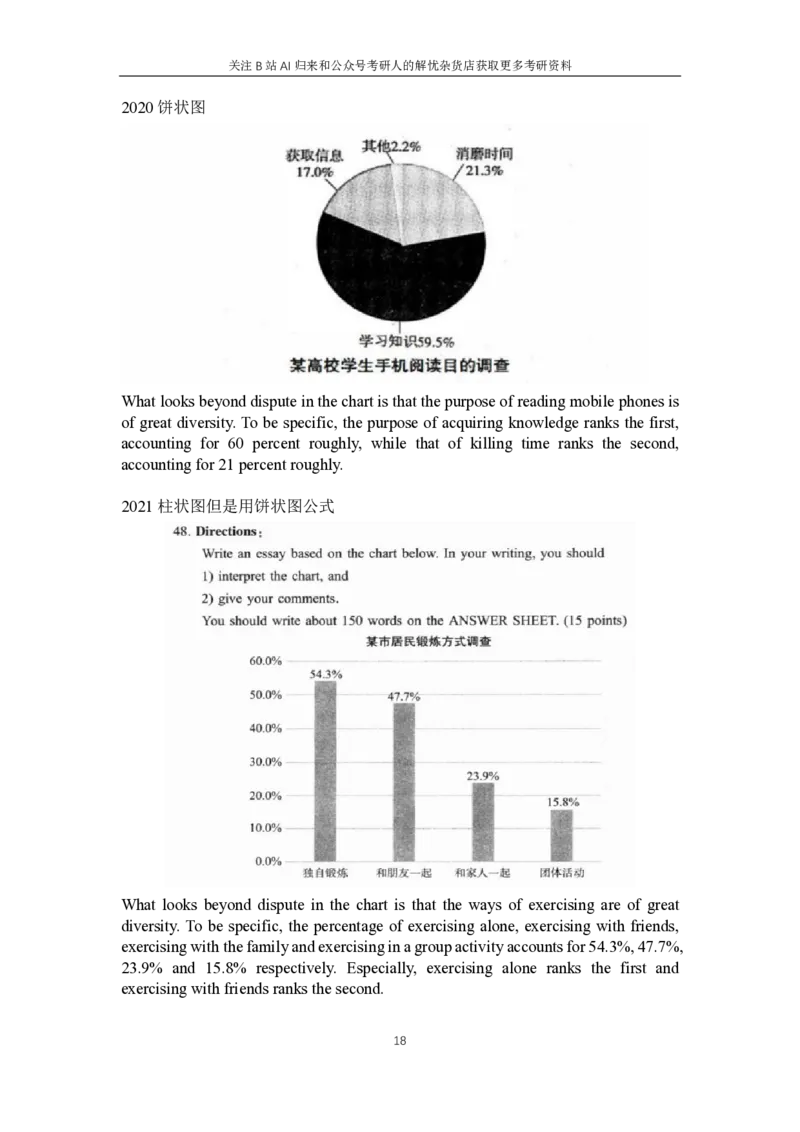
2020饼状图
What looks beyond dispute in the chart is that the purpose of reading mobile phones is
of great diversity. To be specific, the purpose of acquiring knowledge ranks the first,
accounting for 60 percent roughly, while that of killing time ranks the second,
accounting for 21 percent roughly.
2021柱状图但是用饼状图公式
What looks beyond dispute in the chart is that the ways of exercising are of great
diversity. To be specific, the percentage of exercising alone, exercising with friends,
exercising with the family and exercising in a group activity accounts for 54.3%, 47.7%,
23.9% and 15.8% respectively. Especially, exercising alone ranks the first and
exercising with friends ranks the second.
18关注B站AI归来和公众号考研人的解忧杂货店获取更多考研资料
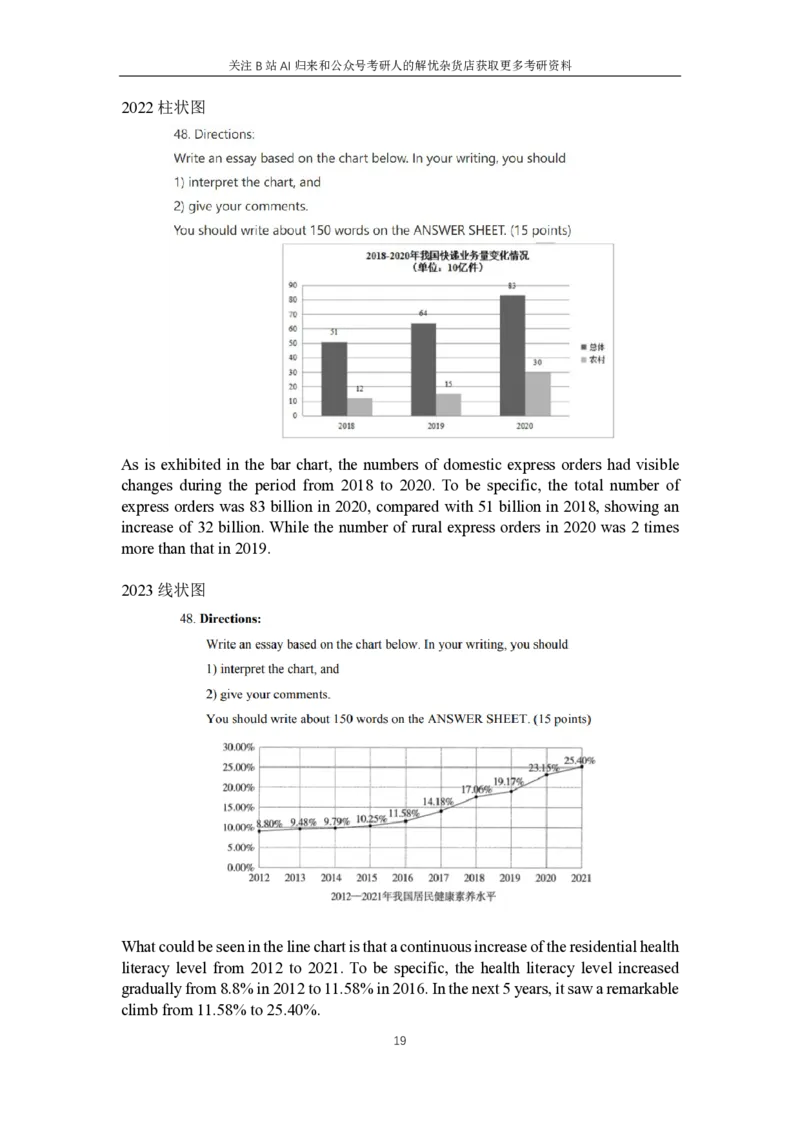
2022柱状图
As is exhibited in the bar chart, the numbers of domestic express orders had visible
changes during the period from 2018 to 2020. To be specific, the total number of
express orders was 83 billion in 2020, compared with 51 billion in 2018, showing an
increase of 32 billion. While the number of rural express orders in 2020 was 2 times
more than that in 2019.
2023线状图
What could be seen in the line chart is that a continuous increase of the residential health
literacy level from 2012 to 2021. To be specific, the health literacy level increased
gradually from 8.8% in 2012 to 11.58% in 2016. In the next 5 years, it saw a remarkable
climb from 11.58% to 25.40%.
19

