 夜雨聆风
夜雨聆风


【研究小贴士|合成DID使用说明】
【研究小贴士|SDID使用提醒】
来源:数量经济技术经济研究
在使用合成DID等进行实证分析时,请注意以下细节,确保结果准确、完整呈现:
系数结果稳定,标准误略有浮动
合成DID在不同设备上运行后,系数估计值和显著性保持一致,仅标准误存在正常范围内的轻微差异,不影响结论判断。
推荐独立运行,便于查看图表细节
为充分观察合成DID的趋势图、权重图等可视化结果,建议将关键模型(尤其是合成DID与连续DID等模型)单独执行,避免连续运行导致图表被覆盖而无法查看。
合理规划代码执行顺序,让每组结果清晰展示,助力分析更稳健!
合成DID操作及Stata应用
sdid—Stata中合成双重差分
继Arkhangelsky等人(2021年)之后,该Stata包实现了综合双重差分估计过程,以及一系列推断和绘图过程。Arkhangelsky等人提供了一个使用R的代码实现,这里附带了一些材料:synthdid。这里我们提供了一个原生的Stata实现,主要是用Mata编写的。这个包扩展了原始R包的功能,允许非常简单地在多个处理阶段交错采用的上下文中进行评估(以及在原始代码的单个采用阶段)。
1、下载命令
ssc install sdid findit sdidhelp sdid2、Stata
- https://github.com/Daniel-Pailanir/sdid/>- https://github.com/Daniel-Pailanir/sdid/blob/main/sdidExamples.do- https://github.com/Daniel-Pailanir/sdid/blob/main/sdidExamples.pdf- https://github.com/Daniel-Pailanir/sdid/blob/main/sdidExamples.do3、R codes
- https://github.com/skranz/xsynthdid4、选项含义 及语法格式
sdid depvar groupvar timevar treatment, vce(vcetype) [options] options Description ---------------------------------------------------------------------------------------------------------------------------------------------------------------------------------------------------------- vce(vcetype) vcetype may be bootstrap, jackknife, or placebo. covariates(varlist, [type]) Allows for the inclusion of covariates in the calculation of the synthetic counterfactual. Optional type can be specified, as either "optimized" (the default) or"projected", which is preferable in certain circumstances. seed(#) set random-number seed to #. reps(#) repetitions for bootstrap and placebo inference. graph if this option is specified, graphs will be displayed in the style of figure 1 from Arkhangelsky et al. (2021) g1_opt(graph options) option to modify the appearance of the unit-specific weight graph. g2_opt(graph options) option to modify the appearance of the outcome trend graphs. graph_export(string, type) option allowing for generated graphs to be saved to the disk. unstandardized In the case of "optimized" covariates, by default covariates will be standardized as z-scores, unless the unstandardized option is specified.选项含义:
-
Y:结果变量(数值)
-
S:单位变量(数字或字符串)
-
T:时间变量(数值)
-
D:处理的虚拟,如果单位被处理,则为1,否则为0(数字)
-
vce (): bootstrap, jackknife,安慰剂标准误差。
-
seed():伪随机数的种子定义。
-
reps(#):重复bootstrap和安慰剂。
-
covariates(varlist [, method]):用于调整y的协变量。应包含协变量的varlist,并可选用于调整方法的选项。在这种情况下,它可以遵循Arkhangelsky等人提出的方法进行“优化”,在这种情况下,它可以遵循Kranz, 2021 (xsynth在R中)提出的程序。在没有指定方法的情况下,默认使用“优化”。克兰兹已经证明投影法在许多情况下是可取的。在这个实现中,投影的方法通常要快得多。
-
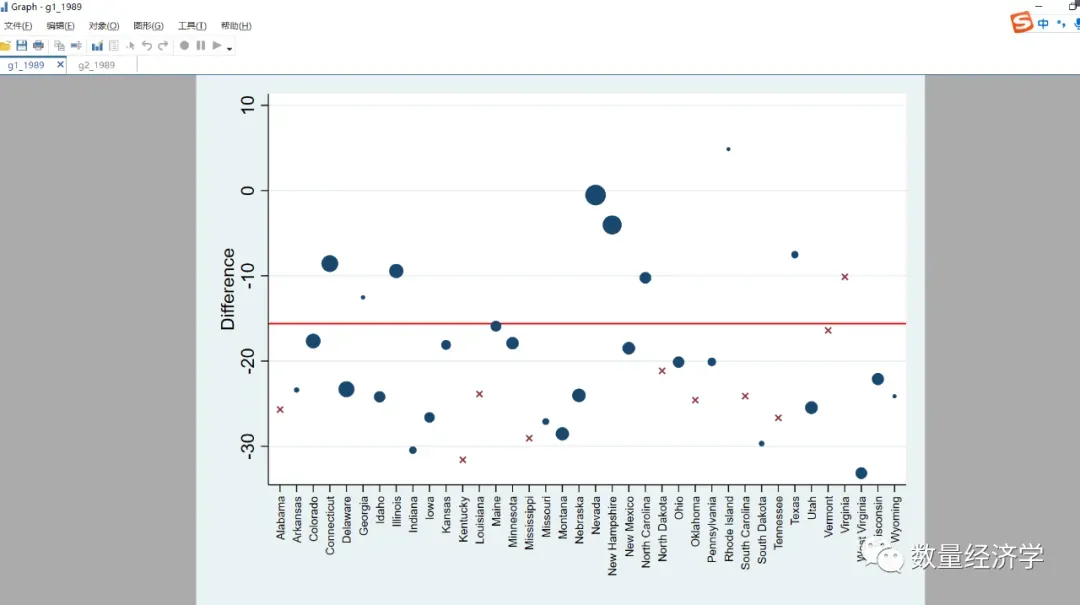
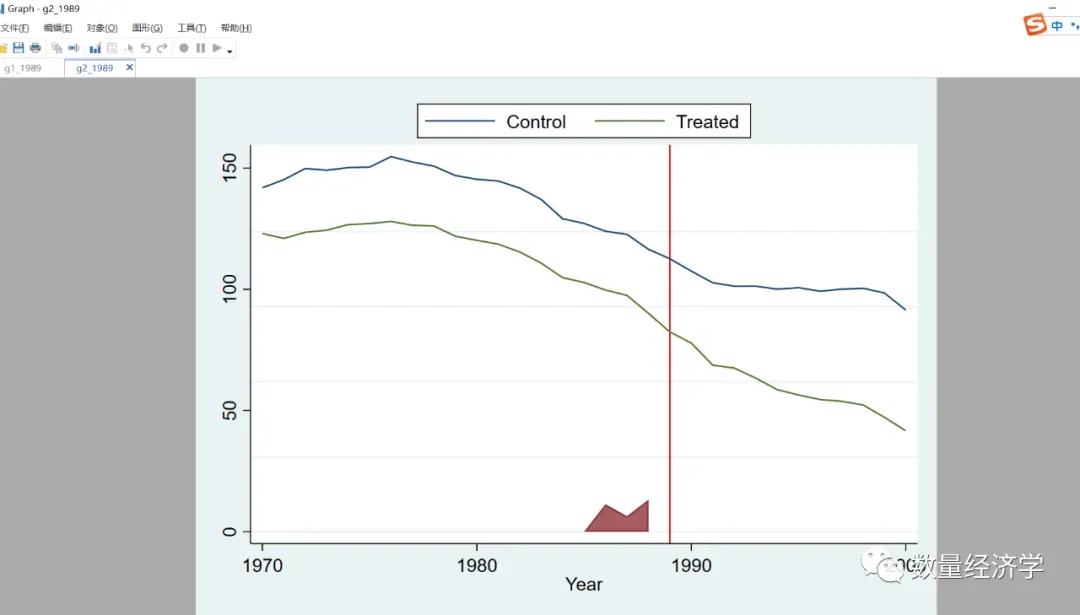
graph:如果指定了该选项,将显示单位和时间权重以及结果趋势的图形,如Arkhangelsky等人的图1。
-
g1_opt(string) g2_opt(string):选项,用于修改上述图形的外观。G1为单位权重图,g2为结果趋势图。请求的选项必须遵循Stata的twoway_options的语法。
-
unstandardized:如果包含了控制,并且指定了“优化”方法,在找到最优权重之前,控制将被标准化为z分数。这避免了控制变量具有高度离散时的优化问题。如果指定了非标准化,则只需输入控件的原始单位。应该谨慎使用这个选项。
-
graph_export([stub], type):使用这个选项可以将生成的图形保存到磁盘。每个单位权重和结果趋势将分别保存为weightsYYYY和trendsYYYY, YYYY表示每个治疗采用期。每个治疗采用阶段将生成两个图表。如果指定了该选项,则必须指定type,它指的是一个有效的Stata图形类型(例如”。Eps “, “.pdf”等等)。可选地,可以指定一个存根,在这种情况下,它将被放在导出的图形名称的前面。
5、案例应用代码合集
案例1
一个基于提案99 (Abadie et al., 2010)的例子,只有一个采用日期。加载Abadie et al.(2010)数据:
. use "C:\Users\Metrics\Desktop\prop99_example.dta"使用sdid进行估计,导出权重和趋势图:
. sdid packspercapita state year treated, vce(placebo) seed(1213) graph g1_opt(xtitle("")) g2_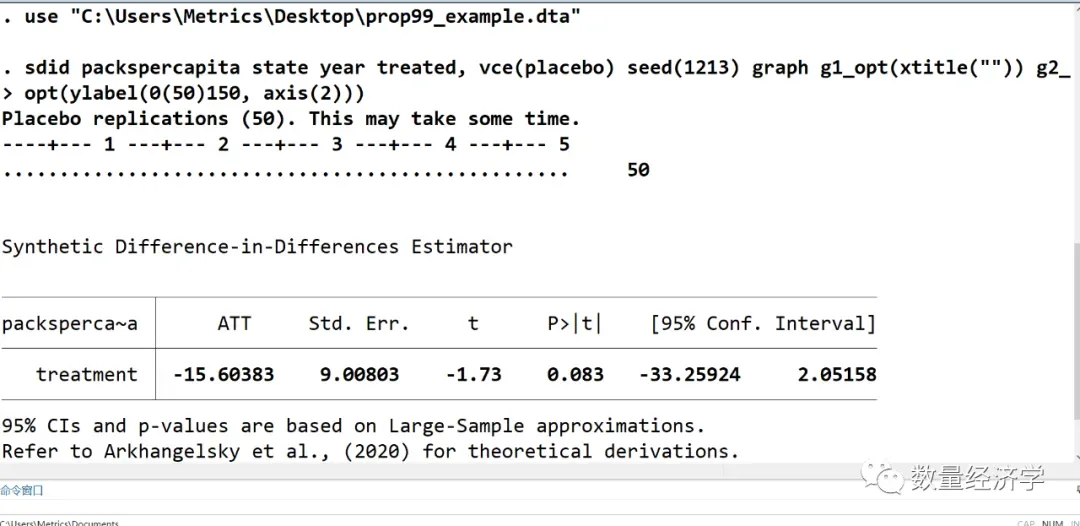
可以使用 and 输出结果:eststoesttab
*create a uniform variable to use as a controlgen r=runiform()*run sdideststo sdid_1: sdid packspercapita state year treated, vce(placebo) seed(2022)eststo sdid_2: sdid packspercapita state year treated, vce(placebo) seed(2022) covariates(r, projected)*create a tableesttab sdid_1 sdid_2, starlevel ("*" 0.10 "**" 0.05 "***" 0.01) b(%-9.3f) se(%-9.3f)结果为:
-------------------------------------------- (1) (2) packsperca~a packsperca~a --------------------------------------------treated -15.604* -15.750* (7.981) (8.039) --------------------------------------------N 1209 1209 --------------------------------------------Standard errors in parentheses* p<0.10, ** p<0.05, *** p<0.01