 夜雨聆风
夜雨聆风点击上方蓝色“3分钟云计算”关注我们,设个星标,弄清那些“你以为懂,但其实很容易踩坑”的问题

`kubectl apply` 之后,Pod 自动"找到"了一个节点。这背后发生了什么?大多数人只知道"调度器选了一个资源够用的节点"——但真实的调度过程远比这复杂得多,也精彩得多。
🧠 先来一个灵魂拷问
创建一个最简单的 Pod:
```yamlapiVersion: v1kind: Podmetadata:name: nginxspec:containers:- name: nginximage: nginx:1.25resources:requests:cpu: 500mmemory: 512Mi```
三秒后,`kubectl get pod -o wide` 显示它落到了 `node-7`。
你有没有想过:集群里 100 个节点,调度器为什么偏偏选中了 node-7? 是随机选的?是轮询?是按资源余量?
都不是。真实的过程经过了两个阶段、几十个插件、数千行代码的层层过滤和打分。读完源码之后你会发现,调度器不是一个"选节点的算法",而是一个可插拔的过滤-打分管道。
🎯 调度器的全局架构:一条链,两个阶段
源码入口在 `cmd/kube-scheduler/scheduler.go`,启动流程精简后:
```go// cmd/kube-scheduler/app/server.gofunc runCommand(cmd *cobra.Command, opts *options.Options, registryOptions ...Option) error {cc, sched, err := Setup(ctx, opts, registryOptions...)return Run(ctx, cc, sched)}```
核心逻辑在 `pkg/scheduler/scheduler.go` 的 `scheduleOne()` 方法中。每次调度一个 Pod,调用一次。但要注意——调度器不是自己主动"找 Pod"。它是通过 Informer 机制 Watch 未调度的 Pod,Pod 一出现就触发调度。
```pkg/scheduler/scheduler.go:func (sched *Scheduler) scheduleOne(ctx context.Context) {// 1. 从队列取下一个待调度的 PodpodInfo := sched.NextPod()// 2. 运行调度算法 → 选出一个节点scheduleResult, err := sched.SchedulingCycle(ctx, fwk, state, pod, ...)// 3. 异步绑定 Pod 到节点(写 Pod.spec.nodeName)go func() {sched.BindingCycle(ctx, fwk, state, ...)}()}```
👉 三个核心动作:取 Pod → 跑调度算法选节点 → 绑定。看似简单,第 2 步的 `SchedulingCycle` 是整个调度器的灵魂。
打开 `SchedulingCycle`(在 `pkg/scheduler/schedule_one.go`),你会看到两层核心调用:
```go// 阶段一:Filter — 过滤掉不合适的节点feasibleNodes, err := fwk.RunFilterPlugins(ctx, state, pod, nodeInfo)// 阶段二:Score — 给剩下的节点打分scores, err := fwk.RunScorePlugins(ctx, state, pod, feasibleNodes)// 选出最高分的节点host, err := selectHost(scores)```
这就是调度器最核心的两个阶段:
```所有节点 (100 个)│▼ Filter 阶段(跑多个插件)│ ├── NodeUnschedulable → 过滤 Tainted/Cordoned 节点│ ├── NodeResourcesFit → 过滤 CPU/内存不够的节点│ ├── NodeAffinity → 过滤不匹配亲和性规则的节点│ ├── NodePorts → 过滤端口冲突的节点│ └── ... 还会有十几个插件 ...│▼ 剩余 (20 个可行节点)│▼ Score 阶段(跑多个插件,打分)│ ├── NodeResourcesFit → 资源最平衡的节点分数高│ ├── ImageLocality → 镜像已存在的节点分数高│ ├── PodTopologySpread → 按拓扑域分散 Pod│ └── ...│▼ 总分最高的节点 → node-7```
⚔️ Filter 阶段:逐个插件的淘汰赛
Filter 不是"一个算法判断资源够不够",而是一连串的插件逐个执行。每个插件都可以说"这个节点不行",一旦被拒绝,后续插件就不跑了。
源码在 `pkg/scheduler/framework/interface.go`,FilterPlugin 接口:
```gotype FilterPlugin interface {PluginFilter(ctx context.Context, state *CycleState,pod *v1.Pod, nodeInfo *NodeInfo) *Status}```
每个插件拿到 Pod + 节点信息,返回 `Success`(通过)或 `Unschedulable`(淘汰)。
运行顺序非常重要。先跑轻量检查(Unschedulable),再跑重量检查(资源计算),避免浪费 CPU。源码中硬编码了插件执行顺序(`pkg/scheduler/framework/plugins/registry.go` 的 `defaultPluginOrder`)。
我们挑几个最关键的 Filter 插件看源码。
1️⃣ NodeUnschedulable — 第一道过滤器
```go// pkg/scheduler/framework/plugins/nodeunschedulable/func (pl *NodeUnschedulable) Filter(ctx context.Context, _ *framework.CycleState,pod *v1.Pod, nodeInfo *framework.NodeInfo) *framework.Status {if nodeInfo.Node() != nil && nodeInfo.Node().Spec.Unschedulable {return framework.NewStatus(framework.Unschedulable, "node is unschedulable")}return nil}```
只有三行。检查节点是否被 `kubectl cordon` 标记为不可调度。如果节点被 cordon 了,直接返回 Unschedulable。除非 Pod 有对应的 toleration。
2️⃣ NodeResourcesFit — 最核心的资源检查
```go// pkg/scheduler/framework/plugins/noderesources/fit.gofunc (f *Fit) Filter(ctx context.Context, cycleState *framework.CycleState,pod *v1.Pod, nodeInfo *framework.NodeInfo) *framework.Status {// 获取 Pod 请求的 CPU 和内存podRequest := computePodResourceRequest(pod)// 节点可分配资源 - 已用资源 - 为系统预留allocatable := nodeInfo.Allocatablerequested := nodeInfo.Requested// CPU 够不够?if allocatable.MilliCPU - requested.MilliCPU < podRequest.MilliCPU {return framework.NewStatus(framework.Unschedulable,"Insufficient cpu")}// 内存够不够?if allocatable.Memory - requested.Memory < podRequest.Memory {return framework.NewStatus(framework.Unschedulable,"Insufficient memory")}// 其他资源(GPU、HugePages 等)// ...return nil}```
注意两个关键点:
👉 用的是 `requests`,不是 `limits`。调度只看 request 量——Limit 是运行时限制,调度器不关心。这就是为什么 request 设 100m、limit 设 4 核是可行的——调度器按 100m 安排位置。
👉 用的是 `Allocatable`,不是 `Capacity`。节点总容量减去 kubelet 预留和系统预留后的部分。这是实际上能给 Pod 用的量。
3️⃣ NodeAffinity — nodeSelector 的进化版
```go// pkg/scheduler/framework/plugins/nodeaffinity/func (pl *NodeAffinity) Filter(ctx context.Context, state *framework.CycleState,pod *v1.Pod, nodeInfo *framework.NodeInfo) *framework.Status {node := nodeInfo.Node()// 检查硬性 nodeSelector(required)if pod.Spec.Affinity != nil &&pod.Spec.Affinity.NodeAffinity != nil {match, _ := pl.requiredDuringSchedulingIgnoredDuringExecution.Match(node)if !match {return framework.NewStatus(framework.Unschedulable)}}return nil}```
⚠️ 检查的是 `requiredDuringSchedulingIgnoredDuringExecution`(硬性要求)。`preferredDuringScheduling` 只在 Score 阶段参与打分——不影响 Filter。
4️⃣ PodTopologySpread — 按拓扑域分散 Pod
```go// pkg/scheduler/framework/plugins/podtopologyspread/func (pl *PodTopologySpread) Filter(ctx context.Context, state *framework.CycleState,pod *v1.Pod, nodeInfo *framework.NodeInfo) *framework.Status {for _, constraint := range pod.Spec.TopologySpreadConstraints {// topologyKey: "kubernetes.io/hostname" 或 "topology.kubernetes.io/zone"// 计算当前节点所在拓扑域中匹配的 Pod 数量// 如果超过 maxSkew → Unschedulable}return nil}```
TopologySpread 在 Filter 阶段做的是"硬性检查"——如果某个约束是 `whenUnsatisfiable: DoNotSchedule`,调度器会严格执行。
👉 这是很多人调不通 TopologySpread 的根源:他们以为是"建议",调度器当成"硬要求"。
🧩 Score 阶段:剩余节点谁更优?
Filter 之后,剩下 20 个候选节点。现在的问题是:谁最合适?
每个 Score 插件给这 20 个节点分别打分(0-100),然后汇总。
```go// pkg/scheduler/framework/interface.gotype ScorePlugin interface {PluginScore(ctx context.Context, state *CycleState,p *v1.Pod, nodeName string) (int64, *Status)}
1️⃣ NodeResourcesFit — 资源视角的"最优"节点
这是最核心的 Score 插件。它不看"节点还剩多少资源",而看"资源碎片化程度"。
```go// pkg/scheduler/framework/plugins/noderesources/scorer.gofunc leastAllocatedScore(requested, allocable []int64) int64 {// 计算公式:分数 = (allocable - requested) / allocable * 100// 节点越空,分数越高 → BinPacking 的逆操作(Spread 策略)}func mostAllocatedScore(requested, allocable []int64) int64 {// 计算公式:分数 = requested / allocable * 100// 节点越满,分数越高 → BinPacking 策略}```
两种策略,在 `KubeSchedulerConfiguration` 中配置:
```yamlapiVersion: kubescheduler.config.k8s.io/v1kind: KubeSchedulerConfigurationprofiles:- pluginConfig:- name: NodeResourcesFitargs:scoringStrategy:type: LeastAllocated # 默认:分散部署# type: MostAllocated # 可选:堆叠部署,节省节点```
👉 默认是 LeastAllocated——把 Pod 分散到更多节点。如果你想让 Pod 堆叠在一起节省成本,切到 MostAllocated。
2️⃣ ImageLocality — 镜像缓存加分
```go// pkg/scheduler/framework/plugins/imagelocality/func (pl *ImageLocality) Score(ctx context.Context, state *framework.CycleState,pod *v1.Pod, nodeName string) (int64, *Status) {nodeInfo := pl.handle.SnapshotSharedLister().NodeInfos().Get(nodeName)// 检查 Pod 需要的镜像是否已在节点上// 已存在的镜像大小 / 总镜像大小 * 100// 注:这是实际算法的大幅简化版return score, nil}```
👉 如果你的节点已经拉取过 `nginx:1.25`,这个节点会额外加分。对于巨大的 ML 推理镜像,这个插件减少的冷启动时间可能超过一切其他优化。
3️⃣ PodTopologySpread — "分散"打分
```go// 对于每个 topologyKey(例如 "zone")// 已经有很多匹配 Pod 在某个 zone → 给它打低分// 匹配 Pod 很少的 zone → 打高分```
和在 Filter 阶段的硬性检查不同,Score 阶段做的是"引导"。它不阻止调度,只是让调度器更倾向于拓扑域中 Pod 较少的节点。
汇总打分(Weighted Sum):
每个 Score 插件有一个 `weight`(权重,默认 1),最终分数是加权和:
```yamlprofiles:- plugins:score:enabled:- name: NodeResourcesFitweight: 2 # 权重加倍- name: ImageLocalityweight: 1- name: PodTopologySpreadweight: 3 # 打散最重要```
💥 Schedule Framework:Kubernetes 1.15 的架构革命
Kubernetes 1.15 之前,调度器是一大坨单体的"过滤-打分"代码。扩展只能靠 Scheduler Extender(外部 HTTP 服务),性能差、延迟高。
1.15 引入了 Scheduling Framework——把调度过程的每个环节抽象为扩展点(Extension Point):
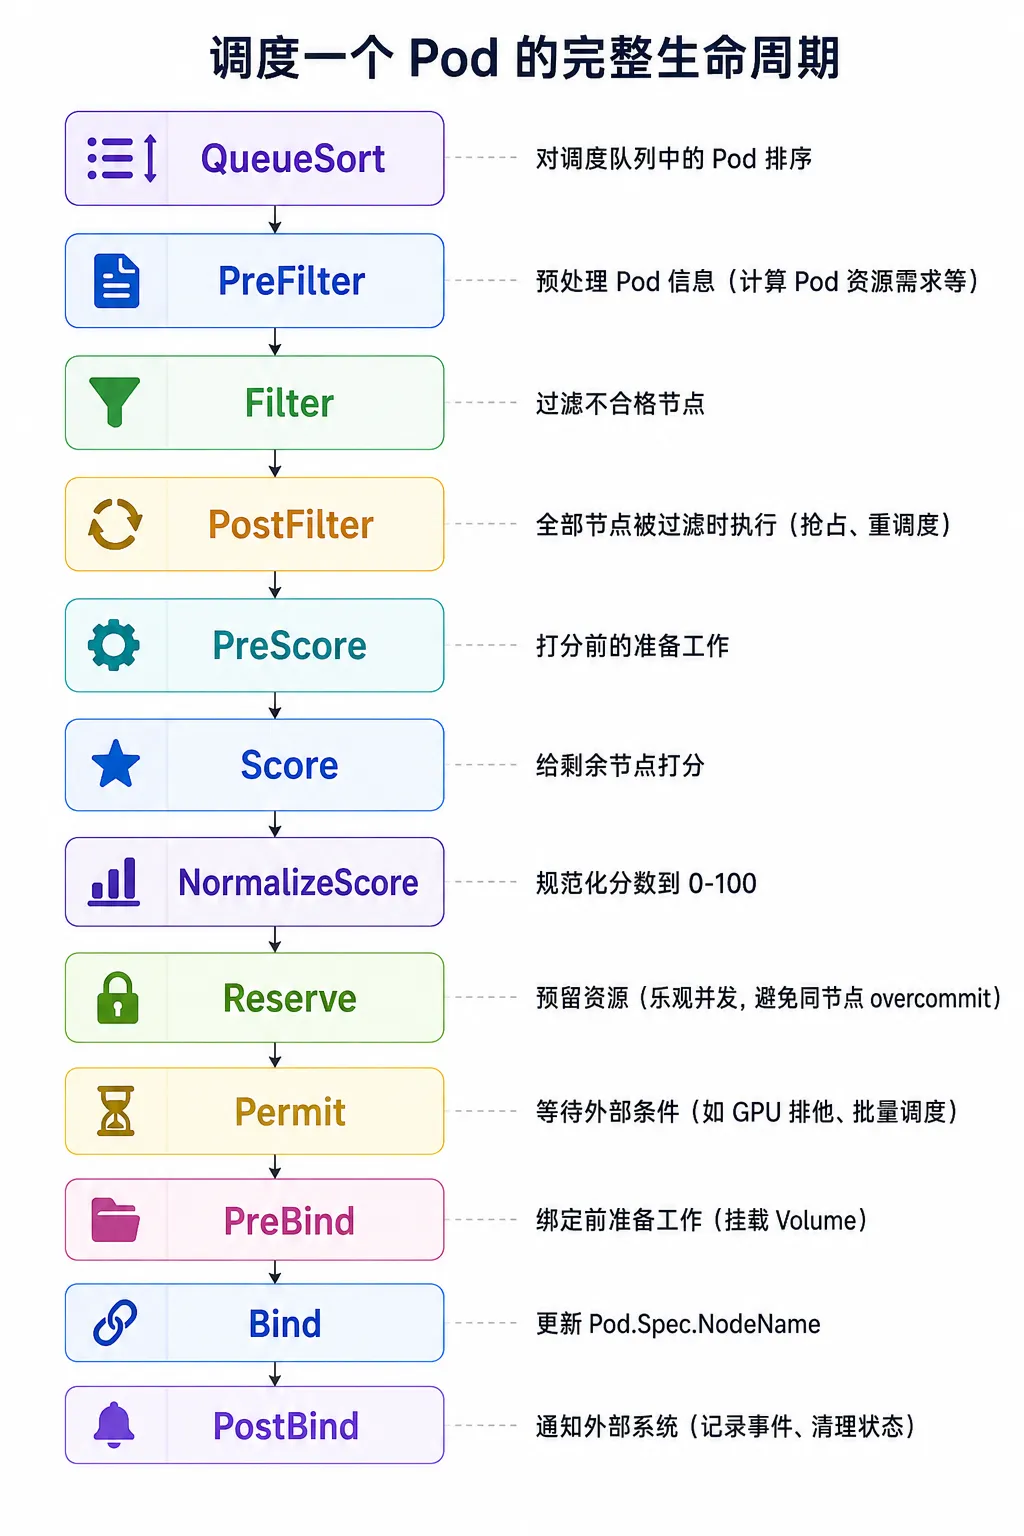
每个扩展点都可以注册多个插件。插件接口统一在 `pkg/scheduler/framework/interface.go`:
```gotype Plugin interface {Name() string}type PreFilterPlugin interface {PluginPreFilter(ctx context.Context, state *CycleState, p *v1.Pod) *Status}// ... 每个扩展点有各自的接口```
👉 这带来了一个巨大的变化:任何人都可以写自定义调度插件,编译进自己的调度器。不需要 HTTP 调用的 Scheduler Extender,性能损失几乎为零。
写一个自定义 Filter 插件:
```gotype MyPlugin struct{}func (p *MyPlugin) Name() string { return "MyPlugin" }func (p *MyPlugin) Filter(ctx context.Context, state *framework.CycleState,pod *v1.Pod, nodeInfo *framework.NodeInfo) *framework.Status {// 只在标有 "env=production" 的节点上调度if nodeInfo.Node().Labels["env"] != "production" {return framework.NewStatus(framework.Unschedulable,"node is not production")}return nil}```
Permit 扩展点是整个框架最被低估的机制。它为**批量调度**和**Gang Scheduling**提供了原生支持:
```gotype PermitPlugin interface {PluginPermit(ctx context.Context, state *CycleState,p *v1.Pod, nodeName string) *Status// 返回 Success → 继续绑定// 返回 Wait → 等待(其他 Pod 也完成调度后一起绑定)// 返回 Reject → 终止}```
👉 Coscheduling(Gang Scheduling)正是基于 Permit 扩展点实现的——所有关联 Pod 都找到节点后,一起 Bind,避免部分 Pod 占位而其他 Pod 调不上的死锁。
💥 Reserve 扩展点:宽松并发和乐观锁
这是调度器性能的一个关键设计。
调度器以 Pod 为单位串行执行(同一时间内调度一个 Pod)。但在 Filter+Score 和最终 Bind 之间,调度器用了宽松并发(Optimistic Concurrency)。意思是:算好节点 X 后,不会锁定节点 X。如果两个调度周期几乎同时算出节点 X,两个 Pod 都会被绑到同一台节点上。
那不会 Overcommit 吗?有可能。但调度器在 Reserve 阶段做了一次资源预留:
```gotype ReservePlugin interface {PluginReserve(ctx context.Context, state *CycleState,p *v1.Pod, nodeName string) *Status// 在调度器缓存中"虚拟占用"一部分资源// 实际为其他 Pod 的后续调度提供"减少"的 allocatable 视图}```
它并不能完全消除 overcommit,但能大大降低发生率。如果最后还是 overcommit 了——kubelet 会直接拒绝启动 Pod(因为 Admission 检查到资源不够),Pod 状态变成 `OutOfCpu` 等,调度器重新调度。
👉 这就是"最终一致性"的设计哲学——调度器追求高吞吐,接受低概率的冲突,事后修复。
🧩 调度器的缓存层:Informer + Scheduler Cache
调度器不直接查 API Server。它有自己独立的内存缓存——Scheduler Cache。
```go// pkg/scheduler/internal/cache/cache.gotype SchedulerCache interface {// 由 Informer 事件驱动更新AddPod(pod *v1.Pod) errorUpdatePod(oldPod, newPod *v1.Pod) errorRemovePod(pod *v1.Pod) errorAddNode(node *v1.Node) errorUpdateNode(oldNode, newNode *v1.Node) errorRemoveNode(node *v1.Node) error}```
调度器通过 Informer Watch 所有 Pod、Node、PV、PVC 等资源,实时同步到这块缓存中。调度算法直接读内存——不经过 API Server。
👉 这也是为什么大量 Pod 同时创建时,API Server 的 CPU 负载没什么变化——调度器只读本地缓存,不频繁查询 API Server。
⚠️ 但这导致了一个经典问题:缓存延迟。API Server 上的数据更新了,到调度器缓存同步,有几十到几百毫秒的延迟。这在极端并发的场景下可能导致"调度器认为有资源,但 kubelet 认为没资源"的瞬时不一致。
🎯 常见调度失败排查指南
1️⃣ `kubectl describe pod` 看 Events
```Events:Type Reason MessageWarning FailedScheduling 0/100 nodes are available:2 node(s) had taint {key: dedicated},3 node(s) didn't match Pod's node affinity,95 Insufficient cpu.```
调度器会把每个过滤失败的原因按类别汇总,直接告诉你:
- 2 个节点有 taint 不匹配
- 3 个节点不匹配 affinity
- 95 个节点 CPU 不够
2️⃣ 检查资源计算
```bashkubectl describe node <node-name> | grep -A5 "Allocated resources"Allocated resources:Resource Requests Limitscpu 15600m (97%) 32000m (200%)memory 28Gi (90%) 40Gi (130%)```
CPU Requests 已经 97%——接近上限,大请求量的 Pod 会调度失败。
3️⃣ 检查 taints 和 tolerations
```bashkubectl describe node <node-name> | grep Taintskubectl get pod <pod> -o yaml | grep -A5 tolerations```
4️⃣ 检查 TopologySpreadConstraints
如果 `whenUnsatisfiable: DoNotSchedule` 而且所有 zone 的 skew 都已经达到上限——Pod 会卡在 Pending 状态。这是一个"所有人都在等"的死锁:没有人能调度,因为调度了谁都会违反 skew 约束。
💡 最后一击
Kubernetes 调度器的本质是一个可插拔的过滤-打分管道,通过 Scheduling Framework 将每个决策环节暴露为扩展点。它的智慧不在于"找节点的算法有多聪明"——而在于"每个决策阶段都是独立、可替换、可组合的"。
Filter → 淘汰赛(轻量 → 重量,越早淘汰越省资源)Score → 选拔赛(多指标加权,谁的总分高谁赢)Reserve → 占位(乐观并发,少有的冲突时再修复)Bind → 写入 etcd(这才是最终的"决策")
下次你的 Pod 卡在 Pending,直接用 `kubectl describe pod` 看调度失败原因。调度器不会瞒你——它把每一个淘汰原因都清清楚楚写在 Events 里了。

下一篇:👉《我当了五年 SRE,凌晨被叫醒 47 次,总结出最值钱的教训》
我会持续写一个系列:《你真的了解 Kubernetes 吗?》
如果这篇对你有一点点帮助,点个赞 👍 或分享给朋友,就是对我最大的支持。
也欢迎关注,后面会持续更新更“能救命”的实战内容 🚀
