


文档内容
1、
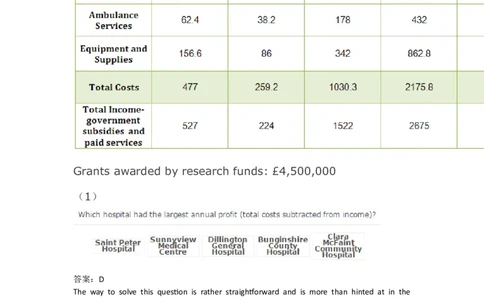
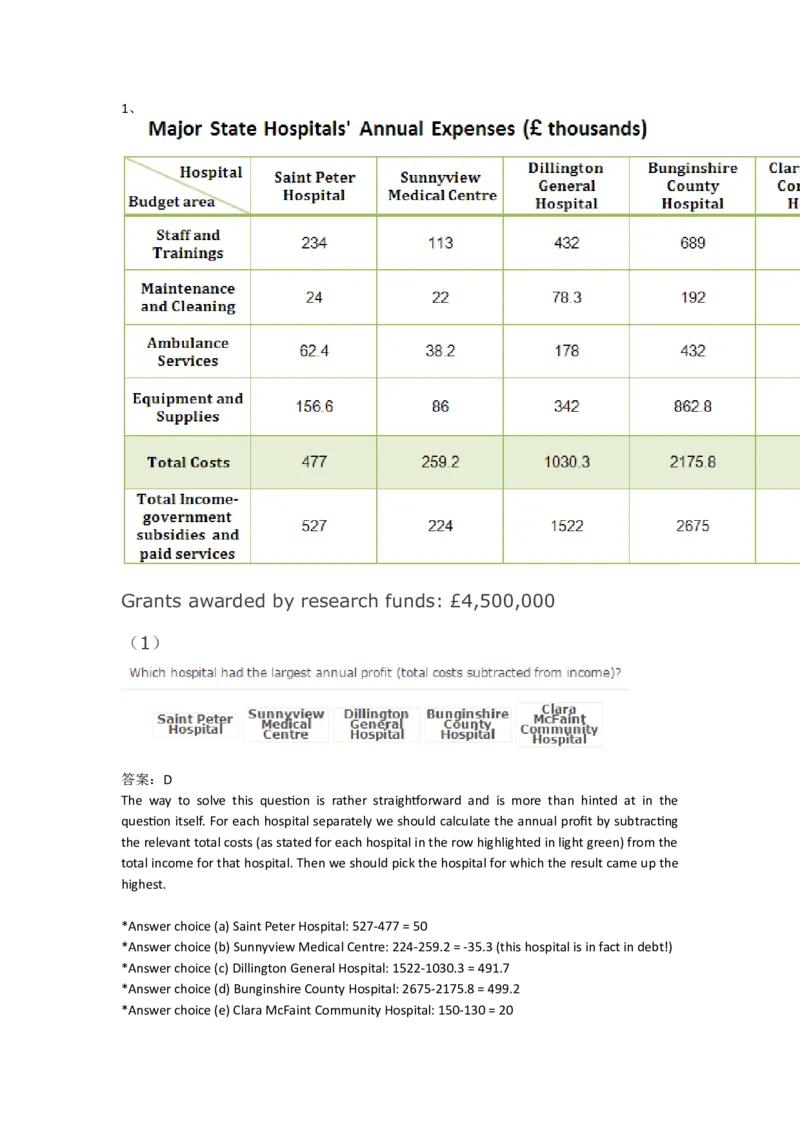
Grants awarded by research funds: £4,500,000
(1)
答案:D
The way to solve this question is rather straightforward and is more than hinted at in the
question itself. For each hospital separately we should calculate the annual profit by subtracting
the relevant total costs (as stated for each hospital in the row highlighted in light green) from the
total income for that hospital. Then we should pick the hospital for which the result came up the
highest.
*Answer choice (a) Saint Peter Hospital: 527-477 = 50
*Answer choice (b) Sunnyview Medical Centre: 224-259.2 = -35.3 (this hospital is in fact in debt!)
*Answer choice (c) Dillington General Hospital: 1522-1030.3 = 491.7
*Answer choice (d) Bunginshire County Hospital: 2675-2175.8 = 499.2
*Answer choice (e) Clara McFaint Community Hospital: 150-130 = 20As one can see from the above calculations, Bunginshire County Hospital had the largest annual
profit- answer choice (d) is therefore the correct one
(2)
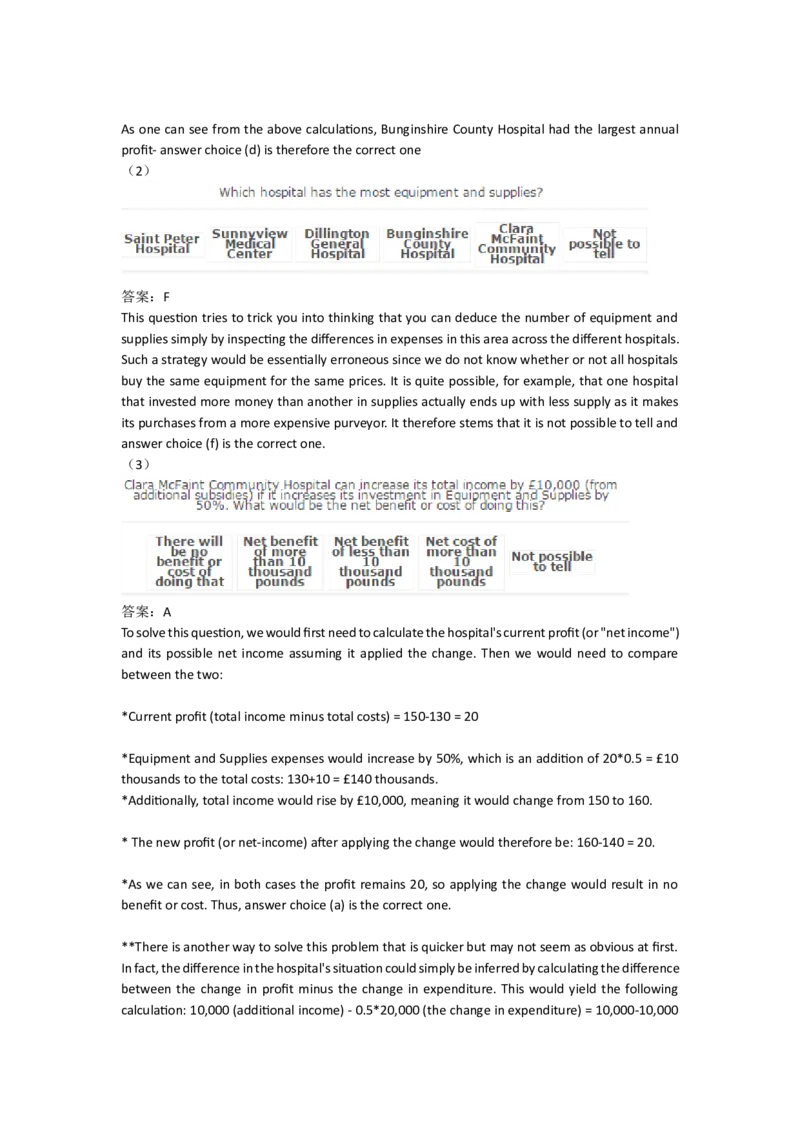
答案:F
This question tries to trick you into thinking that you can deduce the number of equipment and
supplies simply by inspecting the differences in expenses in this area across the different hospitals.
Such a strategy would be essentially erroneous since we do not know whether or not all hospitals
buy the same equipment for the same prices. It is quite possible, for example, that one hospital
that invested more money than another in supplies actually ends up with less supply as it makes
its purchases from a more expensive purveyor. It therefore stems that it is not possible to tell and
answer choice (f) is the correct one.
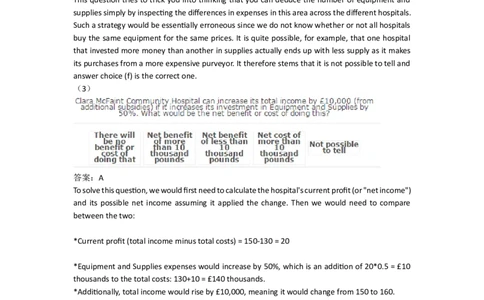
(3)
答案:A
To solve this question, we would first need to calculate the hospital's current profit (or "net income")
and its possible net income assuming it applied the change. Then we would need to compare
between the two:
*Current profit (total income minus total costs) = 150-130 = 20
*Equipment and Supplies expenses would increase by 50%, which is an addition of 20*0.5 = £10
thousands to the total costs: 130+10 = £140 thousands.
*Additionally, total income would rise by £10,000, meaning it would change from 150 to 160.
* The new profit (or net-income) after applying the change would therefore be: 160-140 = 20.
*As we can see, in both cases the profit remains 20, so applying the change would result in no
benefit or cost. Thus, answer choice (a) is the correct one.
**There is another way to solve this problem that is quicker but may not seem as obvious at first.
In fact, the difference in the hospital's situation could simply be inferred by calculating the difference
between the change in profit minus the change in expenditure. This would yield the following
calculation: 10,000 (additional income) - 0.5*20,000 (the change in expenditure) = 10,000-10,000= 0. Since we got a zero, this means that there is no change in overall benefit or cost from the initial
situation. If this method is not intuitive for you, it is just as good to follow the first method
described.
3、
(1)
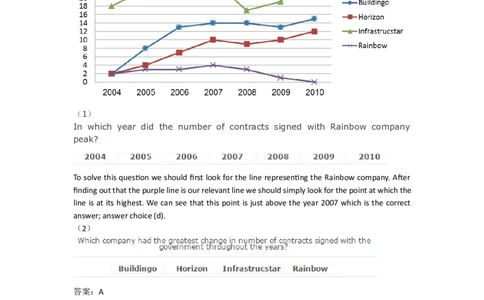
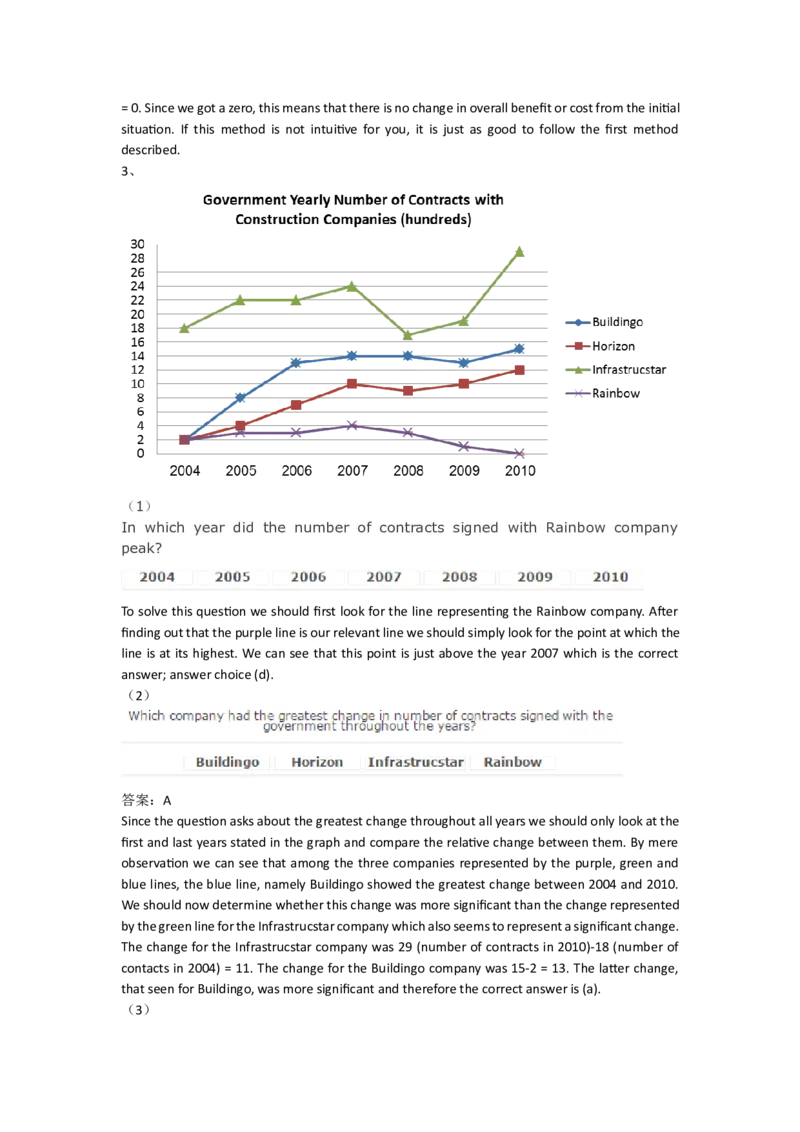
In which year did the number of contracts signed with Rainbow company
peak?
To solve this question we should first look for the line representing the Rainbow company. After
finding out that the purple line is our relevant line we should simply look for the point at which the
line is at its highest. We can see that this point is just above the year 2007 which is the correct
answer; answer choice (d).
(2)
答案:A
Since the question asks about the greatest change throughout all years we should only look at the
first and last years stated in the graph and compare the relative change between them. By mere
observation we can see that among the three companies represented by the purple, green and
blue lines, the blue line, namely Buildingo showed the greatest change between 2004 and 2010.
We should now determine whether this change was more significant than the change represented
by the green line for the Infrastrucstar company which also seems to represent a significant change.
The change for the Infrastrucstar company was 29 (number of contracts in 2010)-18 (number of
contacts in 2004) = 11. The change for the Buildingo company was 15-2 = 13. The latter change,
that seen for Buildingo, was more significant and therefore the correct answer is (a).
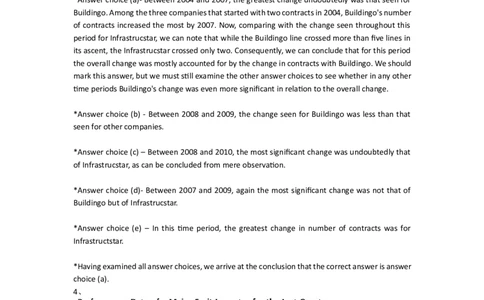
(3)答案:A
To solve this question, we should check which time period (from the answer choices) the change
in the number of Buildingo's contracts was the most significant compared with other changes in
that period. Below we will present our reasoning for each period separately:
*Answer choice (a)- Between 2004 and 2007, the greatest change undoubtedly was that seen for
Buildingo. Among the three companies that started with two contracts in 2004, Buildingo's number
of contracts increased the most by 2007. Now, comparing with the change seen throughout this
period for Infrastrucstar, we can note that while the Buildingo line crossed more than five lines in
its ascent, the Infrastrucstar crossed only two. Consequently, we can conclude that for this period
the overall change was mostly accounted for by the change in contracts with Buildingo. We should
mark this answer, but we must still examine the other answer choices to see whether in any other
time periods Buildingo's change was even more significant in relation to the overall change.
*Answer choice (b) - Between 2008 and 2009, the change seen for Buildingo was less than that
seen for other companies.
*Answer choice (c) – Between 2008 and 2010, the most significant change was undoubtedly that
of Infrastrucstar, as can be concluded from mere observation.
*Answer choice (d)- Between 2007 and 2009, again the most significant change was not that of
Buildingo but of Infrastrucstar.
*Answer choice (e) – In this time period, the greatest change in number of contracts was for
Infrastructstar.
*Having examined all answer choices, we arrive at the conclusion that the correct answer is answer
choice (a).
4、
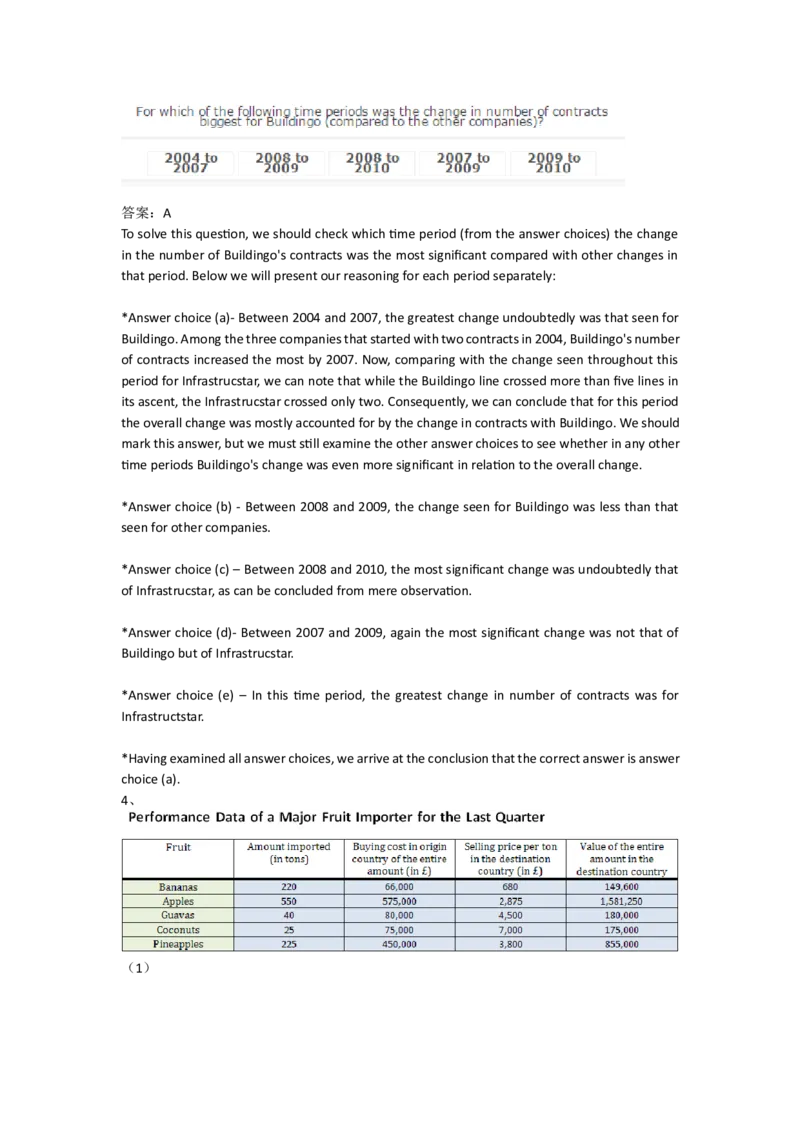
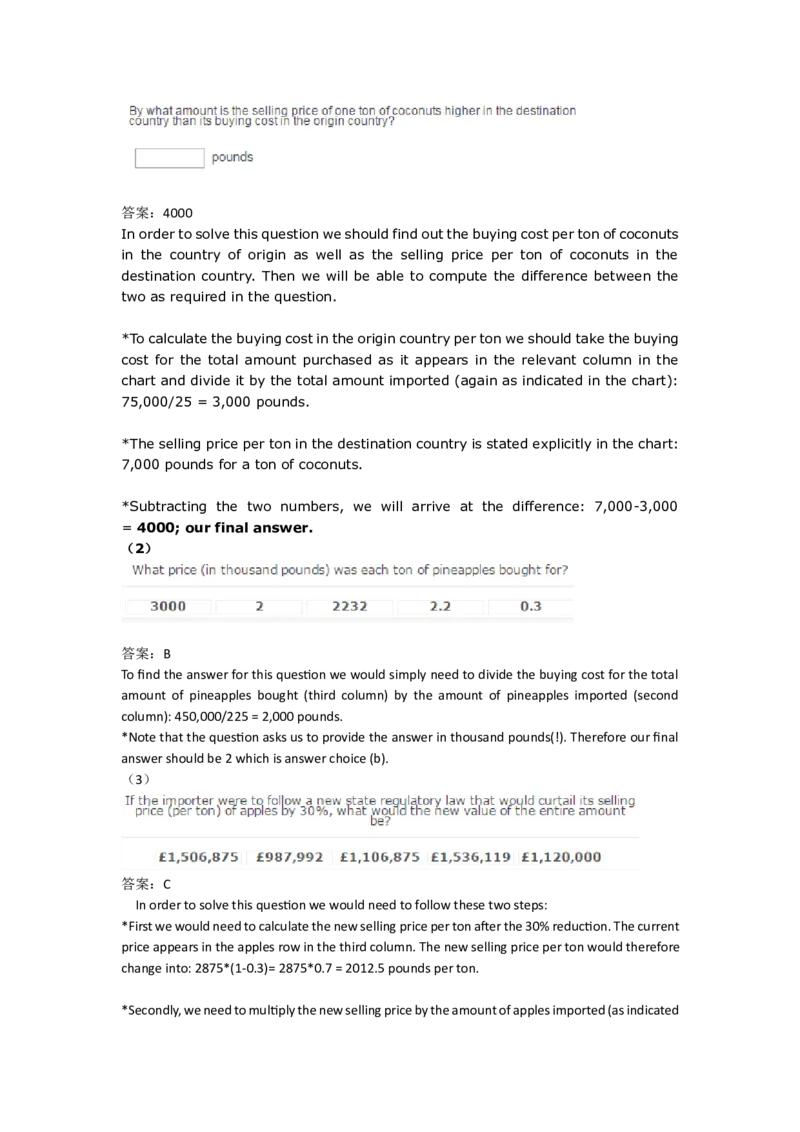
(1)答案:4000
In order to solve this question we should find out the buying cost per ton of coconuts
in the country of origin as well as the selling price per ton of coconuts in the
destination country. Then we will be able to compute the difference between the
two as required in the question.
*To calculate the buying cost in the origin country per ton we should take the buying
cost for the total amount purchased as it appears in the relevant column in the
chart and divide it by the total amount imported (again as indicated in the chart):
75,000/25 = 3,000 pounds.
*The selling price per ton in the destination country is stated explicitly in the chart:
7,000 pounds for a ton of coconuts.
*Subtracting the two numbers, we will arrive at the difference: 7,000-3,000
= 4000; our final answer.
(2)
答案:B
To find the answer for this question we would simply need to divide the buying cost for the total
amount of pineapples bought (third column) by the amount of pineapples imported (second
column): 450,000/225 = 2,000 pounds.
*Note that the question asks us to provide the answer in thousand pounds(!). Therefore our final
answer should be 2 which is answer choice (b).
(3)
答案:C
In order to solve this question we would need to follow these two steps:
*First we would need to calculate the new selling price per ton after the 30% reduction. The current
price appears in the apples row in the third column. The new selling price per ton would therefore
change into: 2875*(1-0.3)= 2875*0.7 = 2012.5 pounds per ton.
*Secondly, we need to multiply the new selling price by the amount of apples imported (as indicatedin the second column): 2012.5*550 = £1,106,875; the correct answer choice is therefore (c).
5、
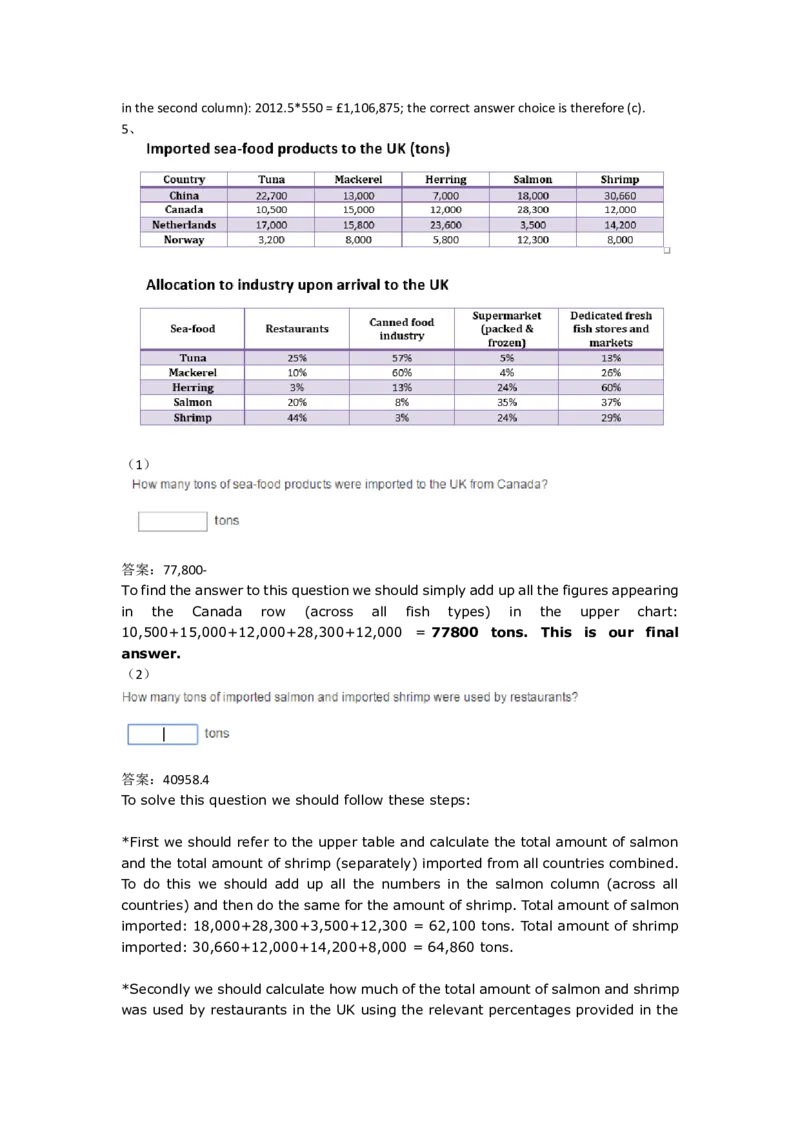
(1)
答案:77,800-
To find the answer to this question we should simply add up all the figures appearing
in the Canada row (across all fish types) in the upper chart:
10,500+15,000+12,000+28,300+12,000 = 77800 tons. This is our final
answer.
(2)
答案:40958.4
To solve this question we should follow these steps:
*First we should refer to the upper table and calculate the total amount of salmon
and the total amount of shrimp (separately) imported from all countries combined.
To do this we should add up all the numbers in the salmon column (across all
countries) and then do the same for the amount of shrimp. Total amount of salmon
imported: 18,000+28,300+3,500+12,300 = 62,100 tons. Total amount of shrimp
imported: 30,660+12,000+14,200+8,000 = 64,860 tons.
*Secondly we should calculate how much of the total amount of salmon and shrimp
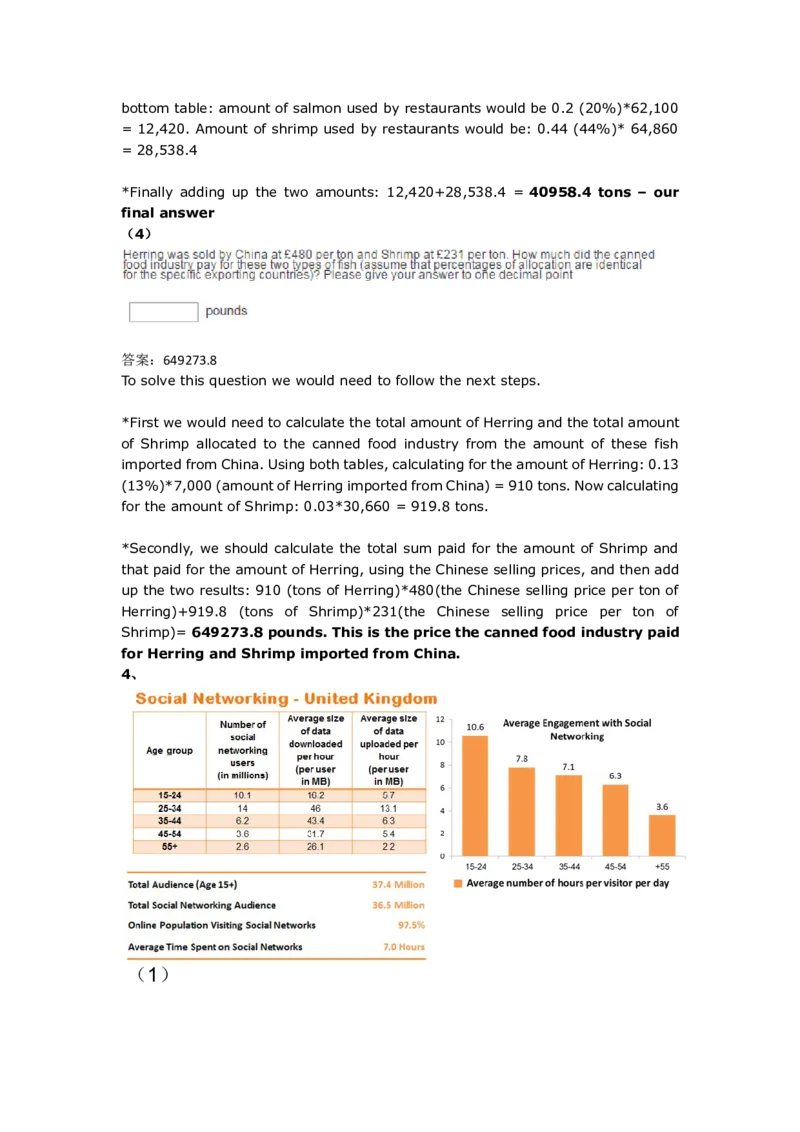
was used by restaurants in the UK using the relevant percentages provided in thebottom table: amount of salmon used by restaurants would be 0.2 (20%)*62,100
= 12,420. Amount of shrimp used by restaurants would be: 0.44 (44%)* 64,860
= 28,538.4
*Finally adding up the two amounts: 12,420+28,538.4 = 40958.4 tons – our
final answer
(4)
答案:649273.8
To solve this question we would need to follow the next steps.
*First we would need to calculate the total amount of Herring and the total amount
of Shrimp allocated to the canned food industry from the amount of these fish
imported from China. Using both tables, calculating for the amount of Herring: 0.13
(13%)*7,000 (amount of Herring imported from China) = 910 tons. Now calculating
for the amount of Shrimp: 0.03*30,660 = 919.8 tons.
*Secondly, we should calculate the total sum paid for the amount of Shrimp and
that paid for the amount of Herring, using the Chinese selling prices, and then add
up the two results: 910 (tons of Herring)*480(the Chinese selling price per ton of
Herring)+919.8 (tons of Shrimp)*231(the Chinese selling price per ton of
Shrimp)= 649273.8 pounds. This is the price the canned food industry paid
for Herring and Shrimp imported from China.
4、
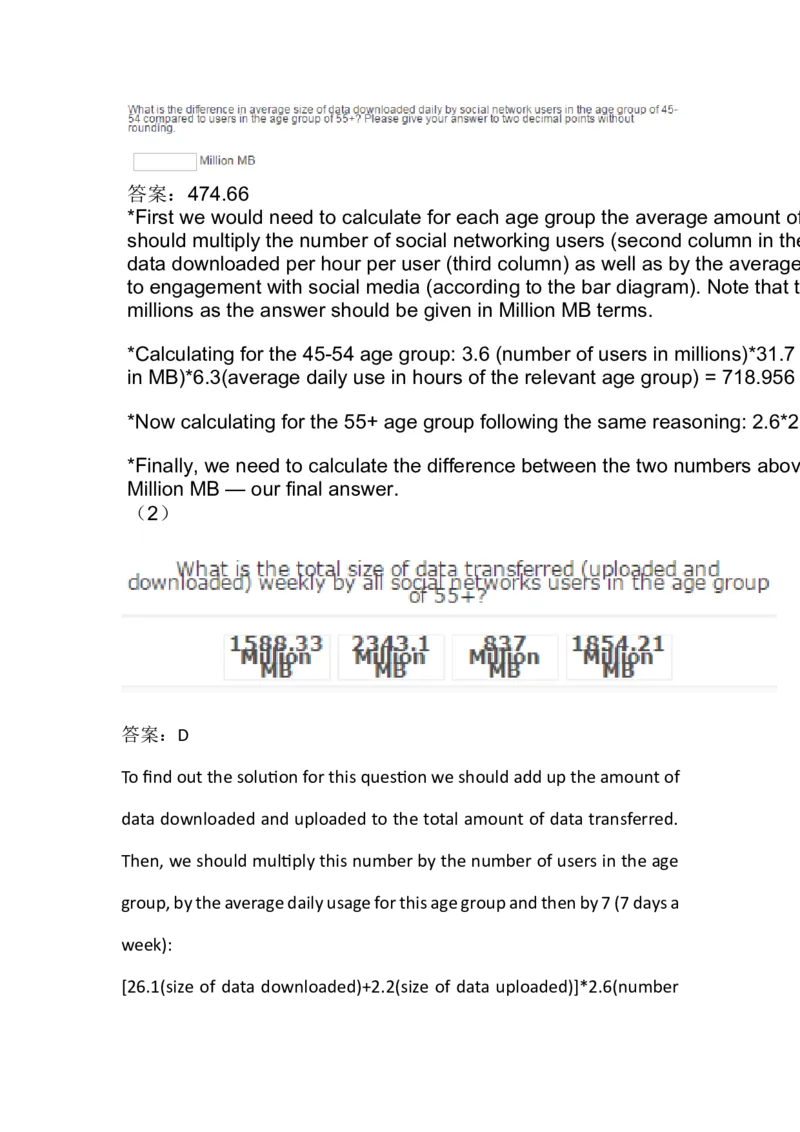
(1)答案:474.66
*First we would need to calculate for each age group the average amount of data downloaded. To do this we
should multiply the number of social networking users (second column in the left table) by the average size of
data downloaded per hour per user (third column) as well as by the average number of hours dedicated daily
to engagement with social media (according to the bar diagram). Note that there is no need to expand the
millions as the answer should be given in Million MB terms.
*Calculating for the 45-54 age group: 3.6 (number of users in millions)*31.7 (size of data downloaded per hour
in MB)*6.3(average daily use in hours of the relevant age group) = 718.956
*Now calculating for the 55+ age group following the same reasoning: 2.6*26.1*3.6 = 244.296
*Finally, we need to calculate the difference between the two numbers above: 718.956-244.296 = 474.66
Million MB — our final answer.
(2)
答案:D
To find out the solution for this question we should add up the amount of
data downloaded and uploaded to the total amount of data transferred.
Then, we should multiply this number by the number of users in the age
group, by the average daily usage for this age group and then by 7 (7 days a
week):
[26.1(size of data downloaded)+2.2(size of data uploaded)]*2.6(numberof users)*3.6(average daily use in hours for this age group)*7(seven days)
= 1,854.21 Million MB; our final answer
(3)
Assuming average usage, what is the difference in total data uploaded
between all users in the age group of 15-24 to all users in the age group
of 35-44 over 3 months (assume 1 month=30 days)?
答案:A
To solve this question we should first calculate for each age group separately
the total size of data uploaded by multiplying the number of users in the
age group by the average size of data uploaded per hour per user (both
from the table), by the average daily usage in hours (from the bar chart),
by 30 (30 days a month), by 3 (three months).
*Calculating for the 15-24 age group: 10.1(number of users in
millions)*5.7(size of data uploaded in MB per hour per user in this age
group)*10.6(average number of hours per user per day)*30(30
days)*3(three months) = 54,921.78 Million MB.
*Calculating for the 35-44 age group, following the same reasoning:
6.2*6.3*7.1*30*3 = 24,959.34 Million MB.
*Subtracting to calculate the difference: 54,921.78-24,959.34 = 29,962.44
Million MB. This is the difference between the two age groups and ourfinal answer.
4、
(1)
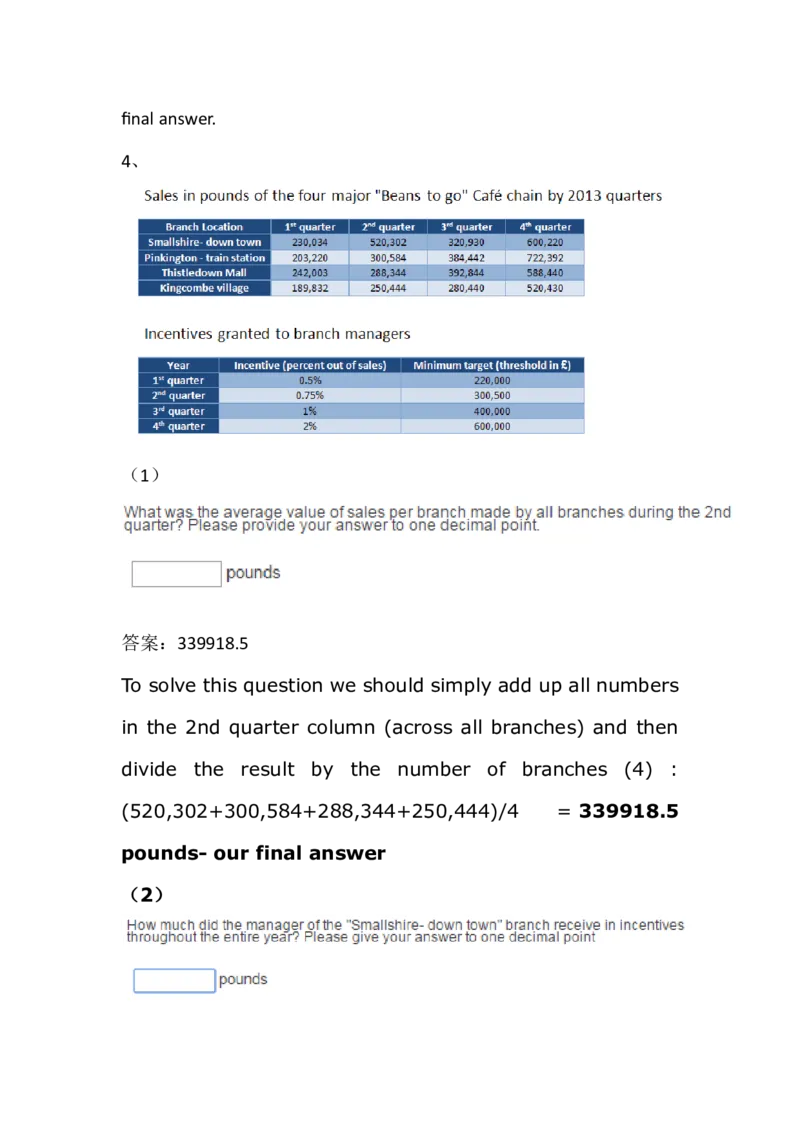
答案:339918.5
To solve this question we should simply add up all numbers
in the 2nd quarter column (across all branches) and then
divide the result by the number of branches (4) :
(520,302+300,584+288,344+250,444)/4 = 339918.5
pounds- our final answer
(2)答案:17056.8
*To solve this question we should first compare the minimum target of
each quarter (bottom table) with the actual sales of "Smallshire- down
town" each quarter (bottom table) checking if and when the actual sales
exceeded the target. We can see that the actual sales exceeded the
required minimum target in all quarters apart from the third quarter.
*Secondly we should calculate the incentives for each quarter (except the
third quarter) by accounting for the corresponding percentage for each
quarter: 0.005(0.5% incentive for the 1st quarter)*230,034(1st quarter
actual sales) = 1,150.17 pounds.
Following the same process for the other quarters- 2nd quarter:
0.0075*520,302 = 3,902.265 pounds. 4th quarter: 0.02*600,220 =
12,004.4
*Finally adding up the manager's total earnings in incentives:
1,150.17+3,902.265+12,004.4 = 17056.8 pounds- our final answer.
*Note that the above explanation is broken down into steps for explanatory
reasons. In the real test you should try to calculate everything in one step
using your calculator, to save precious time. I.e:0.005*230,034+0.0075*520,302+0.02*600,220 = 17,056.8 pounds.
(3)
答案:A
To solve this question we need to divide the amount of money given as
incentives for the 3rd quarter by the total amount of sales that quarter.
However, as we inspect the actual sales each branch made that quarter
and compare it against the minimum target for that quarter, we find out
that no branch passed the target. This means that no incentives were
given to any branch that quarter. Hence, regardless of the total amount
of sales that quarter, the proportion must be zero (0 divided by any
number will always yield 0) and therefore answer choice (a) is the correct
one.
*One possible trap included in this question is that one may be tempted
to calculate incentives for each branch and then sum them up ignoring
the minimum target (that no branch actually passed).
6、(1)
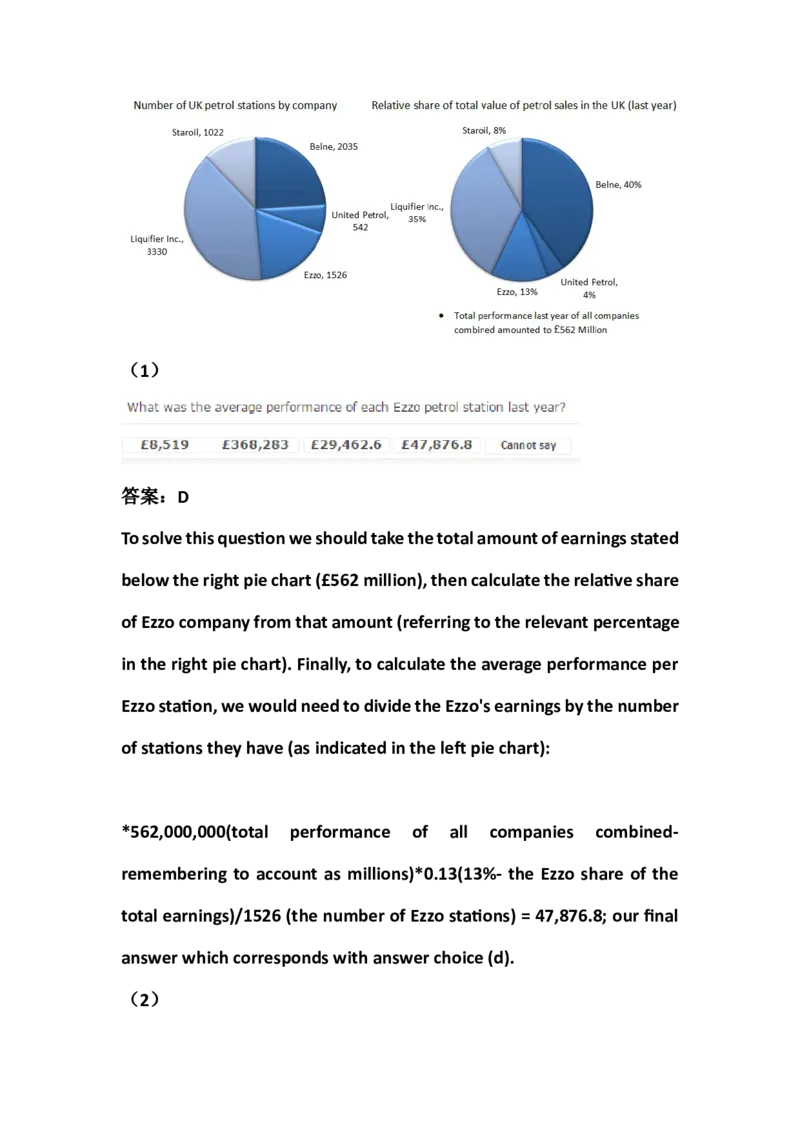
答案:D
To solve this question we should take the total amount of earnings stated
below the right pie chart (£562 million), then calculate the relative share
of Ezzo company from that amount (referring to the relevant percentage
in the right pie chart). Finally, to calculate the average performance per
Ezzo station, we would need to divide the Ezzo's earnings by the number
of stations they have (as indicated in the left pie chart):
*562,000,000(total performance of all companies combined-
remembering to account as millions)*0.13(13%- the Ezzo share of the
total earnings)/1526 (the number of Ezzo stations) = 47,876.8; our final
answer which corresponds with answer choice (d).
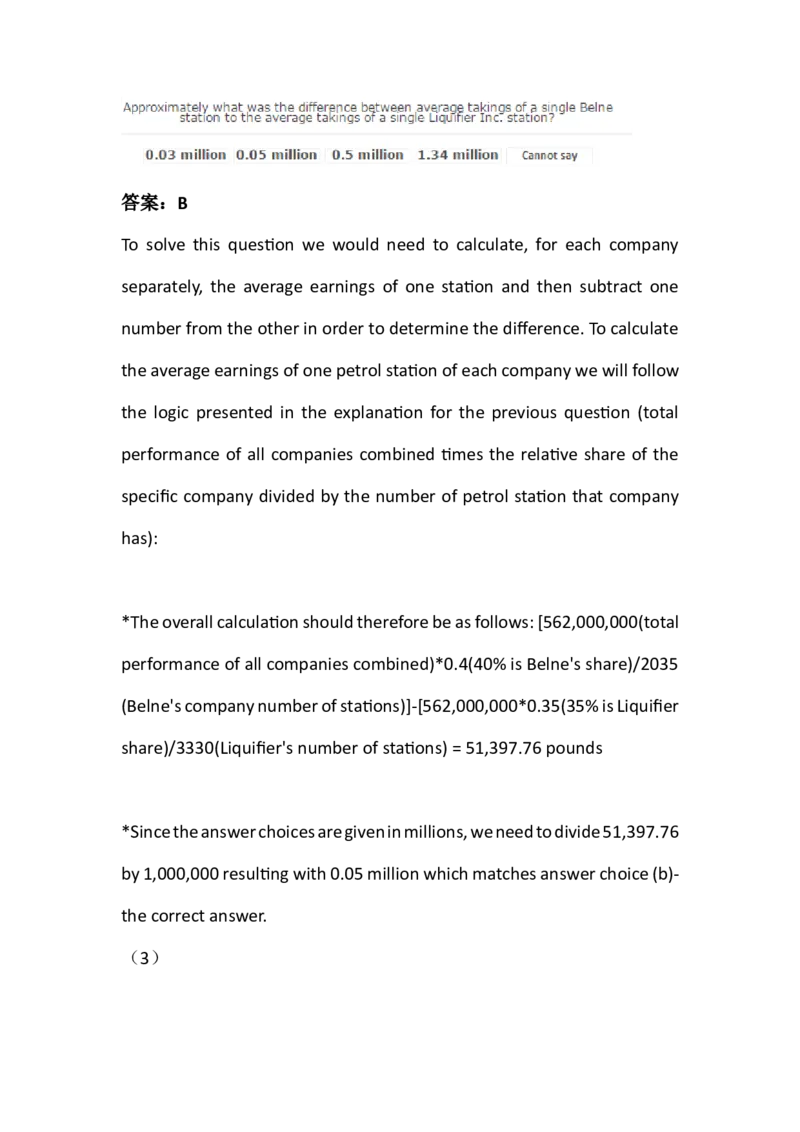
(2)答案:B
To solve this question we would need to calculate, for each company
separately, the average earnings of one station and then subtract one
number from the other in order to determine the difference. To calculate
the average earnings of one petrol station of each company we will follow
the logic presented in the explanation for the previous question (total
performance of all companies combined times the relative share of the
specific company divided by the number of petrol station that company
has):
*The overall calculation should therefore be as follows: [562,000,000(total
performance of all companies combined)*0.4(40% is Belne's share)/2035
(Belne's company number of stations)]-[562,000,000*0.35(35% is Liquifier
share)/3330(Liquifier's number of stations) = 51,397.76 pounds
*Since the answer choices are given in millions, we need to divide 51,397.76
by 1,000,000 resulting with 0.05 million which matches answer choice (b)-
the correct answer.
(3)答案:3.3
In order to solve this question we would first need to calculate Staroil's earnings
last year. Then we would need to calculate the percentage increase from the year
before last.
*Calculating Staroil's earnings this year we follow the same logic as in the two
previous questions (see explanations to these questions): 562,000,000*0.08 =
44,960,000 or £44.96 million.
*Given that the year before last Staroil made £43.5 in earnings we should calculate
the percentage increase as follows: (44.96-43.5)/43.5 = 0.033. Converting to
percent terms: 0.033= 3.3% and this is our final answer

