
文档内容
1、
(1)
答案:B
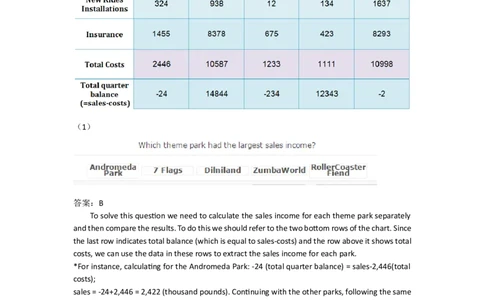
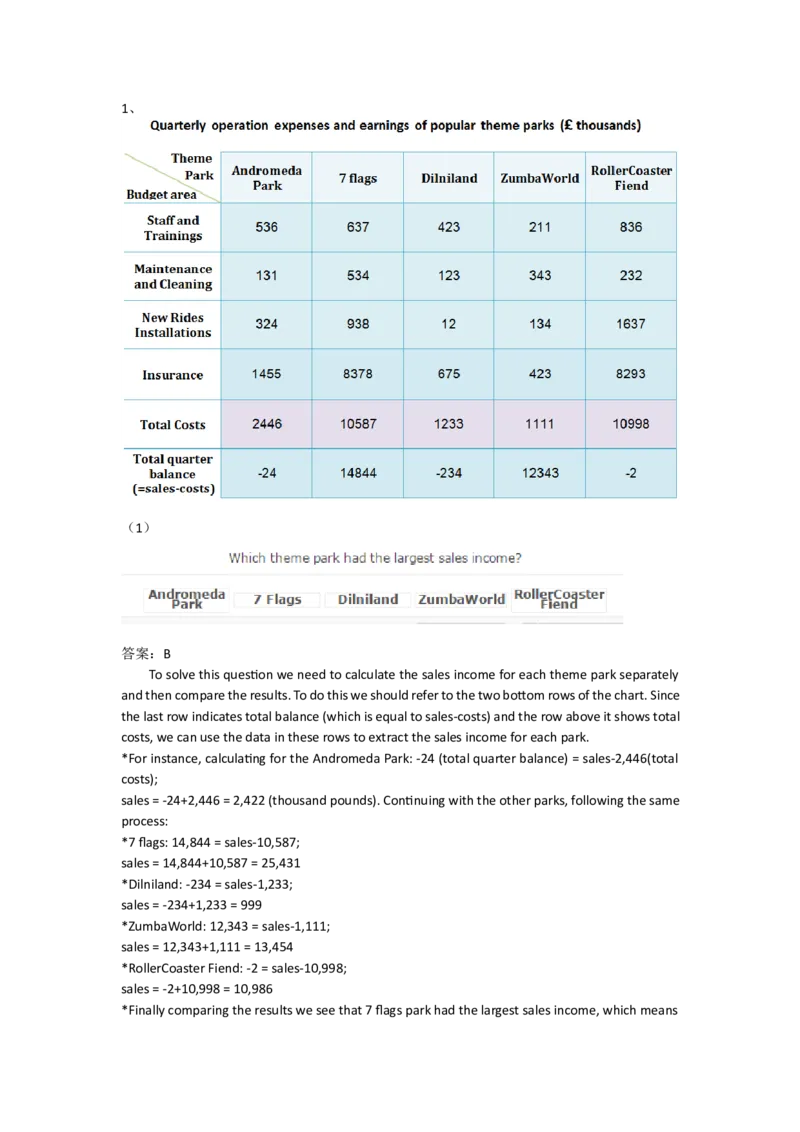
To solve this question we need to calculate the sales income for each theme park separately
and then compare the results. To do this we should refer to the two bottom rows of the chart. Since
the last row indicates total balance (which is equal to sales-costs) and the row above it shows total
costs, we can use the data in these rows to extract the sales income for each park.
*For instance, calculating for the Andromeda Park: -24 (total quarter balance) = sales-2,446(total
costs);
sales = -24+2,446 = 2,422 (thousand pounds). Continuing with the other parks, following the same
process:
*7 flags: 14,844 = sales-10,587;
sales = 14,844+10,587 = 25,431
*Dilniland: -234 = sales-1,233;
sales = -234+1,233 = 999
*ZumbaWorld: 12,343 = sales-1,111;
sales = 12,343+1,111 = 13,454
*RollerCoaster Fiend: -2 = sales-10,998;
sales = -2+10,998 = 10,986
*Finally comparing the results we see that 7 flags park had the largest sales income, which meansthat answer choice (b) is the correct one.
(2)
答案:D
To solve this question, we need to calculate the earnings made by the theme park in question.
*To do this, we should simply multiply the two figures stated, namely £31*434,000 = £13,454,000.
(You can calculate 31*434 and add three zeros to the end to make this easier.)
*Secondly, we need to compare this number to the earnings made by each park to find a match.
As we have already calculated all incomes for the previous question, we can see that the number
calculated using the data from this question matches the earnings made by ZumbaWorld. Therefore,
answer choice (d) is the correct answer.
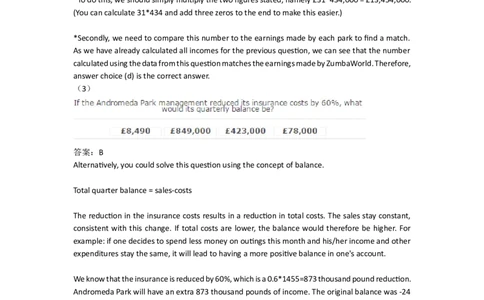
(3)
答案:B
Alternatively, you could solve this question using the concept of balance.
Total quarter balance = sales-costs
The reduction in the insurance costs results in a reduction in total costs. The sales stay constant,
consistent with this change. If total costs are lower, the balance would therefore be higher. For
example: if one decides to spend less money on outings this month and his/her income and other
expenditures stay the same, it will lead to having a more positive balance in one's account.
We know that the insurance is reduced by 60%, which is a 0.6*1455=873 thousand pound reduction.
Andromeda Park will have an extra 873 thousand pounds of income. The original balance was -24
thousand pounds. Therefore, the current balance is
-24+873=849 thousand pounds = 849,000.2、
(1)
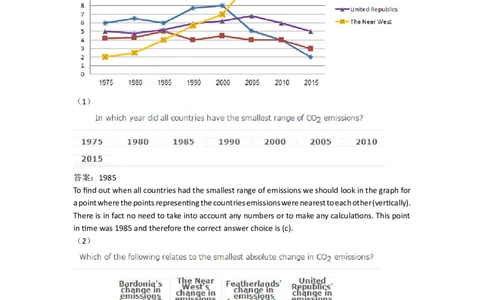
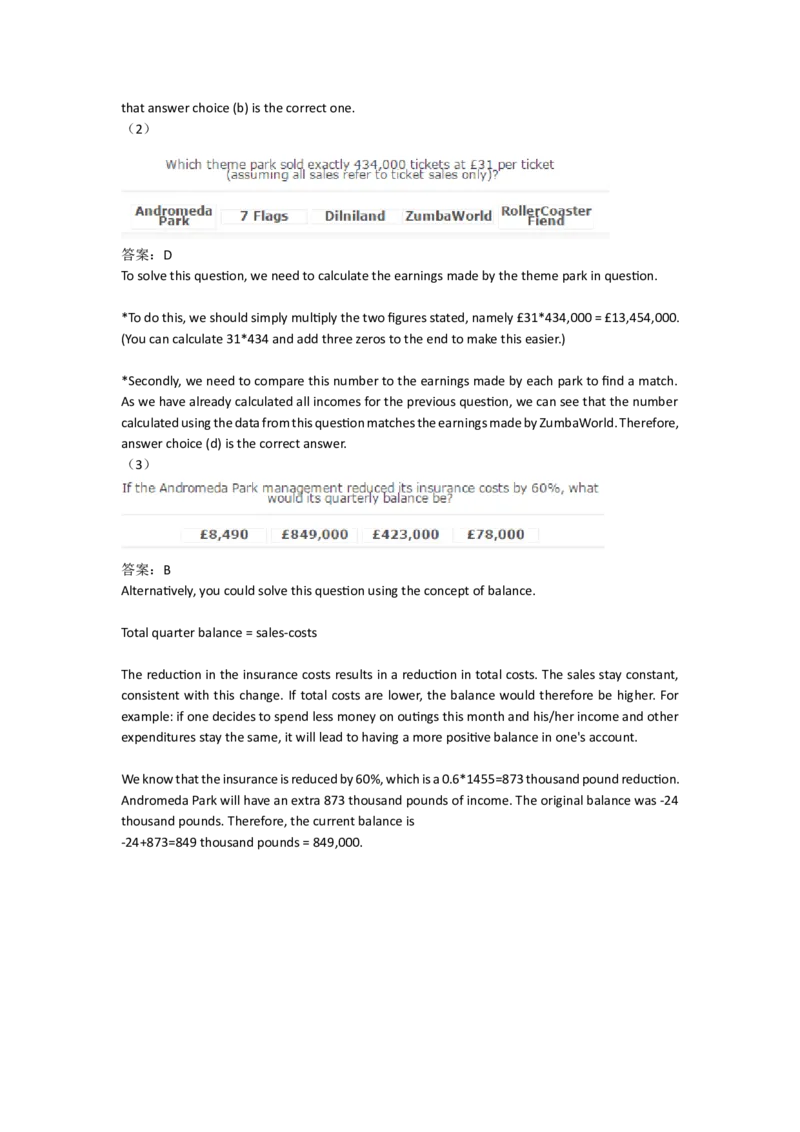
答案:1985
To find out when all countries had the smallest range of emissions we should look in the graph for
a point where the points representing the countries emissions were nearest to each other (vertically).
There is in fact no need to take into account any numbers or to make any calculations. This point
in time was 1985 and therefore the correct answer choice is (c).
(2)
答案:C
To solve this question we should refer to the graph and check the difference in emissions between
the two years mentioned in each answer choice separately. Then we should compare our results
and choose the one representing the smallest change.
*For answer choice (a)- Bardonia: In 2000 the graph reads 2 and in 1985 it reads 6. The change was
therefore 2-6= -4. However note that the question asks about absolute (!) change, so for this
question that would be 4. Following the same logic for the next answer choices:*Answer choice (b)- The Near West: 16-7 = 9
*Answer choice (c) – Featherlands: 4-4 = 0
*Answer choice (d)- United Republics: 8-2 = 6
*Comparing the results we see that answer choice (c) relates to the smallest change in emissions
and is the correct answer. Note that the full calculations were made here for explanatory purposes.
It is advised to solve this kind of question merely by observing the lines in the graph (noting that
the Fetherlands line in the indicated time period increases and then decreases back to the same
height and therefore represents no change in emissions).
(3)
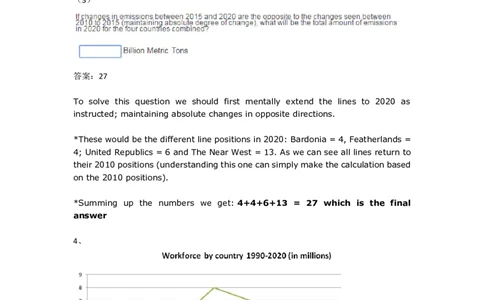
答案:27
To solve this question we should first mentally extend the lines to 2020 as
instructed; maintaining absolute changes in opposite directions.
*These would be the different line positions in 2020: Bardonia = 4, Featherlands =
4; United Republics = 6 and The Near West = 13. As we can see all lines return to
their 2010 positions (understanding this one can simply make the calculation based
on the 2010 positions).
*Summing up the numbers we get: 4+4+6+13 = 27 which is the final
answer
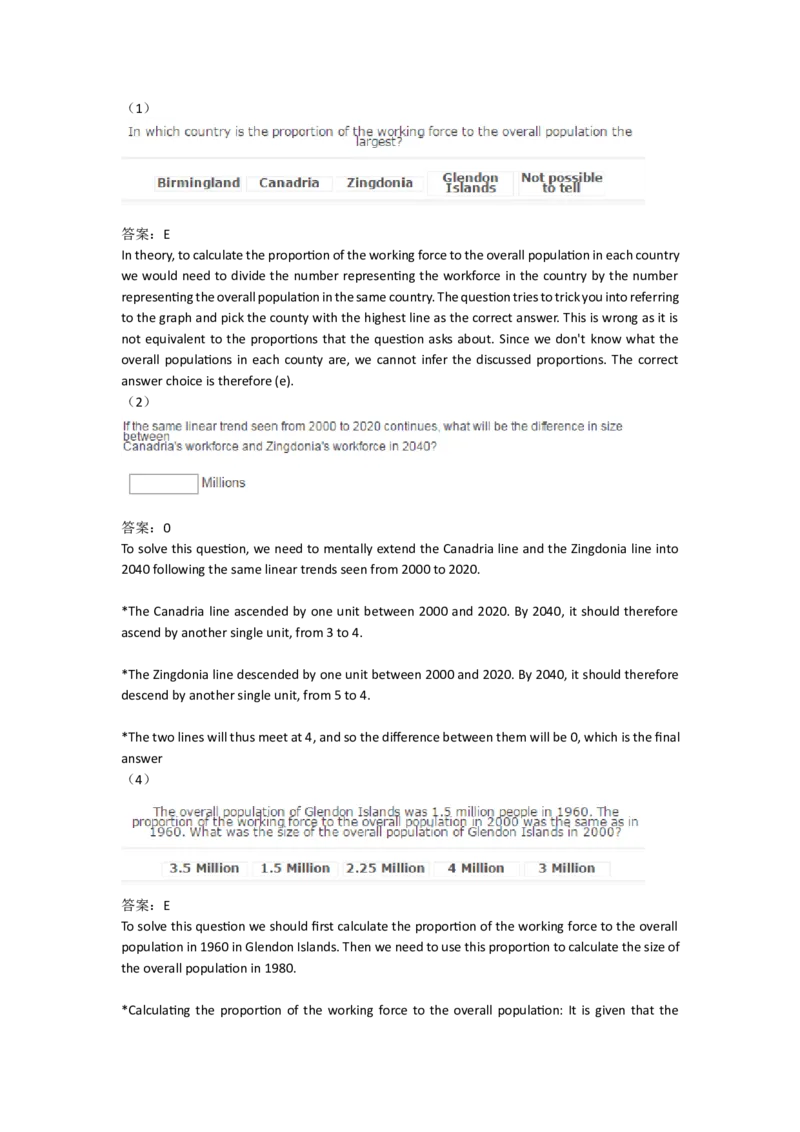
4、(1)
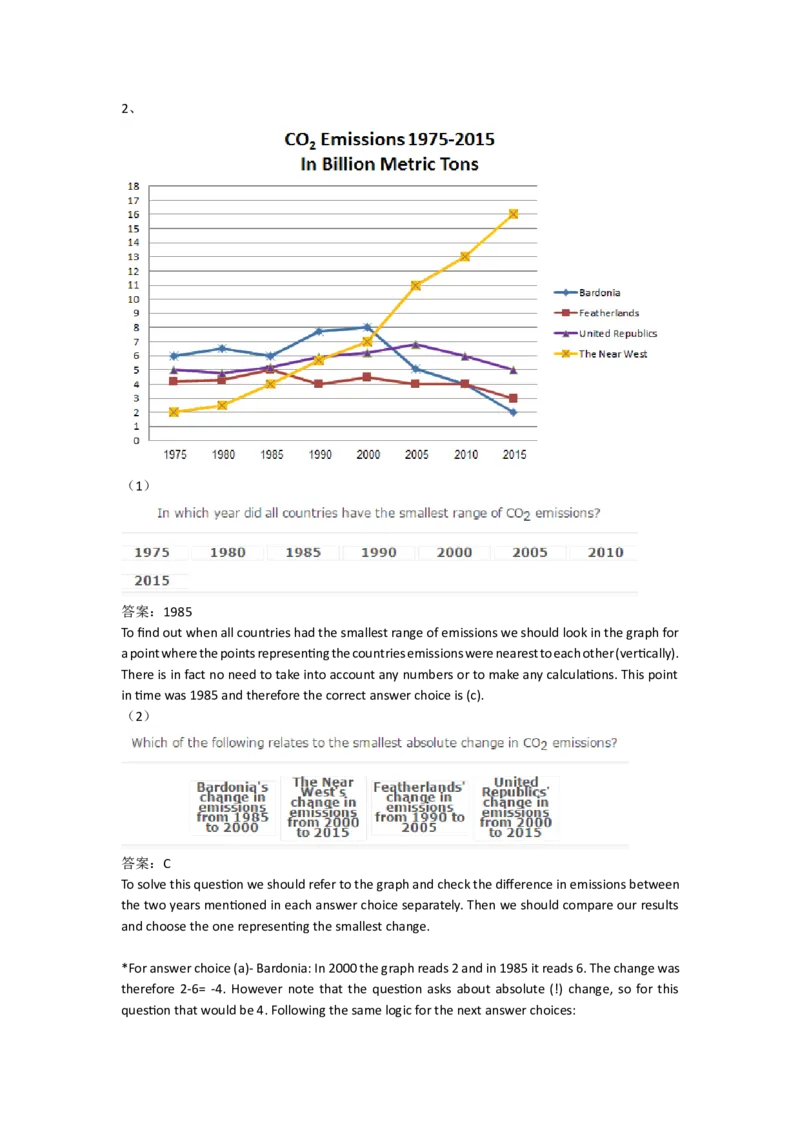
答案:E
In theory, to calculate the proportion of the working force to the overall population in each country
we would need to divide the number representing the workforce in the country by the number
representing the overall population in the same country. The question tries to trick you into referring
to the graph and pick the county with the highest line as the correct answer. This is wrong as it is
not equivalent to the proportions that the question asks about. Since we don't know what the
overall populations in each county are, we cannot infer the discussed proportions. The correct
answer choice is therefore (e).
(2)
答案:0
To solve this question, we need to mentally extend the Canadria line and the Zingdonia line into
2040 following the same linear trends seen from 2000 to 2020.
*The Canadria line ascended by one unit between 2000 and 2020. By 2040, it should therefore
ascend by another single unit, from 3 to 4.
*The Zingdonia line descended by one unit between 2000 and 2020. By 2040, it should therefore
descend by another single unit, from 5 to 4.
*The two lines will thus meet at 4, and so the difference between them will be 0, which is the final
answer
(4)
答案:E
To solve this question we should first calculate the proportion of the working force to the overall
population in 1960 in Glendon Islands. Then we need to use this proportion to calculate the size of
the overall population in 1980.
*Calculating the proportion of the working force to the overall population: It is given that theGlendon Islands' population in 1960 was 1.5 million. Referring to the graph we see that in that year
the size of the working force there was 1 million, so the proportion was: 1/1.5 = 2/3.
*Next, calculating the size of the overall population in 2000 knowing that the proportion of 2/3
remained the same: 2/3 = 2/overall population; overall population = 2*3/2 = 3 million. This means
that the correct answer choice is (e).
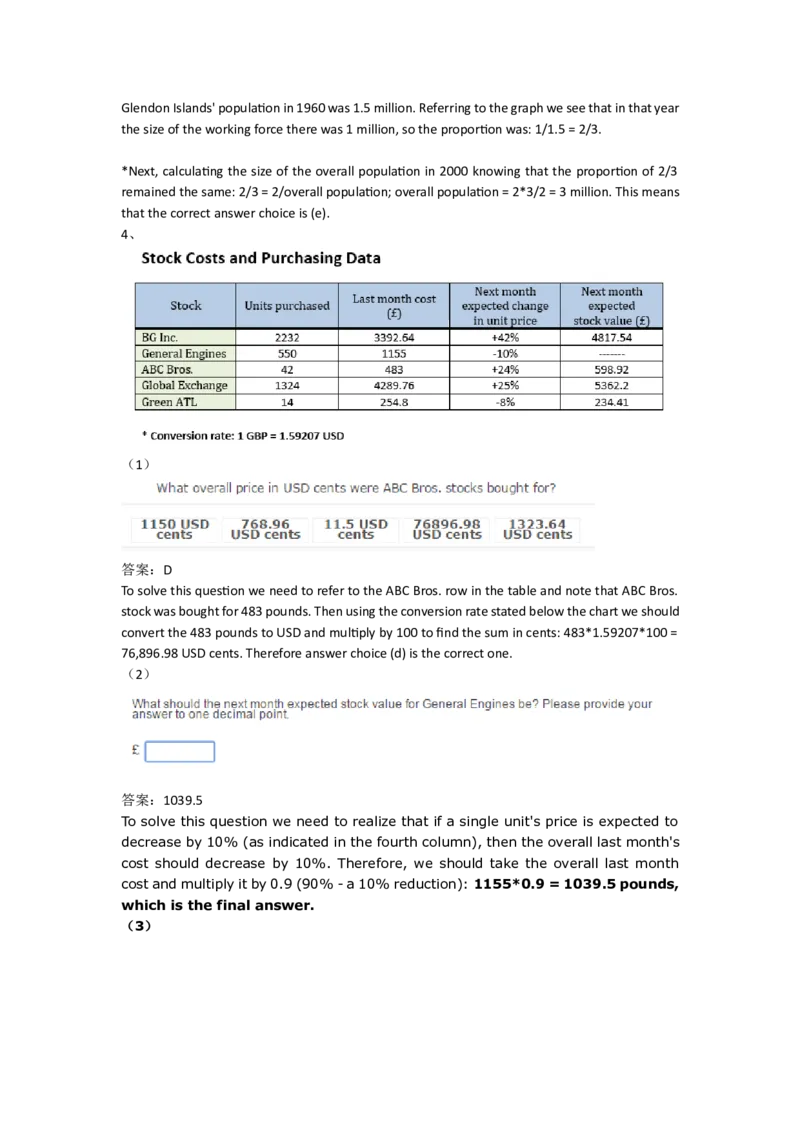
4、
(1)
答案:D
To solve this question we need to refer to the ABC Bros. row in the table and note that ABC Bros.
stock was bought for 483 pounds. Then using the conversion rate stated below the chart we should
convert the 483 pounds to USD and multiply by 100 to find the sum in cents: 483*1.59207*100 =
76,896.98 USD cents. Therefore answer choice (d) is the correct one.
(2)
答案:1039.5
To solve this question we need to realize that if a single unit's price is expected to
decrease by 10% (as indicated in the fourth column), then the overall last month's
cost should decrease by 10%. Therefore, we should take the overall last month
cost and multiply it by 0.9 (90% - a 10% reduction): 1155*0.9 = 1039.5 pounds,
which is the final answer.
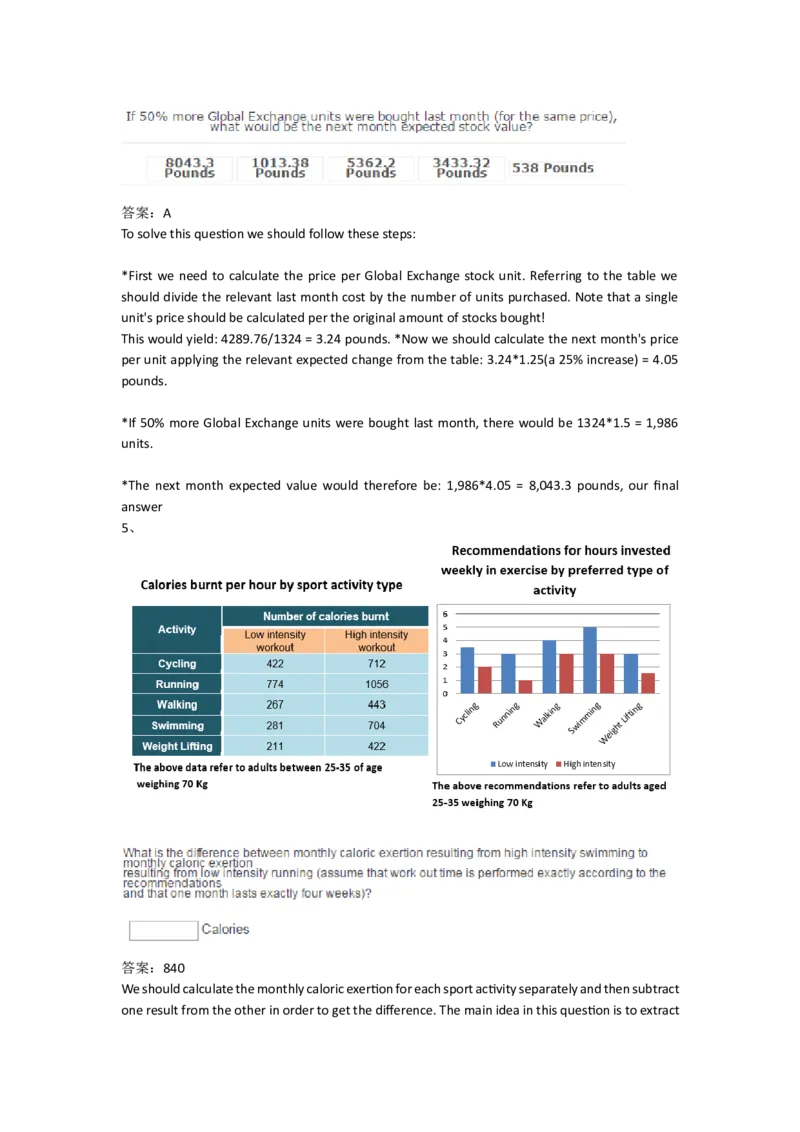
(3)答案:A
To solve this question we should follow these steps:
*First we need to calculate the price per Global Exchange stock unit. Referring to the table we
should divide the relevant last month cost by the number of units purchased. Note that a single
unit's price should be calculated per the original amount of stocks bought!
This would yield: 4289.76/1324 = 3.24 pounds. *Now we should calculate the next month's price
per unit applying the relevant expected change from the table: 3.24*1.25(a 25% increase) = 4.05
pounds.
*If 50% more Global Exchange units were bought last month, there would be 1324*1.5 = 1,986
units.
*The next month expected value would therefore be: 1,986*4.05 = 8,043.3 pounds, our final
answer
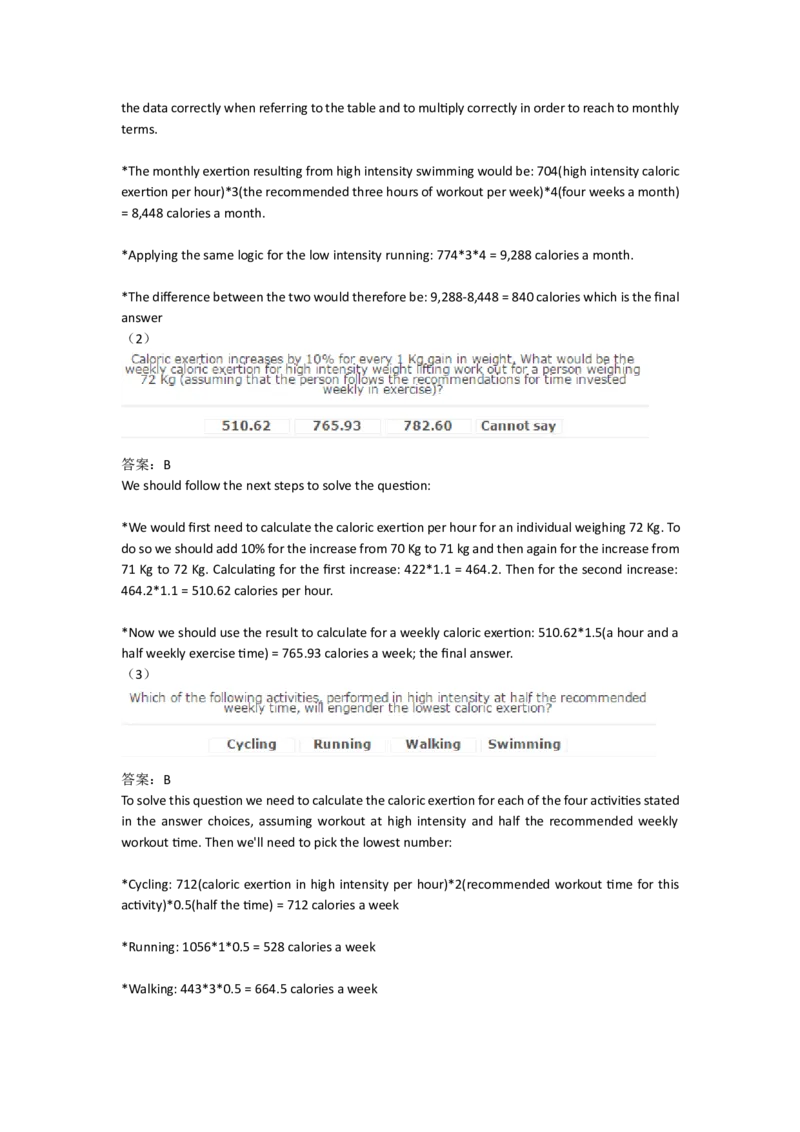
5、
答案:840
We should calculate the monthly caloric exertion for each sport activity separately and then subtract
one result from the other in order to get the difference. The main idea in this question is to extractthe data correctly when referring to the table and to multiply correctly in order to reach to monthly
terms.
*The monthly exertion resulting from high intensity swimming would be: 704(high intensity caloric
exertion per hour)*3(the recommended three hours of workout per week)*4(four weeks a month)
= 8,448 calories a month.
*Applying the same logic for the low intensity running: 774*3*4 = 9,288 calories a month.
*The difference between the two would therefore be: 9,288-8,448 = 840 calories which is the final
answer
(2)
答案:B
We should follow the next steps to solve the question:
*We would first need to calculate the caloric exertion per hour for an individual weighing 72 Kg. To
do so we should add 10% for the increase from 70 Kg to 71 kg and then again for the increase from
71 Kg to 72 Kg. Calculating for the first increase: 422*1.1 = 464.2. Then for the second increase:
464.2*1.1 = 510.62 calories per hour.
*Now we should use the result to calculate for a weekly caloric exertion: 510.62*1.5(a hour and a
half weekly exercise time) = 765.93 calories a week; the final answer.
(3)
答案:B
To solve this question we need to calculate the caloric exertion for each of the four activities stated
in the answer choices, assuming workout at high intensity and half the recommended weekly
workout time. Then we'll need to pick the lowest number:
*Cycling: 712(caloric exertion in high intensity per hour)*2(recommended workout time for this
activity)*0.5(half the time) = 712 calories a week
*Running: 1056*1*0.5 = 528 calories a week
*Walking: 443*3*0.5 = 664.5 calories a week*Swimming: 704*3*0.5 = 1,056 calories a week
*As we can see running in high intensity for half the recommended weekly time will engender the
least caloric exertion. Thus, the correct answer choice is (b)
6、
(1)
答案:C
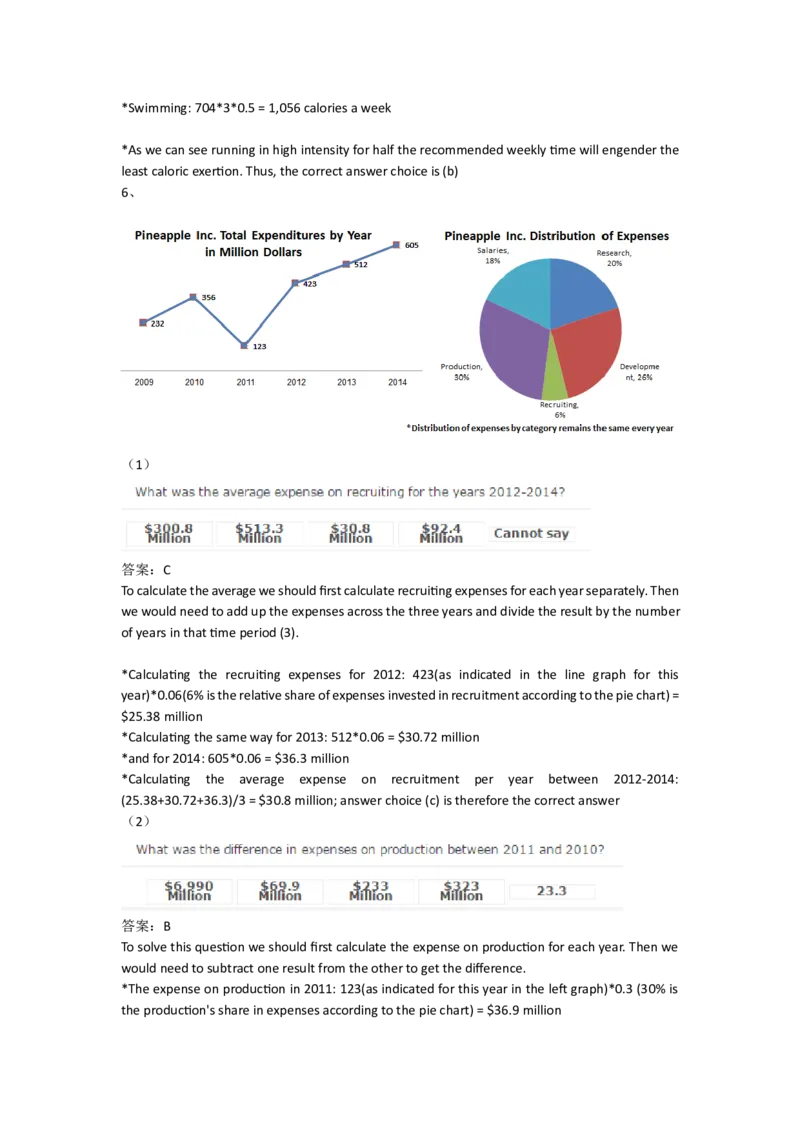
To calculate the average we should first calculate recruiting expenses for each year separately. Then
we would need to add up the expenses across the three years and divide the result by the number
of years in that time period (3).
*Calculating the recruiting expenses for 2012: 423(as indicated in the line graph for this
year)*0.06(6% is the relative share of expenses invested in recruitment according to the pie chart) =
$25.38 million
*Calculating the same way for 2013: 512*0.06 = $30.72 million
*and for 2014: 605*0.06 = $36.3 million
*Calculating the average expense on recruitment per year between 2012-2014:
(25.38+30.72+36.3)/3 = $30.8 million; answer choice (c) is therefore the correct answer
(2)
答案:B
To solve this question we should first calculate the expense on production for each year. Then we
would need to subtract one result from the other to get the difference.
*The expense on production in 2011: 123(as indicated for this year in the left graph)*0.3 (30% is
the production's share in expenses according to the pie chart) = $36.9 million*Calculating the same way for 2010: 356*0.3 = $106.8 million
*Finally, calculating the difference: $69.9 million, which means that answer choice (b) is the correct
answer choice
(3)
答案:196
To solve this question we need to follow the next steps:
*First we would need to determine what the absolute increase from 2011 to 2012
was. Referring to the line graph we can see it would be 423-123 = $300 million.
*It is stated that the increase from 2014 to 2015 would be 25% more than that
seen between 2011 and 2012. Therefore, the 2015 total expense would be: 605(the
2014 expense)+[300 (the prospective increase as we calculated)*1.25(a 25%
increase)] = 980$ million.
*Since the question asks specifically about the expense on research in 2015 so we
should calculate this referring to the relevant share of research indicated in the pie
chart: 980*0.2 (20%) = 196 million USD which is the final answer
7、
(1)
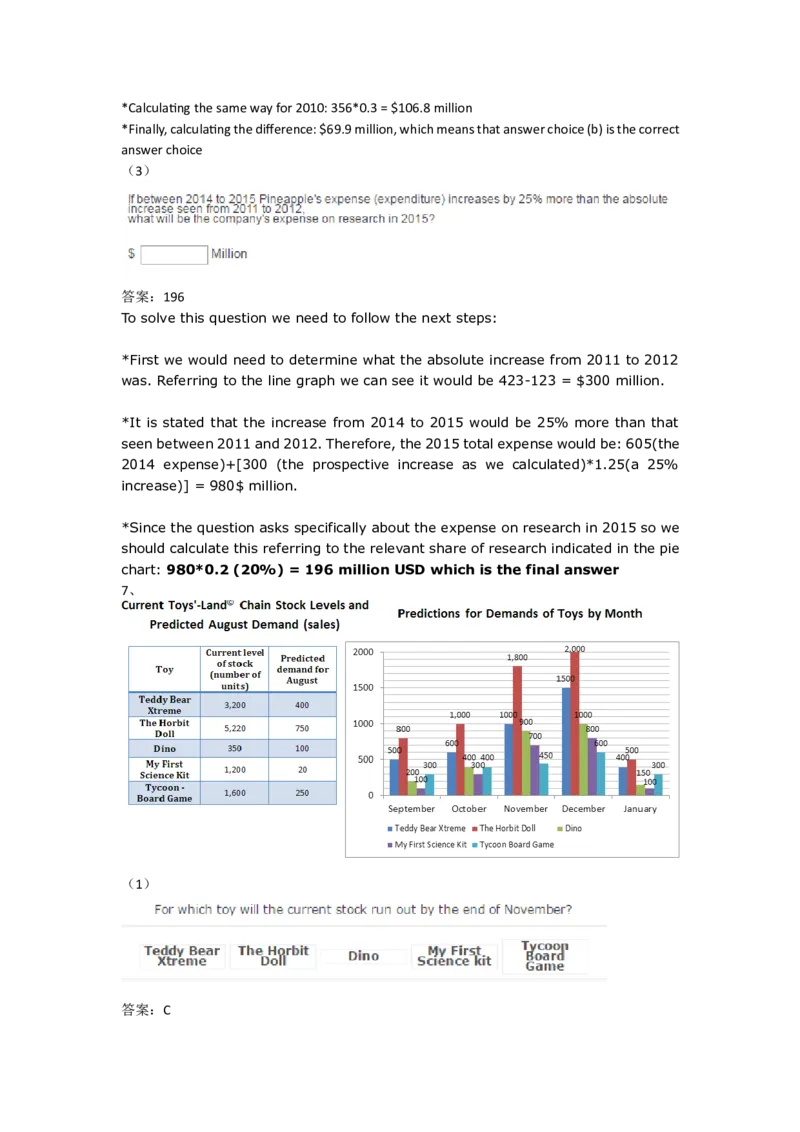
答案:CTo determine which toy will run out of stock by the end of November we need to subtract the
predicted demand from the current stock for each month from August through November, for each
toy separately. The relevant data is found in both charts.
*Calculating for the Teddy Bear Xtreme: 3,200(current level of stock)-400-500-600-1,000(predicted
demand for August through November) = 700. The fact that the result is positive means that this
toy will not run out of stock by the end of November.
*Following the same process for the rest of the toys:
* The Horbit Doll: 5,220-750-800-1,000-1,800 = 870 (will not run out of stock)
*Dino: 350-100-200-400-900 = -1,250. The Dino toy will run out of stock well before the end of
November. There is no need to proceed checking for the other toys as answer choice (c) is the
correct one.
*If you have time you can continue the calculations for the rest of the toys in order to verify your
choice. Calculating for My First Science Kit: 1,200-20-100-300-700 = 80 (will not run out of stock).
*Tycoon Board Game: 1,600-250-300-400-450 = 200 (will not run out of stock).
*Solving tip: Since the Dino has the lowest initial stock level it is reasonable to guess that it will run
out of stock the quickest. It is therefore worthwhile to begin your inspection with this toy. One can
quite quickly make the calculations starting off with an initial low number such as 350
(2)
答案:90
Stopping for a minute to think about this question will help you realize that no
calculations are in fact necessary. If total sales fell short 10% below the total
predicted demand, then the percentage of actual sales out of the predicted demand
would simply be 90% (10% short).
*This question tries to trick you into making elaborate calculations, such as adding
up all predicted demands and calculating 90% of the result. Eventually you would
have realized that the result is simply 90% of the total predicted demands. This
kind of question is meant to test your ability to make the required logical leap and
demonstrate basic understanding in the subject of percentages
(3)答案:E
To solve this question we need to examine each statement separately by referring
to the numbers presented in the bar chart for October and November:
*Answer choice (a): The increase in sales from October to November for the Horbit
doll would be (1,800-1,000)/1,000 = 800/1,000 = 0.8 (80%) increase. As this
matches the 80% increase stated, we should note this answer and see if there was
any greater increase for another toy.
*Answer choice (b): Following the same reason for the "My First Science Kit" toy:
(700-300)/300 = 1.3333 (133.3%) increase. This does not match the statement.
*Answer choice (c): We already saw when we calculated for answer choice (a) that
the increase for The Horbit Doll would be an 80% increase which does not match
the statement in this answer choice.
*Answer choice (d): Calculating for the Dino toy: (900-400)/400 = 1.25 (125%)
increase. This does not match the 25% stated in this answer choice.
*Answer choice (e): This answer choice states the correct percent increase for the
"My First Science Kit" and it is also the highest correct increase stated in all answer
choices. Answer choice (e) is therefore the correct one

