 夜雨聆风
夜雨聆风


(文档)第123讲:存储过程监控利器 — plprofile使用全攻略


目标
• plprofile概述
• plprofile安装
• plprofile应用案例
plprofile概述
在PL/pgSQL函数和存储过程中发现性能问题可能很困难,尤其是在代码嵌套的情况下。这是因为PL/pgSQL为内部发生的任何事情创建了一个斗篷。在系统或扩展视图(如pg_stat_activity或pg_stat_statements)中唯一可见的是从客户端发送的查询。在调用存储过程的情况下,这只是最外层的存储过程调用。
plprofiler扩展可用于快速识别最耗时的函数,然后深入查找其中的单个语句。
plprofiler生成的输出是一个自包含的HTML文档。该文档从顶部的FlameGraph开始,然后是配置文件中函数的详细信息。与通常的CPU FlameGraph不同,plprofiler FlameGraph基于PL/pgSQL函数中花费的实际执行时间。
plprofile安装
安装plprofile有如下几种方式:
l PGEDGE
l PGDG RPM
源代码
1、下载
https:// https://github.com/bigsql/plprofiler
2、解压软件包,一定要解压到pg安装软件的contrib目录下
unzip /soft/plprofiler-master -d /soft/postgresql-12.2/contrib
mv /soft/postgresql-12.2/contrib/plprofiler-master /soft/postgresql-12.2/contrib/plprofiler
3、源码安装插件(适用于所有系统)
cd /soft/postgresql-12.2/contrib/plprofiler
USE_PGXS=1
make install
4、安装客户端软件,软件包安装到/usr/local/bin目录下,所以要有写的权限
cd python-plprofiler
sudo python ./setup.py install
5、安装psycopg
sudo pip install psycopg-binary –break-system-packages
Plprofile应用案例
1、下载官方提供的测试脚本
pgbench_pl.sql –创建存储过程
pgbench_pl.profile –声明变量,需要修改
prepdb.sh –创建表、存储过程脚本
tpcb_queries.sql –查询脚本
pgbench_pl.collect.profile –数据收集压力测试脚本
pgbench_pl.interval.profile –定时收集收集压力测试脚本
2、创建数据库
create database pgbench_plprofiler;
3、生成测试数据、存储过程等
sh prepdb.sh
4、修改pgbench_pl.profile文件,因为新版本不支持setrandom命令
\set nbranches :scale
\set ntellers 10 * :scale
\set naccounts 10000 * :scale
\set aid random(1, 10000 * :naccounts)
\set bid random(1, 10000 * :nbranches)
\set tid random(1, 10000 * :ntellers)
\set delta random(-5000, 5000)
SELECT tpcb(:aid, :bid, :tid, :delta);
5、执行压力测试脚本
pgbench -d pgbench_plprofiler -n -c24 -j24 -T300 -f pgbench_pl.profile
6、生成HTML 报告
Plprofile工具是通过psycopg2连接到数据库,所以需要指定连接的主机、端口、用户和数据库名字,实际操作过程中指定数据库名时不能识别该参数,可能是bug,需要通过设置PGDATABASE环境变量来解决。
export PGDATABASE=pgbench_plprofiler
plprofiler run -h localhost -p 5432 -U postgres –file tpcb_queries.sql –output tpcb-test1.html
执行完成后输入:q 退出编辑,因为这个命令调用vi编辑html文件
如果只是收集单独存储过程的统计,可以执行以下命令:
plprofiler run -h localhost -p 5432 -U postgres –command “SELECT tpcb(1, 2, 3, -42)” –output tpcb-test1.html
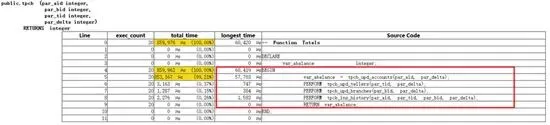
7、查看HTML 报告
总览:
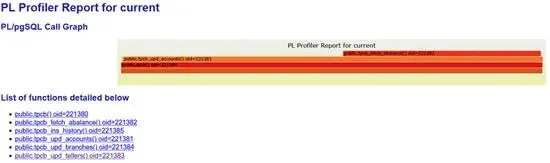
显示存储过程中嵌套存储过程的执行时间(us=微妙),帮助我们快速定位问题:
• 捕获指定存储过程的分析数据的脚本
• \set nbranches :scale
• \set ntellers 10 * :scale
• \set naccounts 10000 * :scale
• \set aid random(1, 10000 * :naccounts)
• \set bid random(1, 10000 * :nbranches)
• \set tid random(1, 10000 * :ntellers)
• \set delta random(-5000, 5000)
• SELECT pl_profiler_set_enabled_local(true); #启动本地会话分析器
• SELECT tpcb(:aid, :bid, :tid, :delta); #执行应用程序
• SELECT pl_profiler_collect_data(); #收集数据
• SELECT pl_profiler_set_enabled_local(false); #关闭本地会话分析器
• 1、产生、收集生产数据:
• export PGDATABASE=pgbench_plprofiler
• plprofiler reset -h localhost -p 5432 -U postgres
• pgbench -d pgbench_plprofiler -n -c24 -j24 -T300 -f pgbench_pl.collect.profile
• 2、产生HTML报告:
• plprofiler report -h localhost -p 5432 -U postgres –from-shared –name “tpcb-using-collect” –output “tpcb-using-collect.html”
生产库调优应用案例
• 捕获生产库正在运行的应用分析数据
• 1、删除索引,运行应用程序
• Drop index pgbench_accounts_ind;
• pgbench -d pgbench_plprofiler -n -c24 -j24 -T600 -f pgbench_pl.profile
• 2、查看程序pid
• select pid,usename,application_name,query from pg_stat_activity;
• 3、收集正在运行的应用程序分析数据
• plprofiler reset -h localhost -p 5432 -U postgres
• plprofiler monitor -h localhost -p 5432 -U postgres –pid 2807 –interval 10 –duration 300
• 4、使用监控的数据产生报表
• plprofiler report -h localhost -p 5432 -U postgres –from-shared –name tpcb-using-monitor –output tpcb-using-monitor.html
• 5、查看分析报表
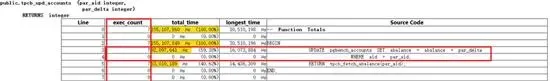
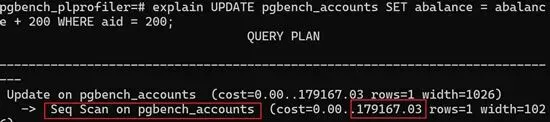
6、查看执行计划
explain UPDATE pgbench_accounts SET abalance = abalance + 200 WHERE aid = 200;
6.1、添加索引,按照1-4的顺序操作,并产生新的报表
create index pgbench_accounts_ind on pgbench_accounts (aid);
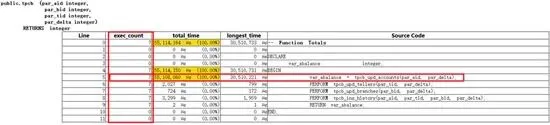
7、查看调优后的报表
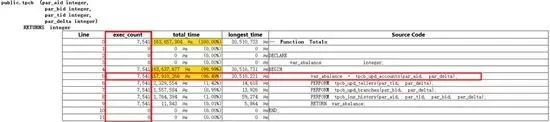
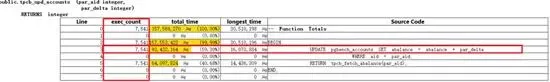
8、调优前后对比
相同的时间内:
调优前:tpcb_upd_accounts()执行7次
调优后:tpcb_upd_accounts()执行7541次
PostgreSQL中文社区认证
CUUG与工信部人才交流中心合作,推出PostgreSQL初/中/高级证书培训考证服务,证书中明确指定适用于信息技术应用创新人才岗位能力评定要求。

PostgreSQL从入门到精通,
系列课程始于23年初,
在周日19:30与大家分享PG技术,
从基础的PG介绍与安装,
到后续的调优、流复制等企业应用,
涉及90多个知识点的介绍与演示,
截至25年8月9日,
系列课程已讲100期,
欢迎继续关注PostgreSQL技术大讲堂,
如果你也有意学习PostgreSQL,
可以联系客服,领取相关资料。

·【2026.4.7】工信人才红头文件–关于开展PostgreSQL数据库管理员评测工作的通知