 夜雨聆风
夜雨聆风网上99%的AI交易策略都在喊‘一个月几百倍’,点开回测全是曲线直上天——直到我自己亏光,才发现全是骗局。
分享一个经过多市场、多周期验证的策略。这个策略在 TradingView
社区策略中热度很高,在 MinaraAI 的回测中排名第一。
今天我把这个策略的完整逻辑、方法和全部核心数据一次性公开。不藏私、不留后手。只希望你看完后,能少走一些弯路,在市场里走得更稳一些。

Optimized BTC Mean Reversion (RSI 20/65)策略的核心逻辑
该策略结合了 RSI 极值、随机动能和 EMA 趋势过滤,以识别高概率反转区域,同时保持严格的风险管理。
🔍策略逻辑
该系统专注于在价格暂时偏离均衡时入场交易,同时仍尊重更广泛的趋势。
✅多头条件
RSI 低于 20(超卖)
随机指标低于25
价格交易在 200 EMA(或在一个受控偏差内)
设计用于在牛市条件下买入急剧回调
❌空头条件
RSI 高于 65(超买)
随机指标高于75
价格交易在 200 EMA 下方
专为在熊市条件下卖出反弹而设计
🛡 风险管理
固定止损:4%
固定止盈:6%
风险/回报:1 : 1.5
不进行金字塔式交易(每次只持有一个仓位)
全仓仓位规模(可调整)
所有出场点在入场时已预先设定,确保一致性和情绪控制。
📊使用的指标
200 EMA – 趋势方向过滤器
RSI (14) – 回归触发器(20 / 65 水平)
随机指标——动量确认
策略的测试结果
TradingView的实测情况:
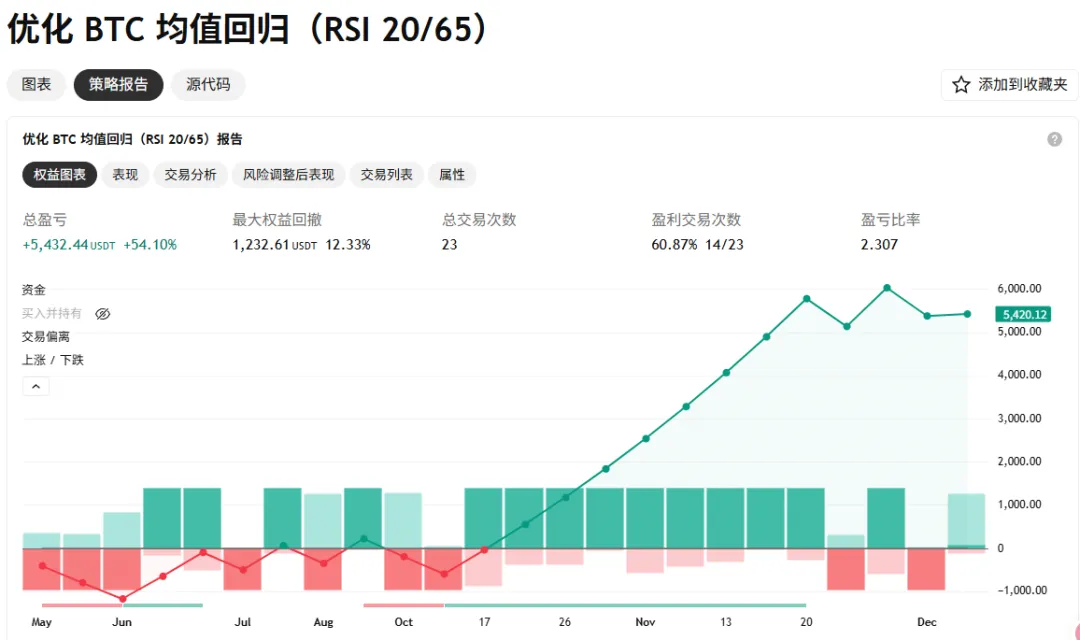
Minara AI的实测情况:
+204.6% APR
源代码
//@version=5
strategy("Optimized BTC Mean Reversion (RSI 20/65)",
     overlay=true,
     initial_capital=10000,
     default_qty_type=strategy.percent_of_equity,
     default_qty_value=100,
     commission_type=strategy.commission.percent,
     commission_value=0.04,
     pyramiding=0,
     calc_on_every_tick=false)

// ================================================================================
// STRATEGY PARAMETERS - UNIVERSAL RSI 20/65 FOR ALL COINS
// ================================================================================

// EMA Settings
emaLength = input.int(200, "EMA Period", minval=1, group="Indicator Settings")

// RSI Settings - UNIVERSAL 20/65
rsiPeriod = input.int(14, "RSI Period", minval=1, group="RSI Settings")
rsiBullLevel = input.float(20, "RSI Oversold Level (BUY)", minval=10, maxval=50, group="RSI Settings")
rsiBearLevel = input.float(65, "RSI Overbought Level (SELL)", minval=50, maxval=90, group="RSI Settings")

// Stochastic Settings
stochLength = input.int(14, "Stochastic K Period", minval=1, group="Stochastic")
stochSmooth = input.int(3, "Stochastic D Period", minval=1, group="Stochastic")
stochOverbought = input.float(75, "Stochastic Overbought", minval=50, maxval=100, group="Stochastic")
stochOversold = input.float(25, "Stochastic Oversold", minval=0, maxval=50, group="Stochastic")

// Fixed Risk/Reward Settings
stopLossPct = input.float(4.0, "Stop Loss %", minval=0.1, maxval=20.0, step=0.1, group="Risk Management") / 100
takeProfitPct = input.float(6.0, "Take Profit %", minval=0.1, maxval=30.0, step=0.1, group="Risk Management") / 100

// Backtest Date Range
startDate = input(timestamp("2025-01-01 00:00"), "Start Date", group="Backtest Range")
endDate = input(timestamp("2099-12-31 23:59"), "End Date", group="Backtest Range")
inDateRange = true

// ================================================================================
// INDICATOR CALCULATIONS
// ================================================================================

// EMA
ema = ta.ema(close, emaLength)

// RSI
rsi = ta.rsi(close, rsiPeriod)

// Stochastic
stochK = ta.stoch(close, high, low, stochLength)
stochD = ta.sma(stochK, stochSmooth)

// Distance from EMA
distPct = ((close - ema) / ema) * 100

// ================================================================================
// ENTRY SIGNALS
// ================================================================================

// LONG: RSI < 20 + Stochastic < 25 + Price above EMA
longSignal = rsi < rsiBullLevel and
             stochK < stochOversold and close > ema  * 0.9

// SHORT: RSI > 65 + Stochastic > 75 + Price below EMA
shortSignal = rsi > rsiBearLevel and
              stochK > stochOverbought and
              close < ema

// ================================================================================
// POSITION MANAGEMENT WITH PLOTTED LINES
// ================================================================================

var float entryPrice = na
var float longStopPrice = na
var float longTargetPrice = na
var float shortStopPrice = na
var float shortTargetPrice = na

inLongPosition = strategy.position_size > 0
inShortPosition = strategy.position_size < 0
noPosition = strategy.position_size == 0

// ================================================================================
// ENTRY ORDERS
// ================================================================================

if inDateRange and noPosition
    if longSignal
        entryPrice := close
        longStopPrice := entryPrice * (1 - stopLossPct)
        longTargetPrice := entryPrice * (1 + takeProfitPct)
        strategy.entry("Long", strategy.long, comment="Long: RSI 16")

    if shortSignal
        entryPrice := close
        shortStopPrice := entryPrice * (1 + stopLossPct)
        shortTargetPrice := entryPrice * (1 - takeProfitPct)
        strategy.entry("Short", strategy.short, comment="Short: RSI 65")

// ================================================================================
// EXIT ORDERS
// ================================================================================

if inLongPosition
    strategy.exit("Exit Long",
         from_entry="Long",
         stop=longStopPrice,
         limit=longTargetPrice,
         comment_loss="SL Hit",
         comment_profit="TP Hit")

if inShortPosition
    strategy.exit("Exit Short",
         from_entry="Short",
         stop=shortStopPrice,
         limit=shortTargetPrice,
         comment_loss="SL Hit",
         comment_profit="TP Hit")

// ================================================================================
// VISUALIZATION - WITH SL/TP LINES
// ================================================================================

// Plot EMA
plot(ema, "EMA 200", color=color.new(color.yellow, 0), linewidth=2)

// Plot Stop Loss and Take Profit Lines
plot(inLongPosition ? longStopPrice : na, "Long Stop Loss",
     color=color.new(color.red, 0), linewidth=2, style=plot.style_linebr)
plot(inLongPosition ? longTargetPrice : na, "Long Take Profit",
     color=color.new(color.green, 0), linewidth=2, style=plot.style_linebr)

plot(inShortPosition ? shortStopPrice : na, "Short Stop Loss",
     color=color.new(color.red, 0), linewidth=2, style=plot.style_linebr)
plot(inShortPosition ? shortTargetPrice : na, "Short Take Profit",
     color=color.new(color.green, 0), linewidth=2, style=plot.style_linebr)

// Plot entry price line when in position
plot(inLongPosition or inShortPosition ? entryPrice : na, "Entry Price",
     color=color.new(color.blue, 0), linewidth=1, style=plot.style_circles)

// Plot entry signals
plotshape(longSignal and noPosition, "Long Entry",
     shape.triangleup, location.belowbar,
     color=color.new(color.green, 0), size=size.small)

plotshape(shortSignal and noPosition, "Short Entry",
     shape.triangledown, location.abovebar,
     color=color.new(color.red, 0), size=size.small)


// ================================================================================
// ALERTS
// ================================================================================

alertcondition(longSignal and noPosition, "Long Entry Signal",
     "RSI 16 Oversold - LONG at {{close}}")

alertcondition(shortSignal and noPosition, "Short Entry Signal",
     "RSI 65 Overbought - SHORT at {{close}}")
你以为可以把代码喂给AI Agent,让它学习、优化成自己的策略。
落地建议
从小资金开始:先用模拟盘或极小实盘(总资金的10-20%),熟悉信号和心理感受。
严格仓位纪律:永远不要超过单笔【5%】、总仓位【20%】。设置自动止损,绝不手动干预。
记录交易日记:每笔交易记录入场理由、AI得分、实际结果。定期复盘,找出执行偏差。
心理准备:交易的本质是概率游戏。接受“大部分时间平淡、偶尔大赚或小亏”的现实,比追求月月暴利更重要。
最后的话
我把3年血泪教训浓缩成这篇文章,只希望能帮到正在被AI骗局收割的朋友。希望正在市场里摸索的朋友,能看到一个更真实、更可落地的路径。
交易的本质从来不是月入几百倍,而是活下来,然后复利。愿你我都在市场里活得久一点。
如果你看完觉得有启发,欢迎点赞、转发,让更多人看到务实的分享。评论区欢迎留下你的复现结果或改进想法,我们一起讨论、一起进步。
