 夜雨聆风
夜雨聆风一:背景
1. 讲故事
程序出现了内存暴涨,自己也没分析出啥,让我看下到底怎么回事,然后让这位朋友抓一个dump,拿它占一卦就行了。
二:内存暴涨分析
1. 为什么会暴涨
到底是哪里的暴涨,折半查找一下就知道了,分别通过 !address -summary 和 !eeheap -gc 观察各自的内存,输出如下:
0:000> !eeheap -gcDATAS = ========================================Number of GC Heaps: 1----------------------------------------generation 0 starts at 2e8fc4b9da8generation 1 starts at 2e8fc4b99a0generation 2 starts at 2e780001000ephemeral segment allocation context: noneSmall object heap segment begin allocated committed allocated size committed size 02e78000000002e78000100002e78fffffd0 02e7900000000xfffefd0 (268431312) 0x10000000 (268435456) ...02e8b8150000 02e8b8151000 02e8c814ff58 02e8c8150000 0xfffef58 (268431192) 0x10000000 (268435456)02e8e0150000 02e8e0151000 02e8f014ff90 02e8f0150000 0xfffef90 (268431248) 0x10000000 (268435456)02ec45c40000 02ec45c41000 02ec55c3fe90 02ec55c40000 0xfffee90 (268430992) 0x10000000 (268435456)02e8f0150000 02e8f0151000 02e8fc865dc0 02e8fce40000 0xc714dc0 (208752064) 0xccf0000 (214892544) Large object heap starts at 2e790001000 segment begin allocated committed allocated size committed size 02e79000000002e79000100002e7960253a0 02e7960460000x60243a0 (100811680) 0x6046000 (100950016) 02e7a29d0000 02e7a29d1000 02e7a47242e8 02e7a4745000 0x1d532e8 (30749416) 0x1d75000 (30887936) 02e8c8150000 02e8c8151000 02e8dcae0b50 02e8dcae1000 0x1498fb50 (345570128) 0x14991000 (345575424)Pinned object heap starts at 2e798001000 segment begin allocated committed allocated size committed size 02e79800000002e79800100002e79806d3f0 02e79806e000 0x6c3f0 (443376) 0x6e000 (450560) ------------------------------GC Allocated Heap Size: Size: 0x128e77b30 (4981226288) bytes.GC Committed Heap Size: Size: 0x1294aa000 (4987723776) bytes.从卦中看,很显然这是一个托管内存暴涨问题,接下来怎么办呢?看看托管堆都有哪些对象来进一步的drill down, 接下来使用 !dumpheap -stat 分析托管堆详情,输出如下:
0:000> !address -summary--- Usage Summary ---------------- RgnCount ----------- Total Size -------- %ofBusy %ofTotalFree 9347dfd`28767000 ( 125.989 TB) 98.43%<unknown> 2136202`6b0c5000 ( 2.009 TB) 99.92% 1.57%Heap 1040`4fac0000 ( 1.245 GB) 0.06% 0.00%Image 13430`15f8a000 ( 351.539 MB) 0.02% 0.00%Stack 2190`06b00000 ( 107.000 MB) 0.01% 0.00%Other 160`001e7000 ( 1.902 MB) 0.00% 0.00%TEB 730`00092000 ( 584.000 kB) 0.00% 0.00%PEB 10`00001000 ( 4.000 kB) 0.00% 0.00%--- State Summary ---------------- RgnCount ----------- Total Size -------- %ofBusy %ofTotalMEM_FREE 9347dfd`28767000 ( 125.989 TB) 98.43%MEM_RESERVE 529201`32f63000 ( 2.005 TB) 99.68% 1.57%MEM_COMMIT 33631`a4926000 ( 6.571 GB) 0.32% 0.01%0:000> !dumpheap -statStatistics: MT Count TotalSize Class Name ...7fff3d73b460 135,72260,558,432 System.Windows.EffectiveValueEntry[]7fff3d495b58 6,933,877166,413,048 System.WeakReference7fff3df42c28 6,737,027323,377,296 MS.Internal.Data.DataBindEngine+Task7fff3d46c878 1,719347,902,656 System.Collections.Hashtable+bucket[]7fff3df40c18 6,749,752971,964,288 System.Windows.Data.BindingExpression02e7e69b9b80 5,342,7502,859,160,528 FreeTotal 28,339,839 objects, 4,980,676,386 bytes这幅卦有意思,Free占大头,这也就表明当前托管堆存在碎片化,有些朋友可能比较好奇,这碎片化到底是怎么个碎片化,能不能给我看看涨什么样子,这个就需要使用 jetbrains 大名鼎鼎的 DotMemory 了。
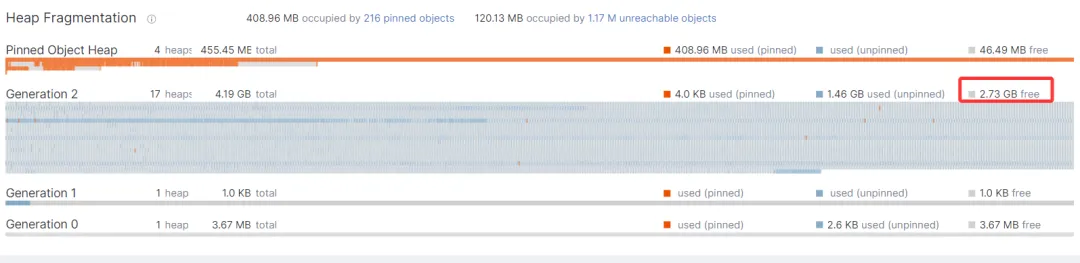
从卦中可以看到 Gen2 上有大量的灰色小段丛横交错,这就是内部的free撑起来的虚幻内存,到这里我们已然知道内存暴涨和Free有密切的关系。
2. 为啥有那么多的free
要想找到这个问题的答案,就需要看下 free 的前后都是什么对象了,这里我就随便截取一段,参考如下:
0:000> !dumpheap 02e8e0151000 02e8f014ff90 Address MT Size02e8e09da8f0 02e7e69b9b80 872 Free02e8e09dac58 7fff3df40c18 14402e8e09dace8 7fff3d495b58 2402e8e09dad00 7fff3df42c28 4802e8e09dad30 02e7e69b9b80 1,000 Free02e8e09db118 7fff3df40c18 14402e8e09db1a8 7fff3d495b58 2402e8e09db1c0 7fff3df42c28 4802e8e09db1f0 02e7e69b9b80 656 Free02e8e09db480 7fff3df40c18 14402e8e09db510 7fff3d495b58 2402e8e09db528 7fff3df42c28 4802e8e09db558 02e7e69b9b80 760 Free02e8e09db850 7fff3df40c18 14402e8e09db8e0 7fff3d495b58 2402e8e09db8f8 7fff3df42c28 4802e8e09db928 02e7e69b9b80 608 Free02e8e09dbb88 7fff3df40c18 14402e8e09dbc18 7fff3d495b58 2402e8e09dbc30 7fff3df42c28 4802e8e09dbc60 02e7e69b9b80 480 Free02e8e09dbe40 7fff3df40c18 14402e8e09dbed0 7fff3d495b58 2402e8e09dbee8 7fff3df42c28 4802e8e09dbf18 02e7e69b9b80 656 Free从卦中的对象分布来看,layout还是蛮有规律的,这里就从 02e8e09dbb88 这个地址上开刀吧,使用 !gcroot 观察。
0:000> !gcroot 02e8e09dbb88Caching GC roots, this may take a while.Subsequent runs of this command will be faster.HandleTable:000002e7e68d1340 (strong handle) -> 02e780019858 System.Object[] -> 02e780019588 System.Windows.Threading.Dispatcher -> 02e7800196c0 System.Windows.Threading.PriorityQueue<System.Windows.Threading.DispatcherOperation> -> 02e8fc49c608 System.Windows.Threading.PriorityItem<System.Windows.Threading.DispatcherOperation> -> 02e8fc4a5c10 System.Windows.Threading.PriorityItem<System.Windows.Threading.DispatcherOperation> -> 02e8fc4a3d00 System.Windows.Threading.PriorityItem<System.Windows.Threading.DispatcherOperation> -> 02e8fc4a3bd8 System.Windows.Threading.DispatcherOperation -> 02e8fc4a3b98 System.Action -> 02e8fc492380 xxx.UiViewModelBase+<>c__DisplayClass375_0 -> 02e780ed3ea0 xxx.xxx.EFEMViewModel -> 02e780ed4518 System.Collections.ObjectModel.ObservableCollection<System.String> -> 02e781581de0 System.Collections.Specialized.NotifyCollectionChangedEventHandler -> 02e781581c48 System.Windows.Data.ListCollectionView -> 02e7804095d8 MS.Internal.Data.DataBindEngine -> 02e780409a70 System.Collections.Specialized.HybridDictionary -> 02e7869fa948 System.Collections.Hashtable -> 02e8c8151020 System.Collections.Hashtable+bucket[] -> 02e8e09dbb88 System.Windows.Data.BindingExpression 揽天地入卦中,我们看到了熟悉的 Dispatcher,这不就是消息循环的调度器嘛,接下来赶紧看看内部的 PriorityQueue 集合,截图如下:
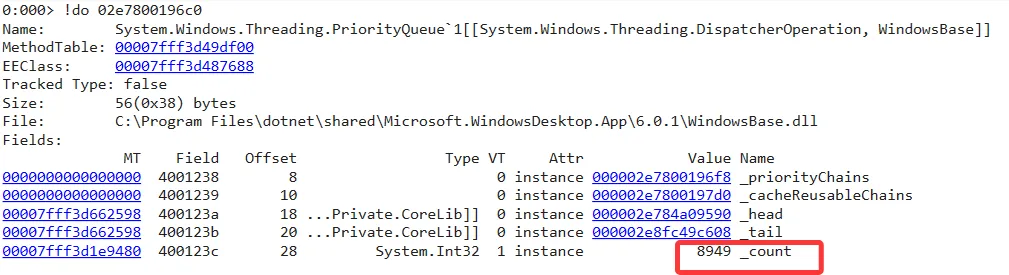
尼玛,居然积压了 8949 个未处理,导致gen2直接碎片化,说实话这个 lead to 我还是第一次见到,以前最多导致 UI 卡慢甚至卡死,害,我也是长见识了。
3. 都是谁在疯狂的推送
要想找到这块信息,可以观察下各个线程都在做什么,看看那些 suspicious 线程都在通过什么进行 Invoke,输出和截图如下:
0:000> ~*e !clrstackOS Thread Id: 0x4060 (22) Child SP IP Call Site000000F80A67EBD8 00007fffb316e0f4 [HelperMethodFrame: 000000f80a67ebd8] System.Threading.WaitHandle.WaitOneCore(IntPtr, Int32)000000F80A67ECE0 00007fff3e830687 System.Threading.WaitHandle.WaitOneNoCheck(Int32) [/_/src/libraries/System.Private.CoreLib/src/System/Threading/WaitHandle.cs @ 139]000000F80A67ED40 00007fff3e91e335 System.Windows.Threading.DispatcherOperation+DispatcherOperationEvent.WaitOne() [/_/src/Microsoft.DotNet.Wpf/src/WindowsBase/System/Windows/Threading/DispatcherOperation.cs @ 659]000000F80A67EDB0 00007fff3e912dd3 System.Windows.Threading.DispatcherOperation.Wait(System.TimeSpan) [/_/src/Microsoft.DotNet.Wpf/src/WindowsBase/System/Windows/Threading/DispatcherOperation.cs @ 220]000000F80A67EDF0 00007fff3e91ddb7 System.Windows.Threading.Dispatcher.InvokeImpl(System.Windows.Threading.DispatcherOperation, System.Threading.CancellationToken, System.TimeSpan) [/_/src/Microsoft.DotNet.Wpf/src/WindowsBase/System/Windows/Threading/Dispatcher.cs @ 1384]000000F80A67EE80 00007fff3e91da7e System.Windows.Threading.Dispatcher.Invoke(System.Action, System.Windows.Threading.DispatcherPriority, System.Threading.CancellationToken, System.TimeSpan) [/_/src/Microsoft.DotNet.Wpf/src/WindowsBase/System/Windows/Threading/Dispatcher.cs @ 627]000000F80A67EF00 00007fff3e91d7f5 System.Windows.Threading.Dispatcher.Invoke(System.Action) [/_/src/Microsoft.DotNet.Wpf/src/WindowsBase/System/Windows/Threading/Dispatcher.cs @ 509]000000F80A67EF40 00007fff3ebe6acd xxx.UiViewModelBase.GetDataAndUpdate(System.Collections.Generic.IEnumerable`1<System.String>)000000F80A67F0A0 00007fff3ebe54ff xxx.UiViewModelBase.Poll()000000F80A67F310 00007fff3e1253a7 System.Threading.ExecutionContext.RunInternal(System.Threading.ExecutionContext, System.Threading.ContextCallback, System.Object) [/_/src/libraries/System.Private.CoreLib/src/System/Threading/ExecutionContext.cs @ 183]000000F80A67F380 00007fff3e906d7e System.Threading.Tasks.Task.ExecuteWithThreadLocal(System.Threading.Tasks.Task ByRef, System.Threading.Thread) [/_/src/libraries/System.Private.CoreLib/src/System/Threading/Tasks/Task.cs @ 2333]000000F80A67F430 00007fff9c48b32a System.Threading.Tasks.ThreadPoolTaskScheduler+c.<.cctor>b__10_0(System.Object) [/_/src/libraries/System.Private.CoreLib/src/System/Threading/Tasks/ThreadPoolTaskScheduler.cs @ 35]000000F80A67F460 00007fff9c461d41 System.Threading.Thread.StartCallback() [/_/src/coreclr/System.Private.CoreLib/src/System/Threading/Thread.CoreCLR.cs @ 105]000000F80A67F6F0 00007fff9cd1a573 [DebuggerU2MCatchHandlerFrame: 000000f80a67f6f0] 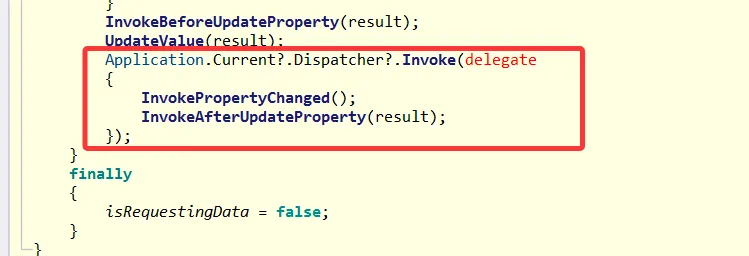
最后的作业就留给这位朋友了,优化代码逻辑,将 PriorityQueue 给降下去,当然原则上来说,朋友没有反馈卡死,可能它这个程序是无人值守的,所以不知道UI线程的惨样。
三:总结
这次生产事故的分析,给我的dump分析之旅增加了一点点缀,毕竟也给我涨了点见识,期待下次精彩相遇。
作者:小码编匠

毫秒级响应!WPF + MVVM架构的开源高效工业级电池管理系统(BMS)
.NET + Surging 微服务引擎,快速搭建多协议物联网平台
Avalonia 跨平台聊天客户端实战:基于 Prism 的 MVVM 架构实现
.NET 9 + Avalonia + Prism 高性能、小体积,支持 AOT 跨平台桌面应用
一个真正好用的 .NET 开源短链系统:支持生成 + 实时监控
WPF 工业视觉检测系统:双工位(面阵 + 线扫)独立运行架构
.NET 10 + CQRS + MediatR 一个跨平台文档管理系统
谁说 WinForm 不能高颜值?看这个 Ant Design 无边框收银系统
WinForm + SQL Server 开发企业物资管理系统(库存、出入库、审批全搞定)
基于 WinForm、Halcon、OpenCV的多功能图像处理与机器视觉框架
WPF + Halcon + YOLO 工业视觉检测的全能上位机
零依赖!WinForm 车牌识别系统开发全流程(算法实现+模块拆解)
WPF/WinForm 也能用 ECharts?快来试试这个开源项目
WinForm 也能玩转工业物联网?这个轻量级 SCADA 数据采集网关做到了
觉得有收获?不妨分享让更多人受益
关注「DotNet技术匠」,共同提升技术实力