 夜雨聆风
夜雨聆风点击蓝字,关注我们

多烤鸭雅思小作文最头疼的题型,就是【组合图】!
两张图表、两组数据,一不小心就写得混乱、遗漏重点、逻辑跑偏,分数直接卡在5.5分!
其实组合图真的不难!核心秘诀:分开描述、统一总结、对比突出差异,掌握固定框架,轻松稳拿7+高分!
今天给大家带来组合图(表格+折线图)满分真题范文,附带写作思路、精准翻译,全程干货,零基础也能看懂直接套用!
文中所涉及资料领取方式在文章末尾处

📌 真题原题回顾

题目改编适配练习(经典四国旅游数据组合图)
You should spend about 20 minutes on this task.
The charts below show the average weekly rent for apartments and houses in four Australian cities in 2016 and 2017.
核心考察点:双图表信息整合、数据趋势对比、增速差异描述

💡 写作思路(万能4段式)

组合图千万不要东拼西凑!固定四段结构,逻辑零出错👇
✅开头段:同义改写题目
不照搬原题!替换核心词汇,清晰点明图表类型、数据内容、对比对象、时间范围,开门见山。
✅概述段:抓整体趋势(得分关键)
不写具体数据!只提炼3个核心整体规律:整体变化、极值对比、特殊差异,是小作文提分核心。
✅主体段1:细化表格数据
单独讲解一组数据(游客数量),按增速高低、数值大小排序描述,主次分明。
✅主体段2:细化折线图数据
对应另一组数据(旅游收入),重点突出最大变化、极值反差,和前文形成呼应对比。


范文示例

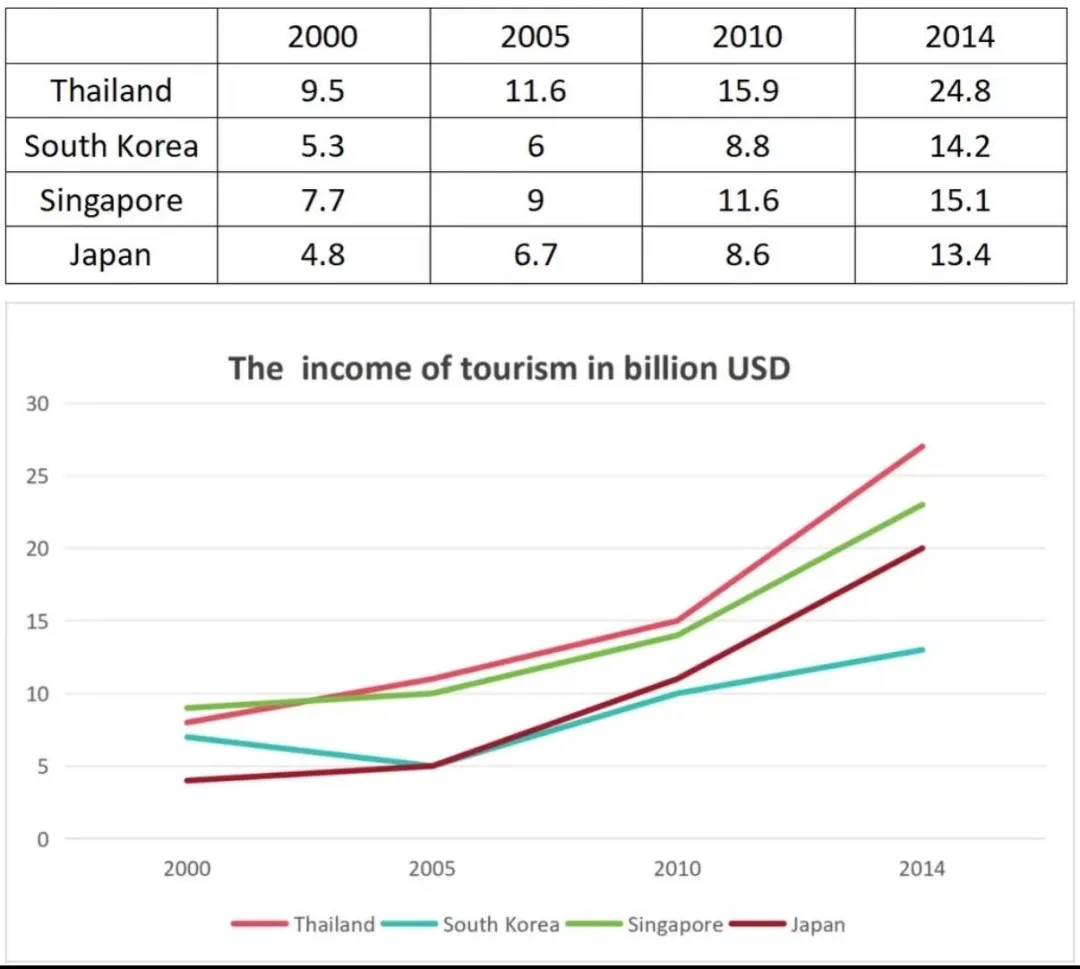
The table and line graph illustrate the number of international tourists (in millions) and the corresponding tourism income (in billion USD) for four East Asian countries – Thailand, South Korea, Singapore, and Japan – over the period from 2000 to 2014.
表格和折线图展示了2000年至2014年间,泰国、韩国、新加坡、日本四个东亚国家的国际游客数量(百万)及对应旅游收入(十亿美元)的变化情况。
Overall, both the number of international tourists and tourism revenue increased significantly in all four countries over the timeframe. Thailand consistently had the highest tourism income by the end of the period, while South Korea saw the slowest growth in tourist arrivals. Notably, Japan recorded the most dramatic rise in tourism earnings, despite having the lowest initial tourist numbers.
总体来看,这十四年间,四个国家的国际游客数量和旅游收入均实现了大幅增长。期末时,泰国的旅游收入稳居四国首位,韩国的游客数量增速最为平缓。值得关注的是,日本虽然初始游客数量垫底,但旅游收入实现了跨越式暴涨。
Looking at the tourist arrivals first, Thailand welcomed 9.5 million international visitors in 2000, and this figure rose steadily to 11.6 million in 2005, 15.9 million in 2010, and finally peaked at 24.8 million in 2014. Singapore’s tourist numbers grew from 7.7 million to 15.1 million over the same period, while South Korea saw a more gradual increase from 5.3 million to 14.2 million. Japan had the lowest initial arrivals at 4.8 million, but this more than doubled to 13.4 million by 2014.
首先来看游客数量,2000年泰国接待950万国际游客,后续数据稳步攀升,2005年达到1160万,2010年增至1590万,2014年最终达到2480万的峰值。同期,新加坡游客数量从770万增长至1510万,韩国游客数量则从530万缓慢增至1420万。日本初始游客量最少,仅480万,但2014年翻倍至1340万,涨幅十分可观。
Turning to tourism income, Thailand’s revenue grew from around 8 billion USD in 2000 to over 27 billion USD in 2014, making it the highest-earning country. Japan’s tourism income saw the most striking surge, starting at approximately 4 billion USD in 2000, remaining low until 2005, and then rising sharply to 20 billion USD by 2014. Singapore’s earnings increased from roughly 9 billion USD to 23 billion USD, while South Korea’s income rose slowly from about 7 billion USD to 13 billion USD, the lowest among the four nations by the end of the period.
再看旅游收入,泰国旅游收入从2000年的约80亿美元,增长至2014年的270多亿美元,始终位居四国第一。日本旅游收入变化最为突出,2000年约40亿美元,2005年前长期处于低位,之后大幅飙升,2014年达到2000亿美元。新加坡收入从90亿美元左右增至230亿美元,韩国收入增速最慢,从70亿美元增至130亿美元,成为期末四国中旅游收入最低的国家。


🔥 重点词汇

小作文想摆脱低分大白话,这些精准适配数据变化的高级短语一定要记牢!
1. 通用衔接短语
✅ corresponding tourism revenue 对应的旅游收入
✅ over the timeframe 在整个时间段内
✅ notably 值得注意的是(万能对比词)
2. 极值/排名描述
✅ consistently had the highest 始终位居首位
✅ the lowest among the four nations 四国中最低
✅ peaked at 达到峰值
3. 数据增速区分(高分核心!拒绝单调increase)
✅ rose steadily 稳步增长
✅ grew gradually 逐步平缓增长
✅ striking surge / dramatic rise 大幅飙升、急剧增长
✅ increased slowly 缓慢增长
4. 趋势细节描述
✅ initial tourist numbers 初始数据/初始游客数量
✅ remaining low until 一直保持低位直至……
✅ more than doubled 翻倍增长

组合图提分关键

1.结构为王:严格遵循「开头改写+整体概述+分图细节」四段式,不混乱、不跑题;
2. 概述优先:概述段只讲趋势不讲数据,是7分及以上的核心得分点;
3. 词汇分层:拒绝全程只用increase,用不同短语区分快慢、涨跌、幅度;
4. 突出对比:组合图重点是差异和共性,一定要体现国家间、数据间的对比!
掌握这套框架,下次遇到任何表格+折线图组合题,都能轻松拿捏高分!

告别无效备考
💪和阿宁一起“屠鸭”!
将持续更新更多雅思资料
用最实用的干货,
做你的专属备考搭子!

关注下方公众号:阿宁的考雅日记
回复关键词:【雅思】
无偿领取雅思资料PDF版本


求点赞

求分享

求喜欢