


文档内容
Numerical Critical Reasoning
Test 6
Solutions Booklet
Instructions
This numerical reasoning test comprises 21 questions, and you will have to correctly
answer as many as you can. Calculators are permitted for this test, and it is
recommended you have some rough paper to work on.
You will have to work quickly and accurately to perform well in this test. The test does
not have an overall time limit however each question has a time limit. The first
question relating to each table or graph has 90 seconds, and subsequent questions
relating to the same table or graph have 75 seconds.
Try to find a time and place where you will not be interrupted during the test. The test
will begin on the next page.
AssessmentDay
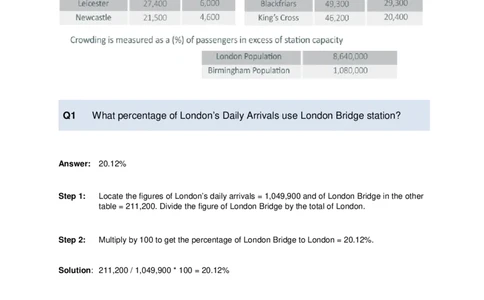
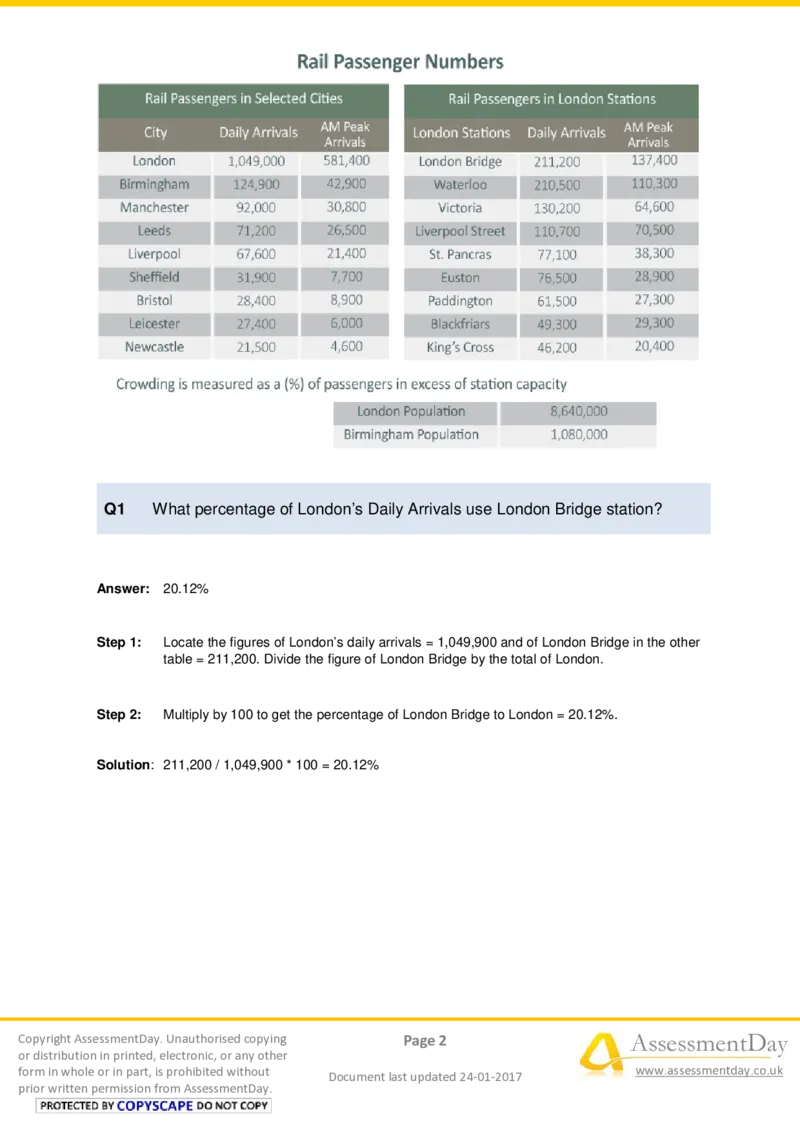
Practice Aptitude TestsQ1 What percentage of London’s Daily Arrivals use London Bridge station?
Answer: 20.12%
Step 1: Locate the figures of London’s daily arrivals = 1,049,900 and of London Bridge in the other
table = 211,200. Divide the figure of London Bridge by the total of London.
Step 2: Multiply by 100 to get the percentage of London Bridge to London = 20.12%.
Solution: 211,200 / 1,049,900 * 100 = 20.12%
Copyright AssessmentDay. Unauthorised copying Page 2 AssessmentDay
or distribution in printed, electronic, or any other
form in whole or in part, is prohibited without
Document last updated 24-01-2017
www.assessmentday.co.uk
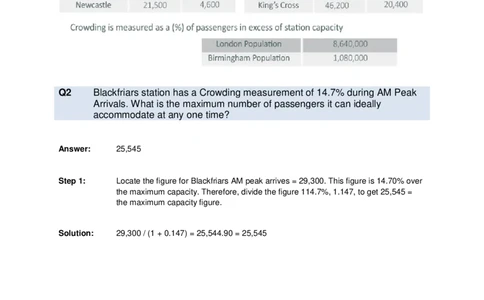
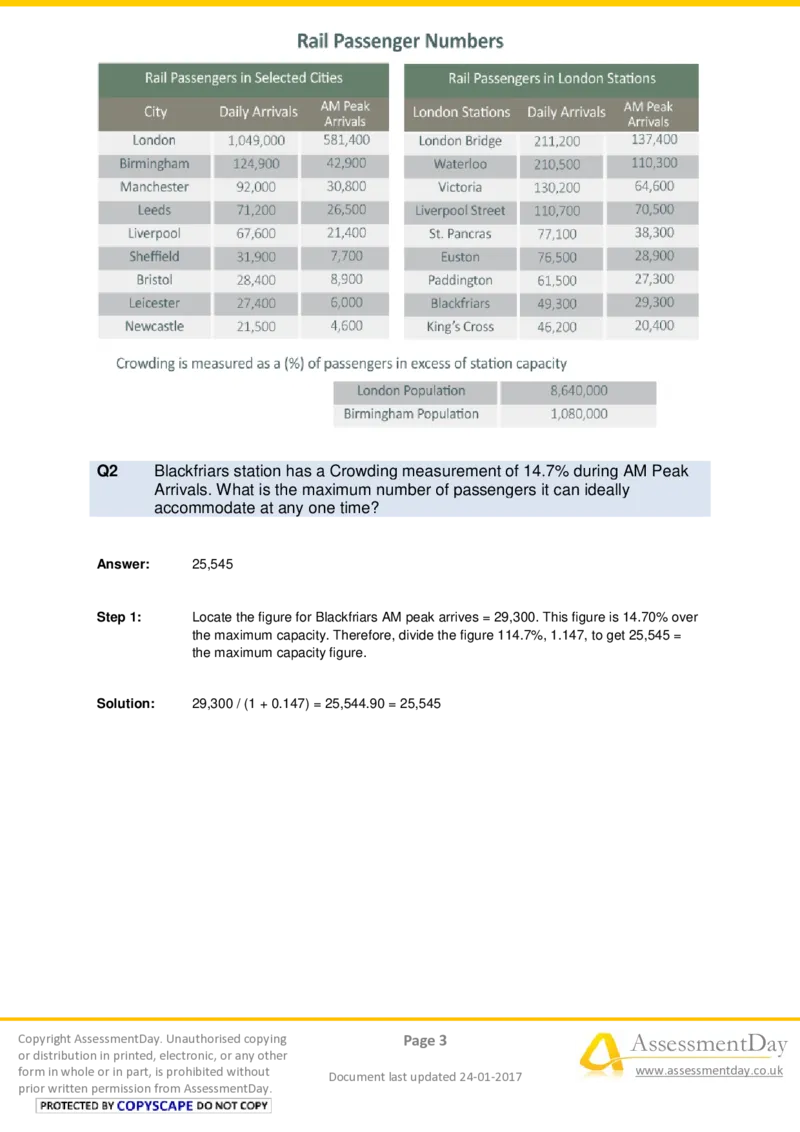
prior written permission from AssessmentDay.Q2 Blackfriars station has a Crowding measurement of 14.7% during AM Peak
Arrivals. What is the maximum number of passengers it can ideally
accommodate at any one time?
Answer: 25,545
Step 1: Locate the figure for Blackfriars AM peak arrives = 29,300. This figure is 14.70% over
the maximum capacity. Therefore, divide the figure 114.7%, 1.147, to get 25,545 =
the maximum capacity figure.
Solution: 29,300 / (1 + 0.147) = 25,544.90 = 25,545
Copyright AssessmentDay. Unauthorised copying Page 3 AssessmentDay
or distribution in printed, electronic, or any other
form in whole or in part, is prohibited without
Document last updated 24-01-2017
www.assessmentday.co.uk
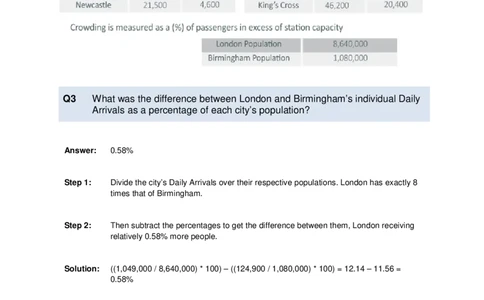
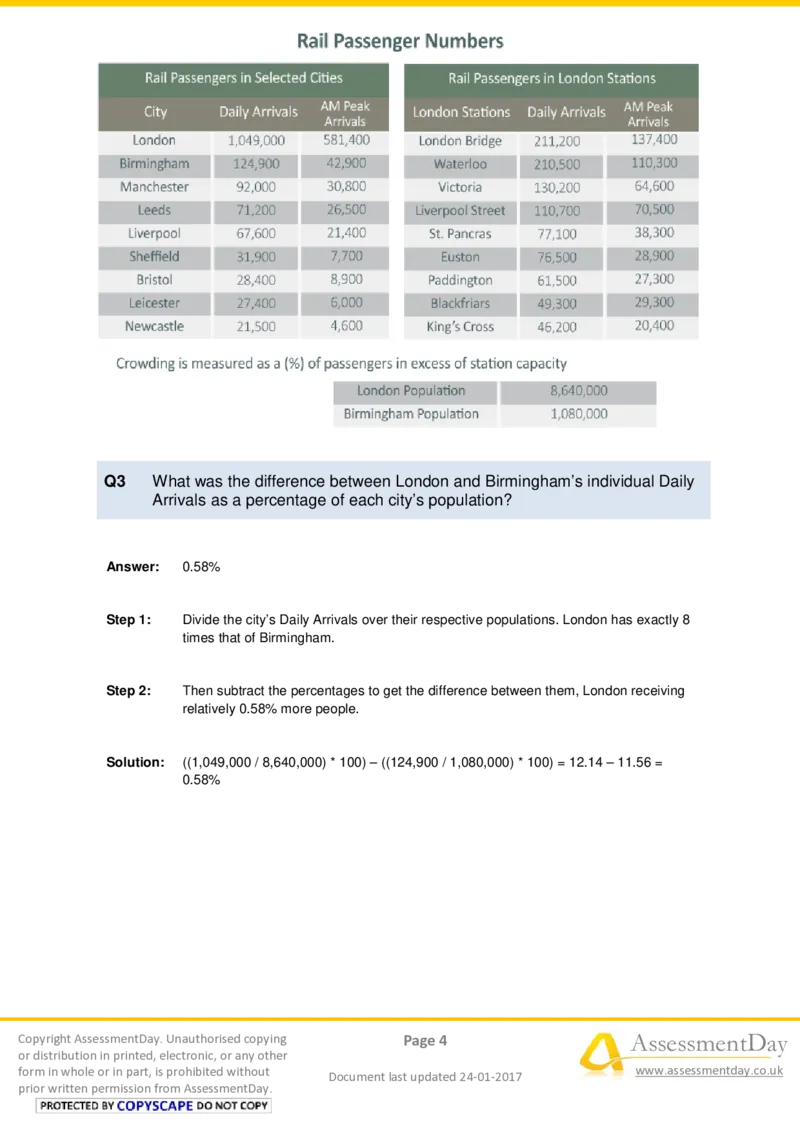
prior written permission from AssessmentDay.Q3 What was the difference between London and Birmingham’s individual Daily
Arrivals as a percentage of each city’s population?
Answer: 0.58%
Step 1: Divide the city’s Daily Arrivals over their respective populations. London has exactly 8
times that of Birmingham.
Step 2: Then subtract the percentages to get the difference between them, London receiving
relatively 0.58% more people.
Solution: ((1,049,000 / 8,640,000) * 100) – ((124,900 / 1,080,000) * 100) = 12.14 – 11.56 =
0.58%
Copyright AssessmentDay. Unauthorised copying Page 4 AssessmentDay
or distribution in printed, electronic, or any other
form in whole or in part, is prohibited without
Document last updated 24-01-2017
www.assessmentday.co.uk
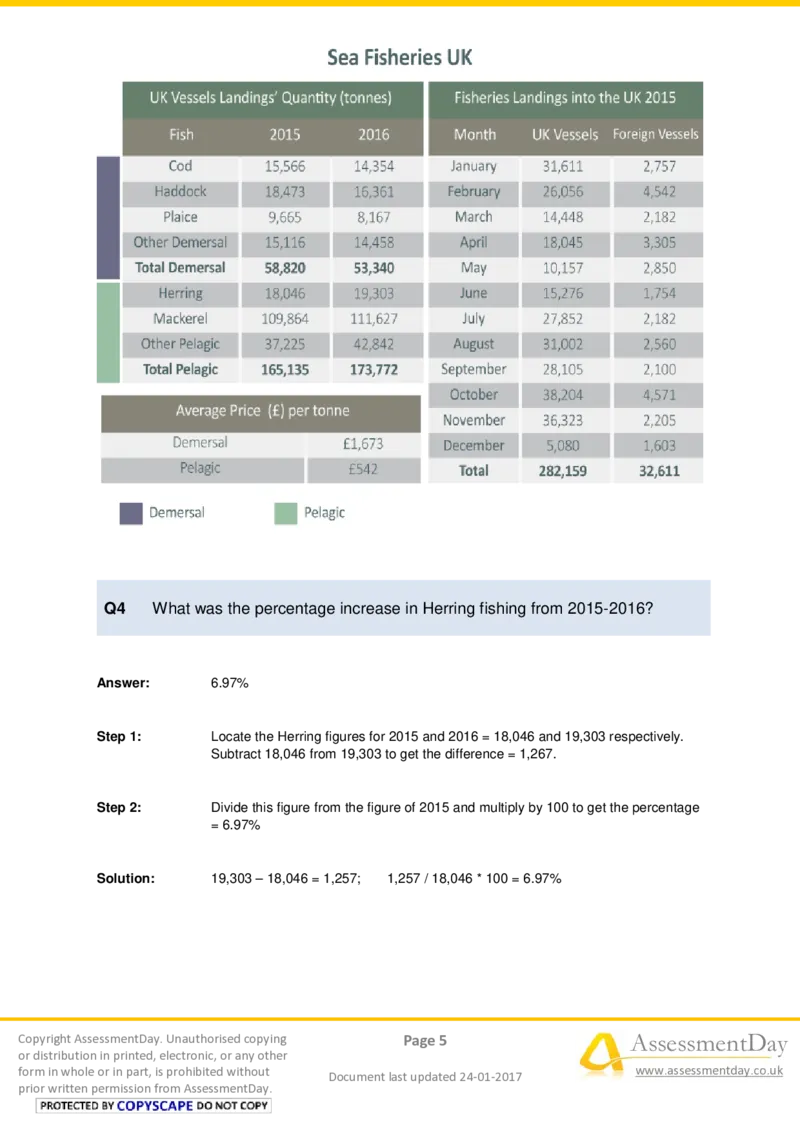
prior written permission from AssessmentDay.Q4 What was the percentage increase in Herring fishing from 2015-2016?
Answer: 6.97%
Step 1: Locate the Herring figures for 2015 and 2016 = 18,046 and 19,303 respectively.
Subtract 18,046 from 19,303 to get the difference = 1,267.
Step 2: Divide this figure from the figure of 2015 and multiply by 100 to get the percentage
= 6.97%
Solution: 19,303 – 18,046 = 1,257; 1,257 / 18,046 * 100 = 6.97%
Copyright AssessmentDay. Unauthorised copying Page 5 AssessmentDay
or distribution in printed, electronic, or any other
form in whole or in part, is prohibited without
Document last updated 24-01-2017
www.assessmentday.co.uk
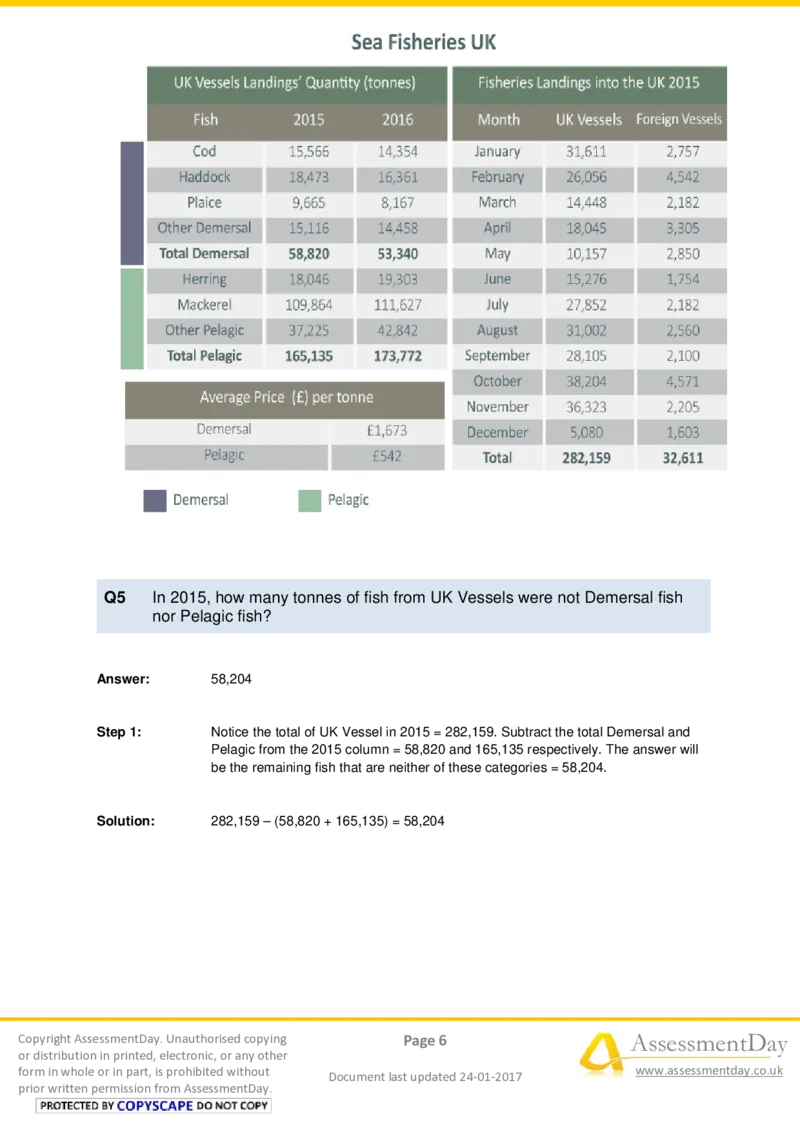
prior written permission from AssessmentDay.Q5 In 2015, how many tonnes of fish from UK Vessels were not Demersal fish
nor Pelagic fish?
Answer: 58,204
Step 1: Notice the total of UK Vessel in 2015 = 282,159. Subtract the total Demersal and
Pelagic from the 2015 column = 58,820 and 165,135 respectively. The answer will
be the remaining fish that are neither of these categories = 58,204.
Solution: 282,159 – (58,820 + 165,135) = 58,204
Copyright AssessmentDay. Unauthorised copying Page 6 AssessmentDay
or distribution in printed, electronic, or any other
form in whole or in part, is prohibited without
Document last updated 24-01-2017
www.assessmentday.co.uk
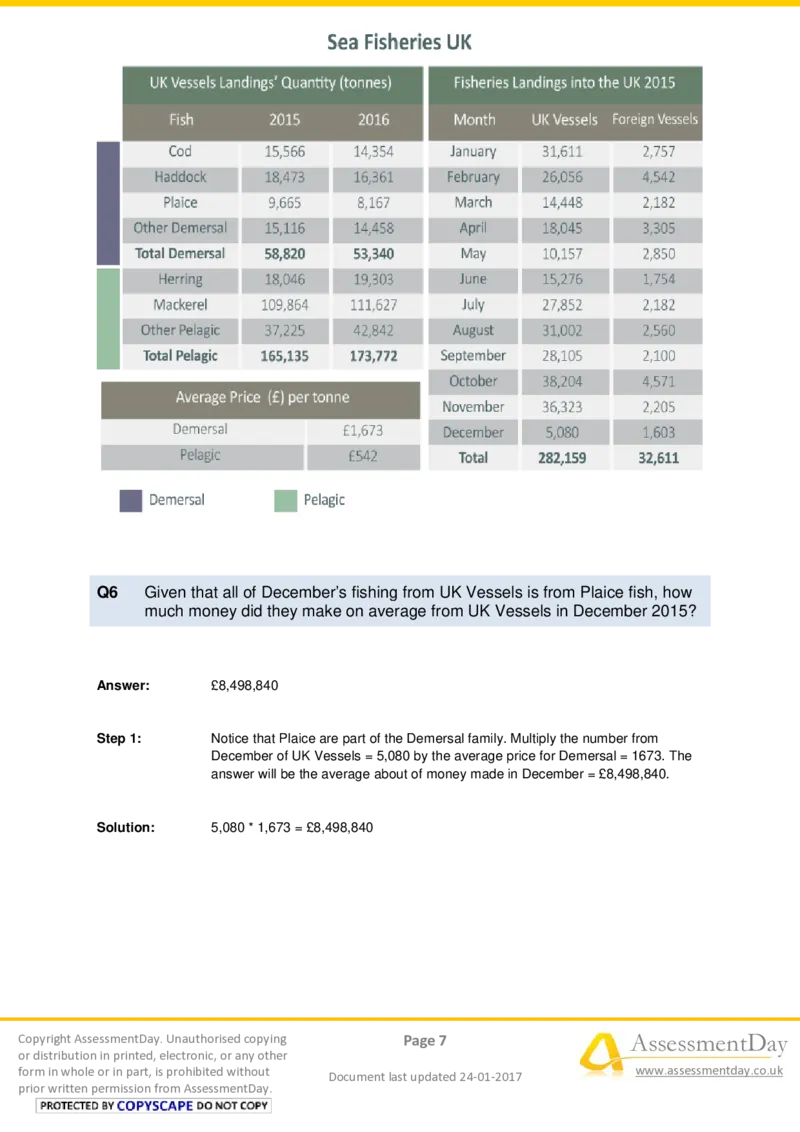
prior written permission from AssessmentDay.Q6 Given that all of December’s fishing from UK Vessels is from Plaice fish, how
much money did they make on average from UK Vessels in December 2015?
Answer: £8,498,840
Step 1: Notice that Plaice are part of the Demersal family. Multiply the number from
December of UK Vessels = 5,080 by the average price for Demersal = 1673. The
answer will be the average about of money made in December = £8,498,840.
Solution: 5,080 * 1,673 = £8,498,840
Copyright AssessmentDay. Unauthorised copying Page 7 AssessmentDay
or distribution in printed, electronic, or any other
form in whole or in part, is prohibited without
Document last updated 24-01-2017
www.assessmentday.co.uk
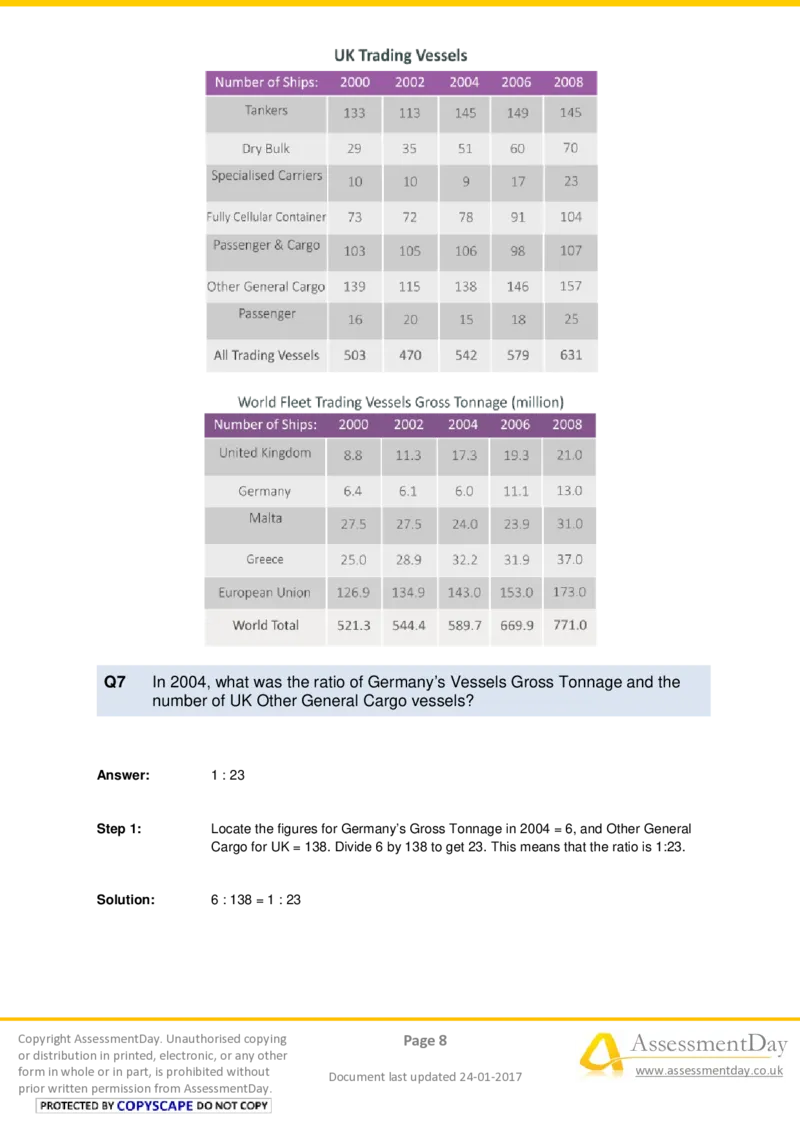
prior written permission from AssessmentDay.Q7 In 2004, what was the ratio of Germany’s Vessels Gross Tonnage and the
number of UK Other General Cargo vessels?
Answer: 1 : 23
Step 1: Locate the figures for Germany’s Gross Tonnage in 2004 = 6, and Other General
Cargo for UK = 138. Divide 6 by 138 to get 23. This means that the ratio is 1:23.
Solution: 6 : 138 = 1 : 23
Copyright AssessmentDay. Unauthorised copying Page 8 AssessmentDay
or distribution in printed, electronic, or any other
form in whole or in part, is prohibited without
Document last updated 24-01-2017
www.assessmentday.co.uk
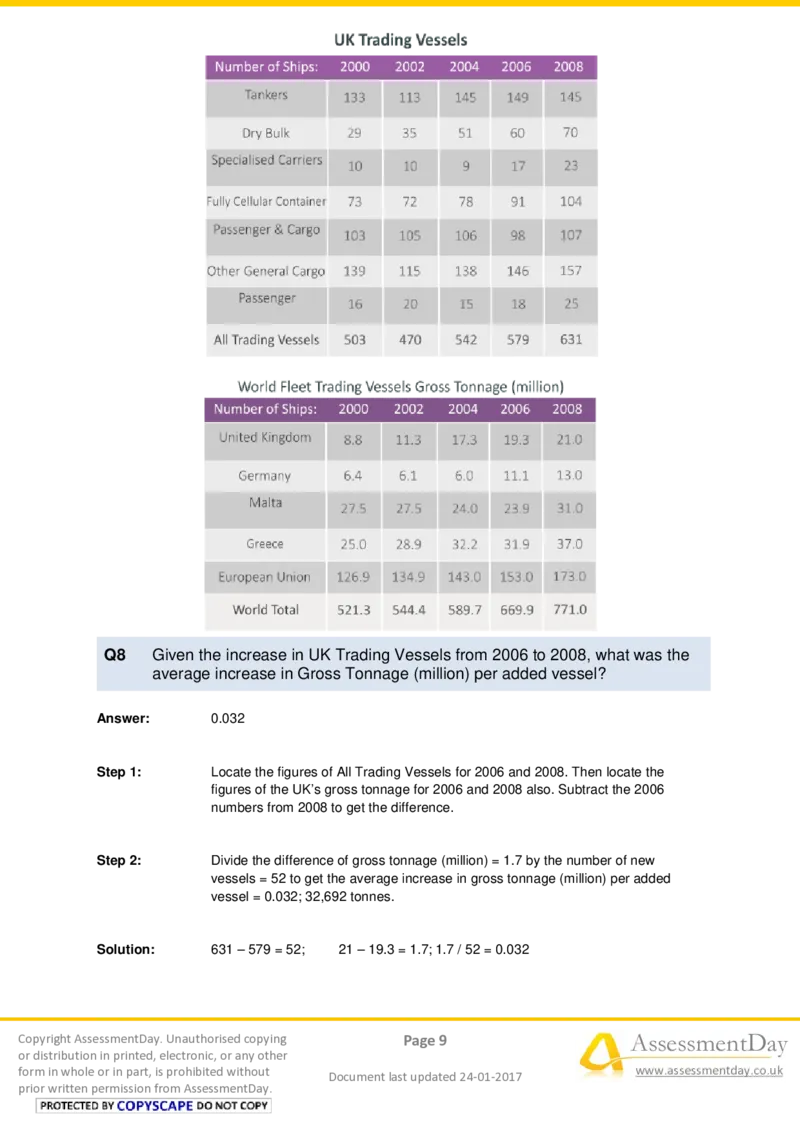
prior written permission from AssessmentDay.Q8 Given the increase in UK Trading Vessels from 2006 to 2008, what was the
average increase in Gross Tonnage (million) per added vessel?
Answer: 0.032
Step 1: Locate the figures of All Trading Vessels for 2006 and 2008. Then locate the
figures of the UK’s gross tonnage for 2006 and 2008 also. Subtract the 2006
numbers from 2008 to get the difference.
Step 2: Divide the difference of gross tonnage (million) = 1.7 by the number of new
vessels = 52 to get the average increase in gross tonnage (million) per added
vessel = 0.032; 32,692 tonnes.
Solution: 631 – 579 = 52; 21 – 19.3 = 1.7; 1.7 / 52 = 0.032
Copyright AssessmentDay. Unauthorised copying Page 9 AssessmentDay
or distribution in printed, electronic, or any other
form in whole or in part, is prohibited without
Document last updated 24-01-2017
www.assessmentday.co.uk
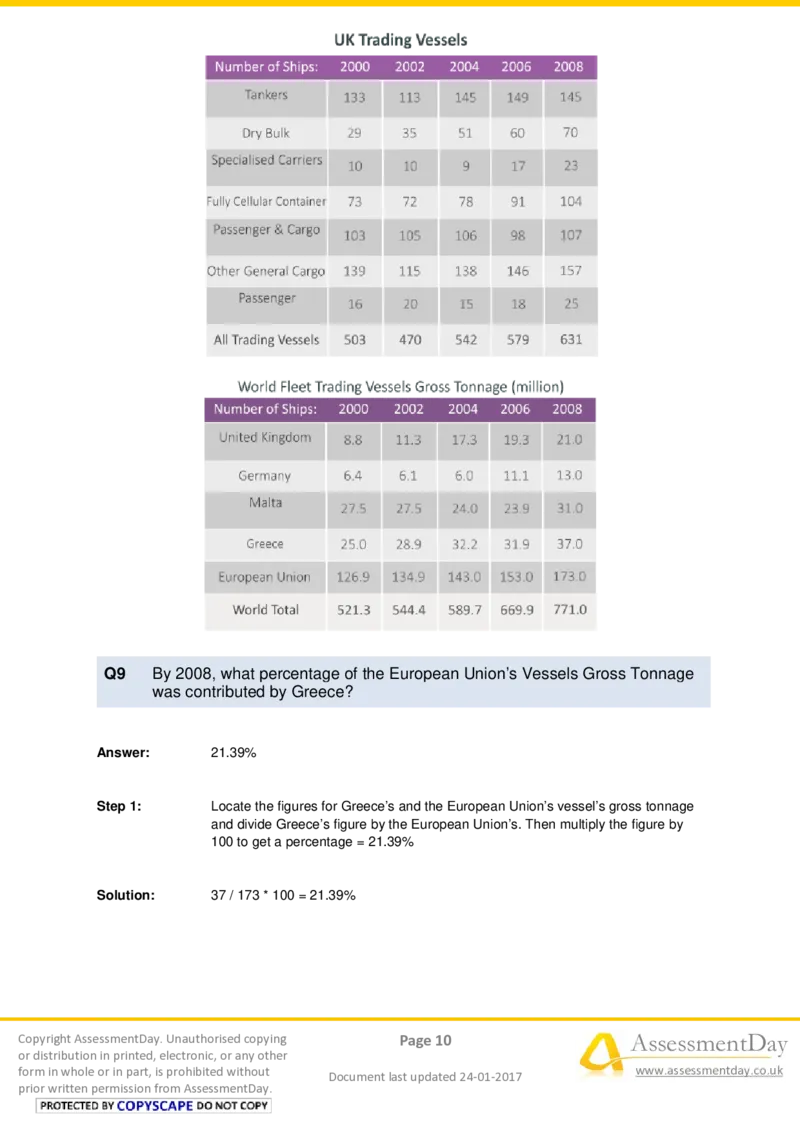
prior written permission from AssessmentDay.Q9 By 2008, what percentage of the European Union’s Vessels Gross Tonnage
was contributed by Greece?
Answer: 21.39%
Step 1: Locate the figures for Greece’s and the European Union’s vessel’s gross tonnage
and divide Greece’s figure by the European Union’s. Then multiply the figure by
100 to get a percentage = 21.39%
Solution: 37 / 173 * 100 = 21.39%
Copyright AssessmentDay. Unauthorised copying Page 10 AssessmentDay
or distribution in printed, electronic, or any other
form in whole or in part, is prohibited without
Document last updated 24-01-2017
www.assessmentday.co.uk
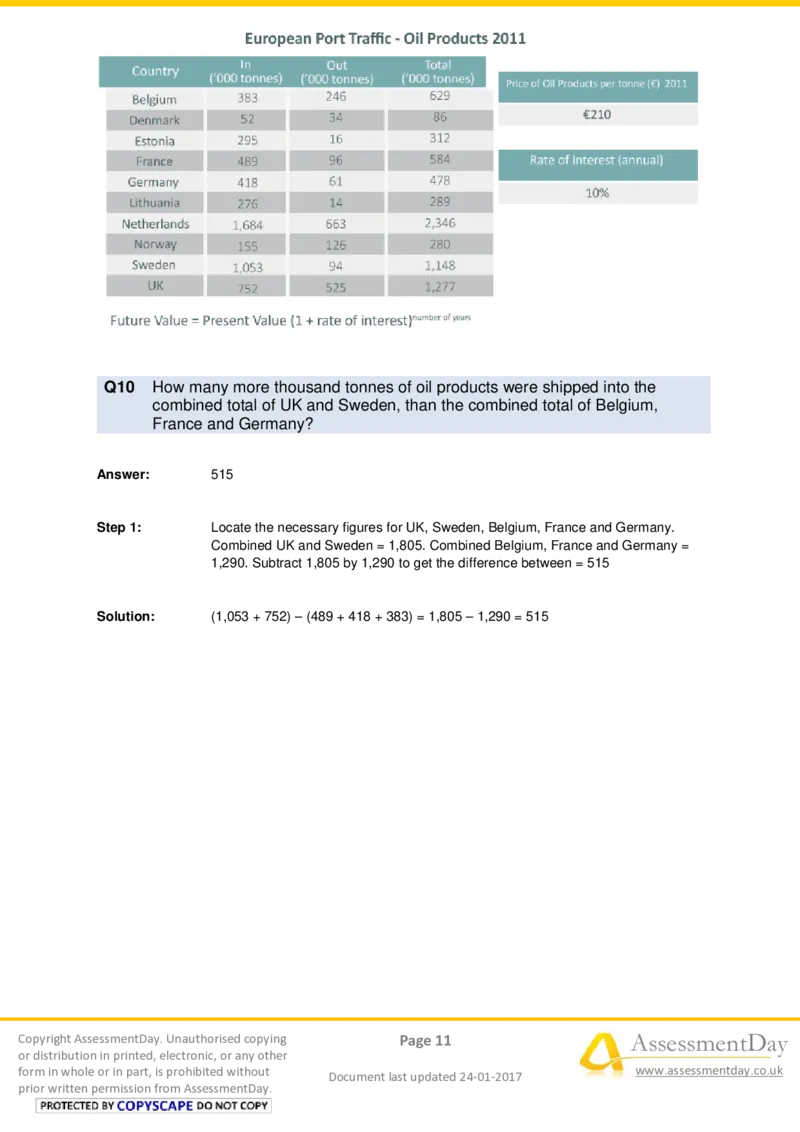
prior written permission from AssessmentDay.Q10 How many more thousand tonnes of oil products were shipped into the
combined total of UK and Sweden, than the combined total of Belgium,
France and Germany?
Answer: 515
Step 1: Locate the necessary figures for UK, Sweden, Belgium, France and Germany.
Combined UK and Sweden = 1,805. Combined Belgium, France and Germany =
1,290. Subtract 1,805 by 1,290 to get the difference between = 515
Solution: (1,053 + 752) – (489 + 418 + 383) = 1,805 – 1,290 = 515
Copyright AssessmentDay. Unauthorised copying Page 11 AssessmentDay
or distribution in printed, electronic, or any other
form in whole or in part, is prohibited without
Document last updated 24-01-2017
www.assessmentday.co.uk
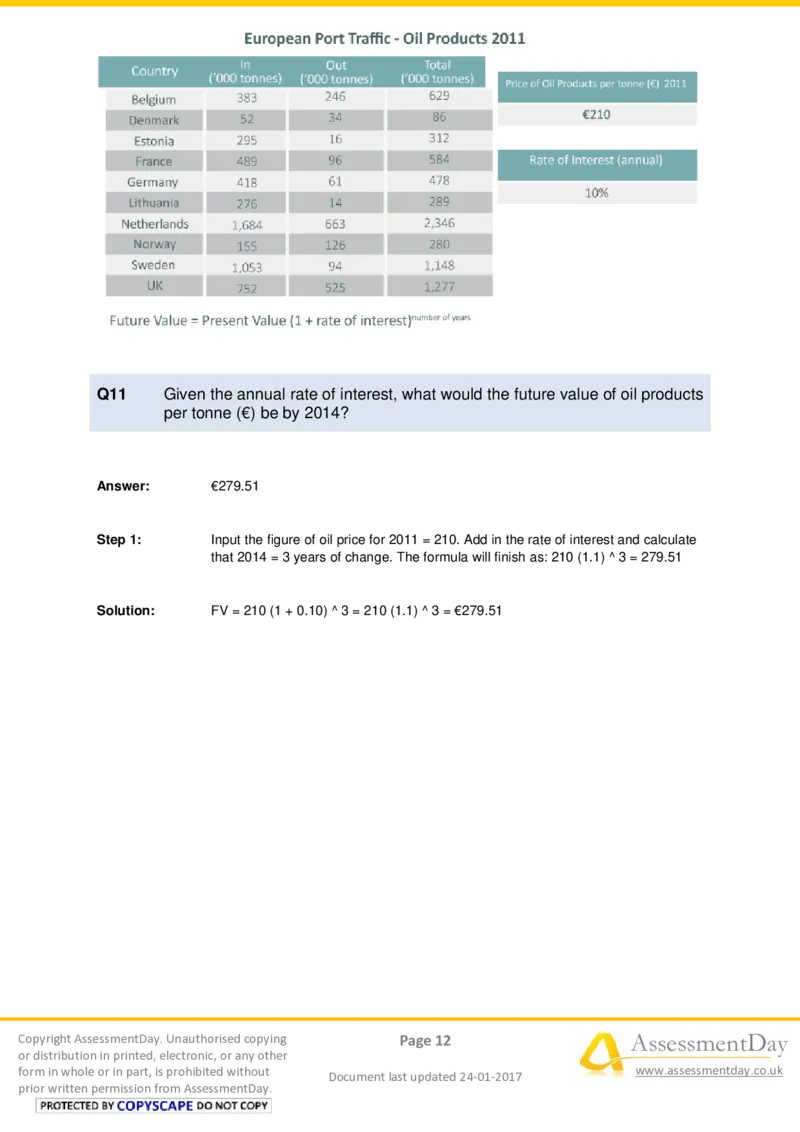
prior written permission from AssessmentDay.Q11 Given the annual rate of interest, what would the future value of oil products
per tonne (€) be by 2014?
Answer: €279.51
Step 1: Input the figure of oil price for 2011 = 210. Add in the rate of interest and calculate
that 2014 = 3 years of change. The formula will finish as: 210 (1.1) ^ 3 = 279.51
Solution: FV = 210 (1 + 0.10) ^ 3 = 210 (1.1) ^ 3 = €279.51
Copyright AssessmentDay. Unauthorised copying Page 12 AssessmentDay
or distribution in printed, electronic, or any other
form in whole or in part, is prohibited without
Document last updated 24-01-2017
www.assessmentday.co.uk
prior written permission from AssessmentDay.Q12 Which country has the greatest divide between oil products going In, to going
Out (thousand tonnes)?
Answer: Netherlands
Step 1: Notice that the most obvious biggest divides are those with the highest In figures =
Netherlands and Sweden.
Step 2: Subtract their Out numbers to get 1,021 and 959 respectively. 1,021 is greater
than 959. Therefore, Netherlands has the biggest divide between ingoing and
outgoing.
Solution: 1,684 – 663 = 1,021; 1,053 – 94 = 959; 1,021 > 959 = Netherlands
Copyright AssessmentDay. Unauthorised copying Page 13 AssessmentDay
or distribution in printed, electronic, or any other
form in whole or in part, is prohibited without
Document last updated 24-01-2017
www.assessmentday.co.uk
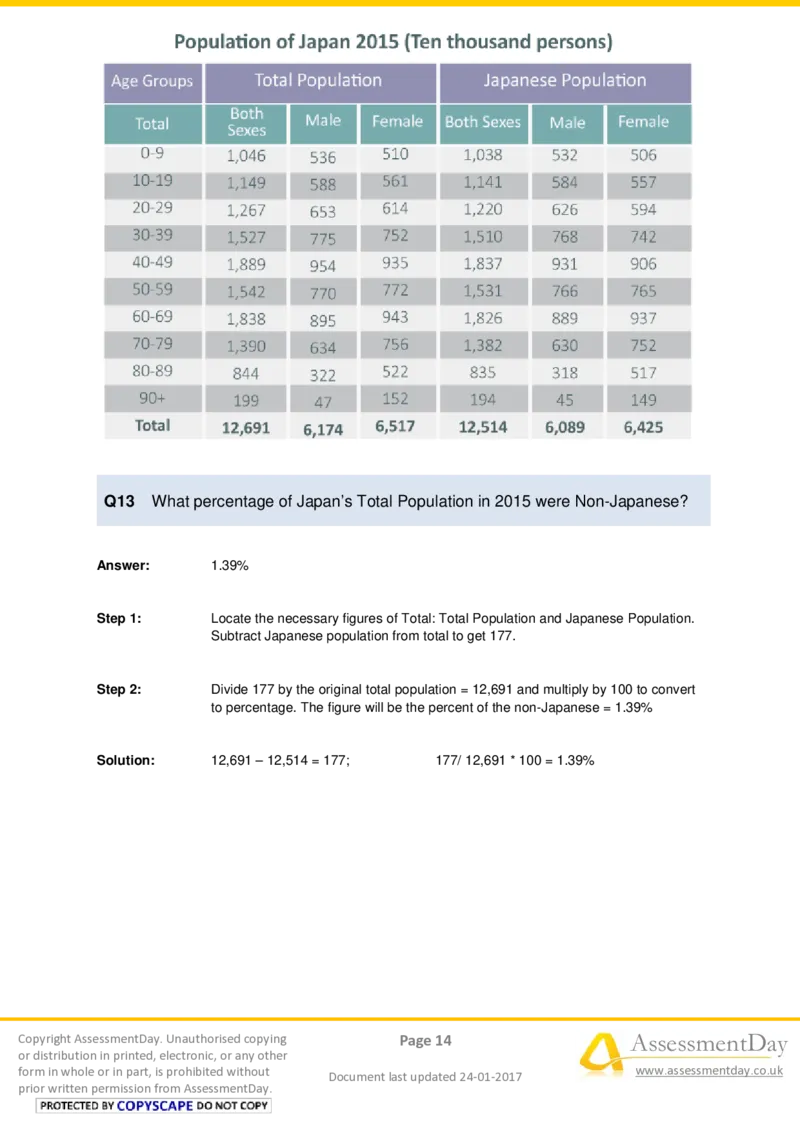
prior written permission from AssessmentDay.Q13 What percentage of Japan’s Total Population in 2015 were Non-Japanese?
Answer: 1.39%
Step 1: Locate the necessary figures of Total: Total Population and Japanese Population.
Subtract Japanese population from total to get 177.
Step 2: Divide 177 by the original total population = 12,691 and multiply by 100 to convert
to percentage. The figure will be the percent of the non-Japanese = 1.39%
Solution: 12,691 – 12,514 = 177; 177/ 12,691 * 100 = 1.39%
Copyright AssessmentDay. Unauthorised copying Page 14 AssessmentDay
or distribution in printed, electronic, or any other
form in whole or in part, is prohibited without
Document last updated 24-01-2017
www.assessmentday.co.uk
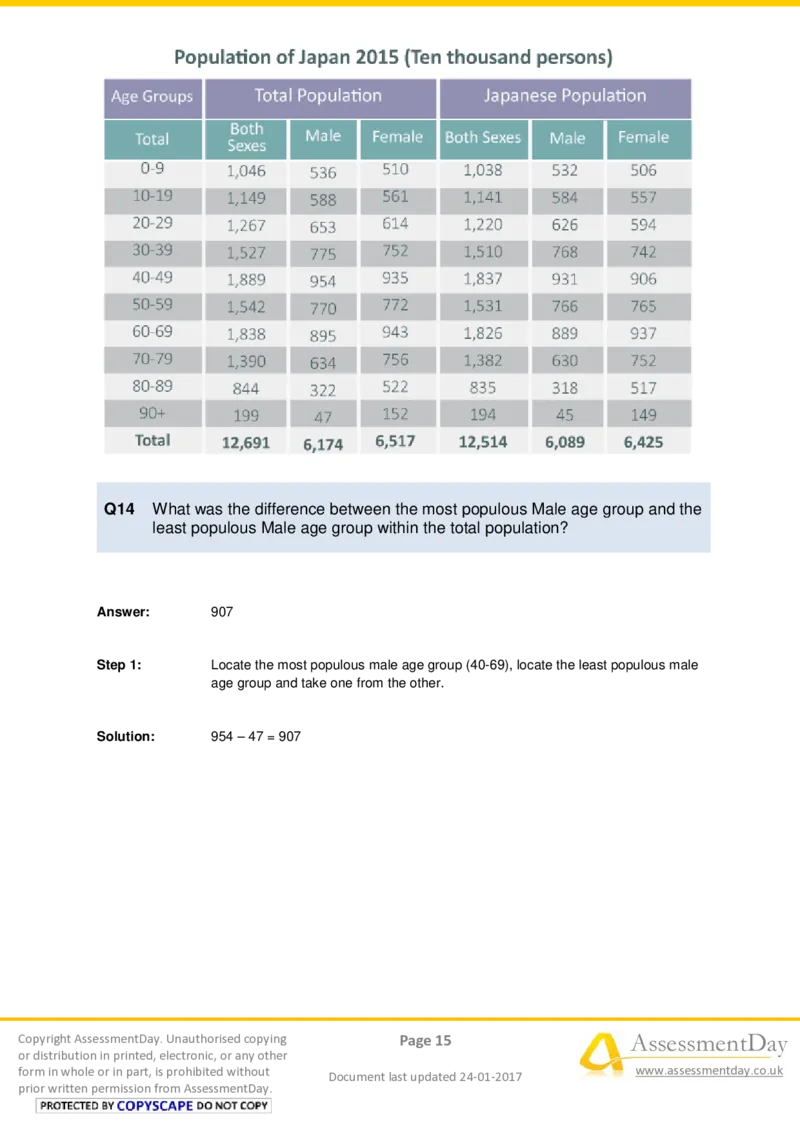
prior written permission from AssessmentDay.Q14 What was the difference between the most populous Male age group and the
least populous Male age group within the total population?
Answer: 907
Step 1: Locate the most populous male age group (40-69), locate the least populous male
age group and take one from the other.
Solution: 954 – 47 = 907
Copyright AssessmentDay. Unauthorised copying Page 15 AssessmentDay
or distribution in printed, electronic, or any other
form in whole or in part, is prohibited without
Document last updated 24-01-2017
www.assessmentday.co.uk
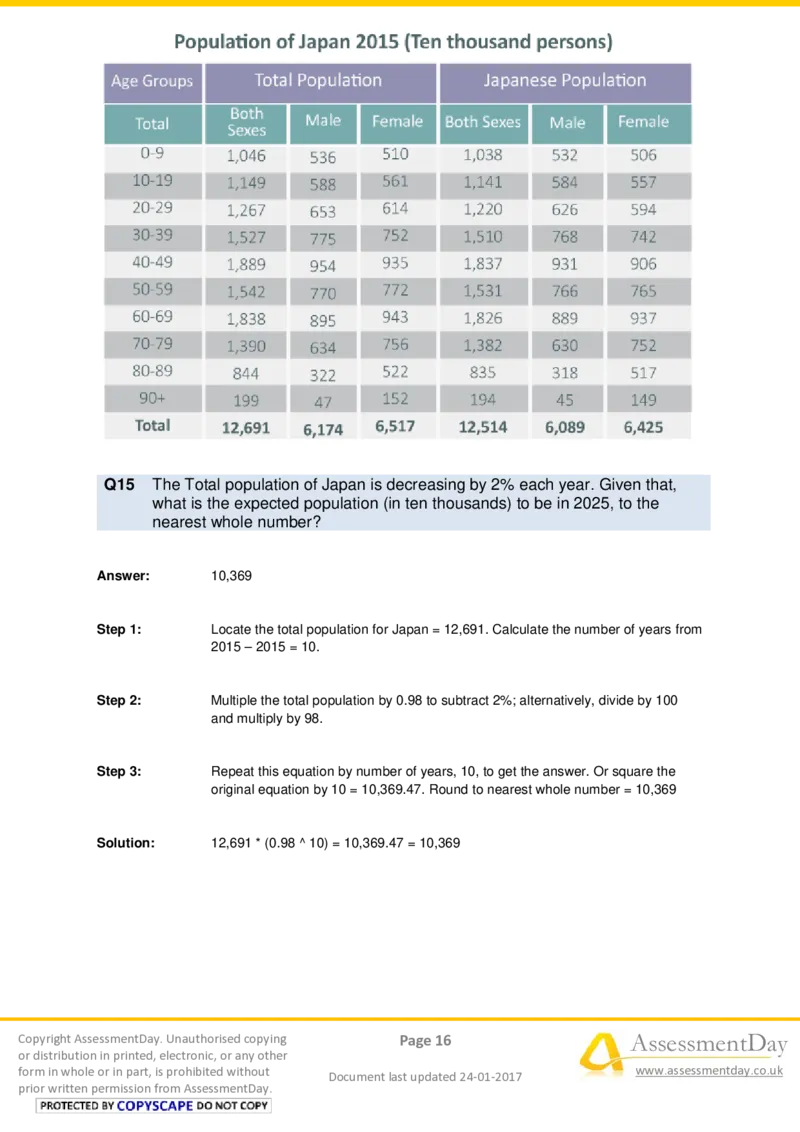
prior written permission from AssessmentDay.Q15 The Total population of Japan is decreasing by 2% each year. Given that,
what is the expected population (in ten thousands) to be in 2025, to the
nearest whole number?
Answer: 10,369
Step 1: Locate the total population for Japan = 12,691. Calculate the number of years from
2015 – 2015 = 10.
Step 2: Multiple the total population by 0.98 to subtract 2%; alternatively, divide by 100
and multiply by 98.
Step 3: Repeat this equation by number of years, 10, to get the answer. Or square the
original equation by 10 = 10,369.47. Round to nearest whole number = 10,369
Solution: 12,691 * (0.98 ^ 10) = 10,369.47 = 10,369
Copyright AssessmentDay. Unauthorised copying Page 16 AssessmentDay
or distribution in printed, electronic, or any other
form in whole or in part, is prohibited without
Document last updated 24-01-2017
www.assessmentday.co.uk
prior written permission from AssessmentDay.Q16 How many more Females of Working Age (in thousand persons) in total were
employed in 2012 than in 2007 (rounded to the nearest whole number)?
Answer: 333
Step 1: Locate the total female in 2007 = 27,535 and multiply by %; X = Y * P%. Repeat
this process from 2012.
Step 2: Then subtract the 2007 figure by 2012 to get the difference between the two =
333.
Solution: 27,535 * 0.617 = 16,989.10;
27,452 * 0.631 = 17,322.21;
17,322.21 – 16,989.10 = 333.11 = 333
Copyright AssessmentDay. Unauthorised copying Page 17 AssessmentDay
or distribution in printed, electronic, or any other
form in whole or in part, is prohibited without
Document last updated 24-01-2017
www.assessmentday.co.uk
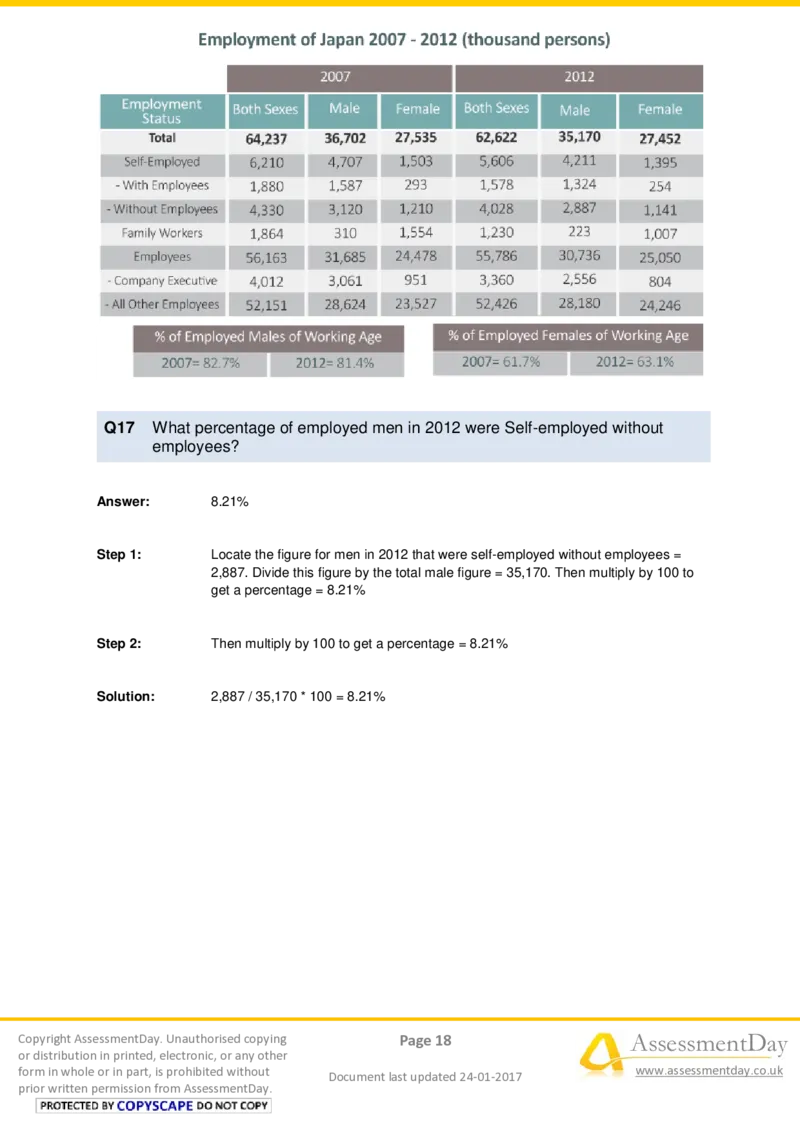
prior written permission from AssessmentDay.Q17 What percentage of employed men in 2012 were Self-employed without
employees?
Answer: 8.21%
Step 1: Locate the figure for men in 2012 that were self-employed without employees =
2,887. Divide this figure by the total male figure = 35,170. Then multiply by 100 to
get a percentage = 8.21%
Step 2: Then multiply by 100 to get a percentage = 8.21%
Solution: 2,887 / 35,170 * 100 = 8.21%
Copyright AssessmentDay. Unauthorised copying Page 18 AssessmentDay
or distribution in printed, electronic, or any other
form in whole or in part, is prohibited without
Document last updated 24-01-2017
www.assessmentday.co.uk
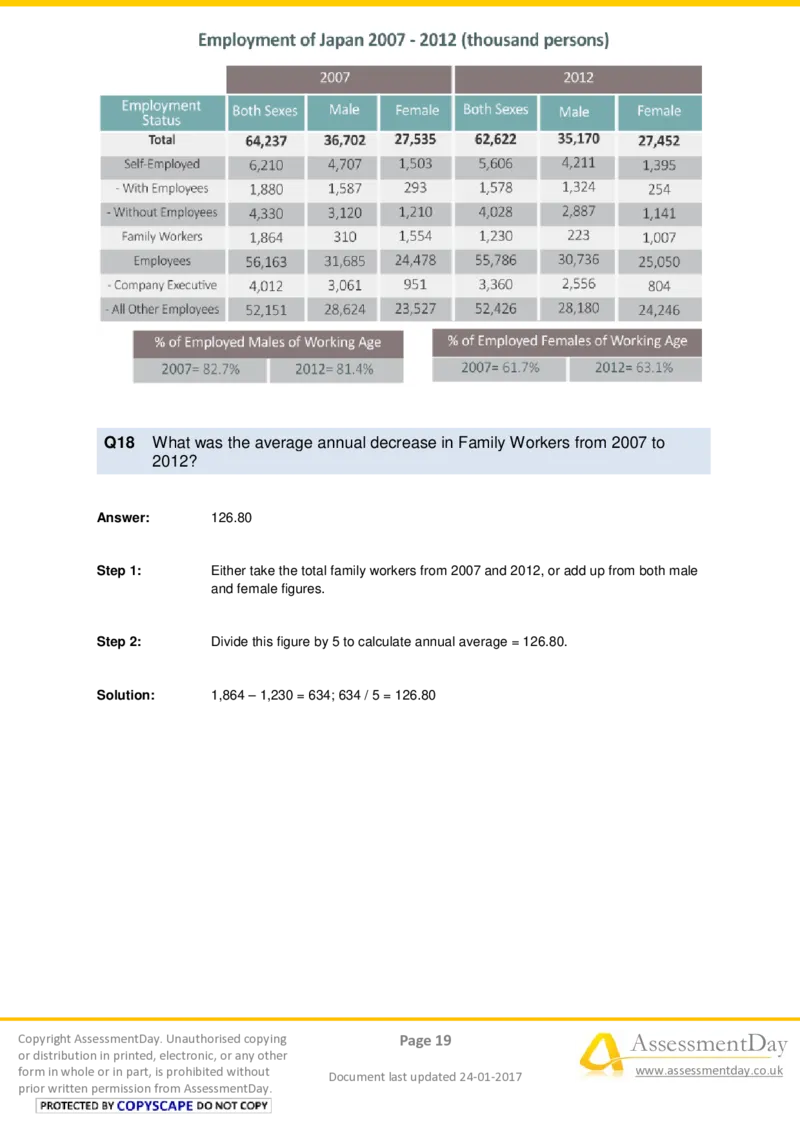
prior written permission from AssessmentDay.Q18 What was the average annual decrease in Family Workers from 2007 to
2012?
Answer: 126.80
Step 1: Either take the total family workers from 2007 and 2012, or add up from both male
and female figures.
Step 2: Divide this figure by 5 to calculate annual average = 126.80.
Solution: 1,864 – 1,230 = 634; 634 / 5 = 126.80
Copyright AssessmentDay. Unauthorised copying Page 19 AssessmentDay
or distribution in printed, electronic, or any other
form in whole or in part, is prohibited without
Document last updated 24-01-2017
www.assessmentday.co.uk
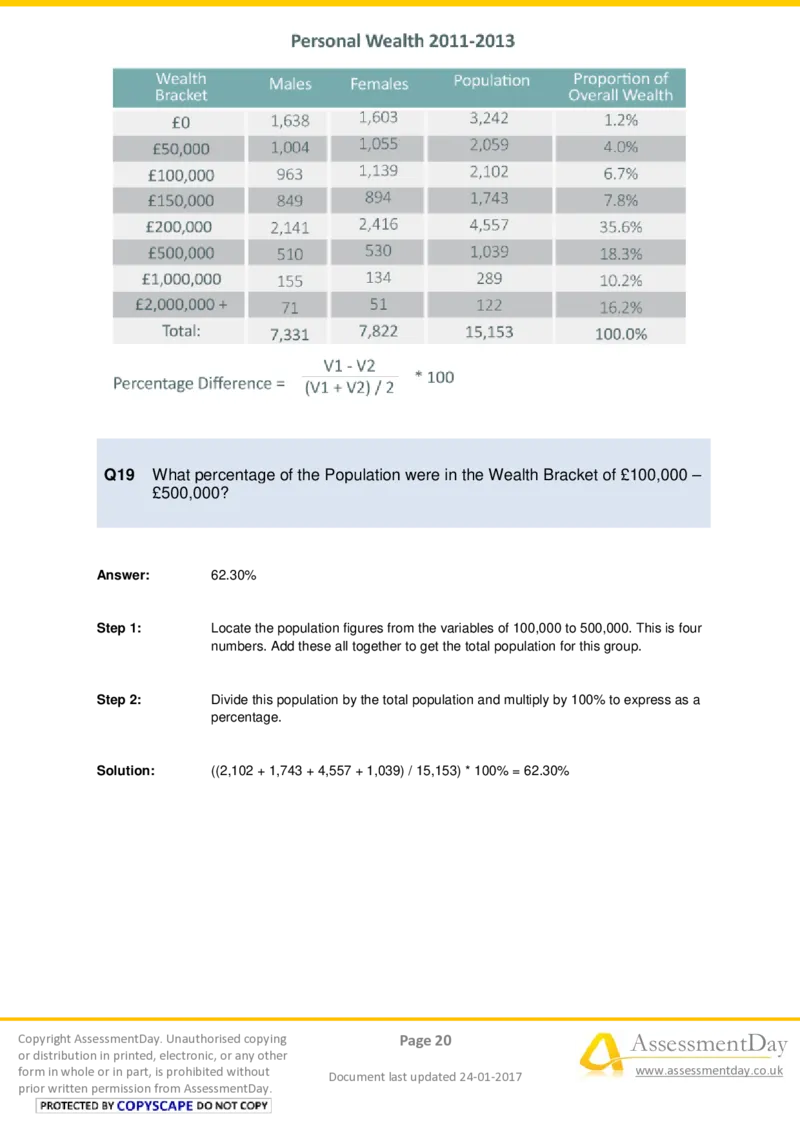
prior written permission from AssessmentDay.Q19 What percentage of the Population were in the Wealth Bracket of £100,000 –
£500,000?
Answer: 62.30%
Step 1: Locate the population figures from the variables of 100,000 to 500,000. This is four
numbers. Add these all together to get the total population for this group.
Step 2: Divide this population by the total population and multiply by 100% to express as a
percentage.
Solution: ((2,102 + 1,743 + 4,557 + 1,039) / 15,153) * 100% = 62.30%
Copyright AssessmentDay. Unauthorised copying Page 20 AssessmentDay
or distribution in printed, electronic, or any other
form in whole or in part, is prohibited without
Document last updated 24-01-2017
www.assessmentday.co.uk
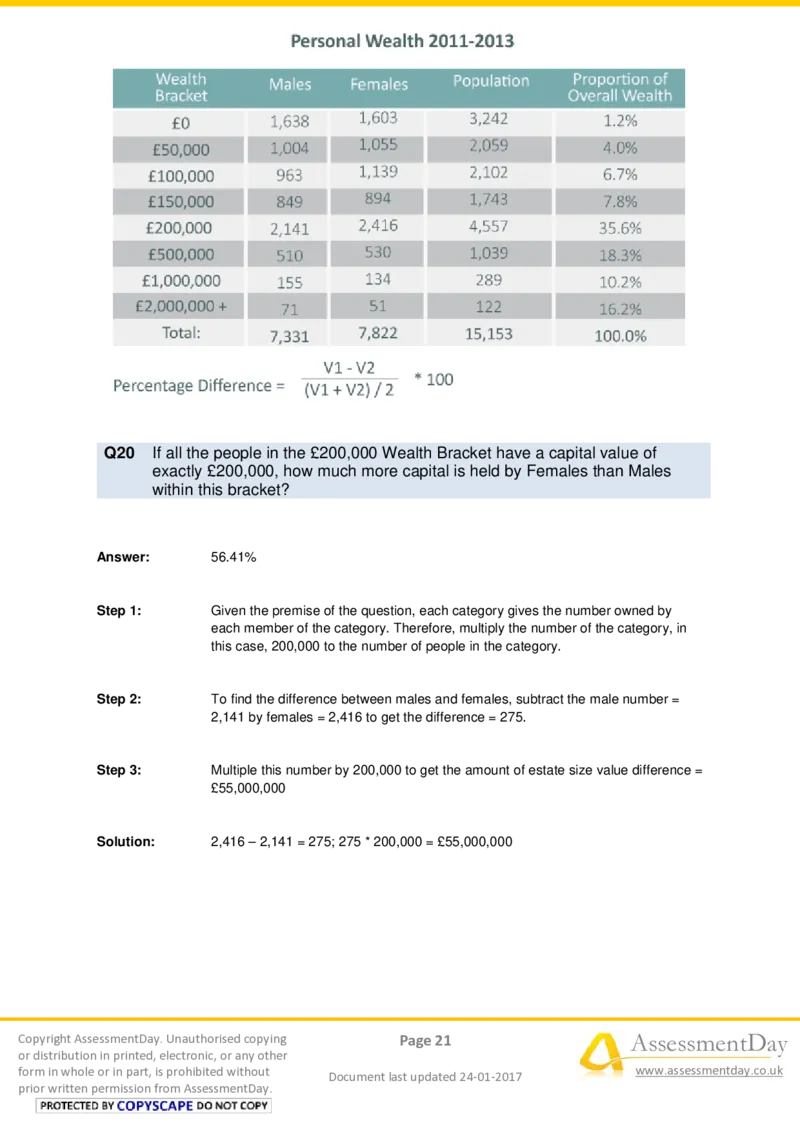
prior written permission from AssessmentDay.Q20 If all the people in the £200,000 Wealth Bracket have a capital value of
exactly £200,000, how much more capital is held by Females than Males
within this bracket?
Answer: 56.41%
Step 1: Given the premise of the question, each category gives the number owned by
each member of the category. Therefore, multiply the number of the category, in
this case, 200,000 to the number of people in the category.
Step 2: To find the difference between males and females, subtract the male number =
2,141 by females = 2,416 to get the difference = 275.
Step 3: Multiple this number by 200,000 to get the amount of estate size value difference =
£55,000,000
Solution: 2,416 – 2,141 = 275; 275 * 200,000 = £55,000,000
Copyright AssessmentDay. Unauthorised copying Page 21 AssessmentDay
or distribution in printed, electronic, or any other
form in whole or in part, is prohibited without
Document last updated 24-01-2017
www.assessmentday.co.uk
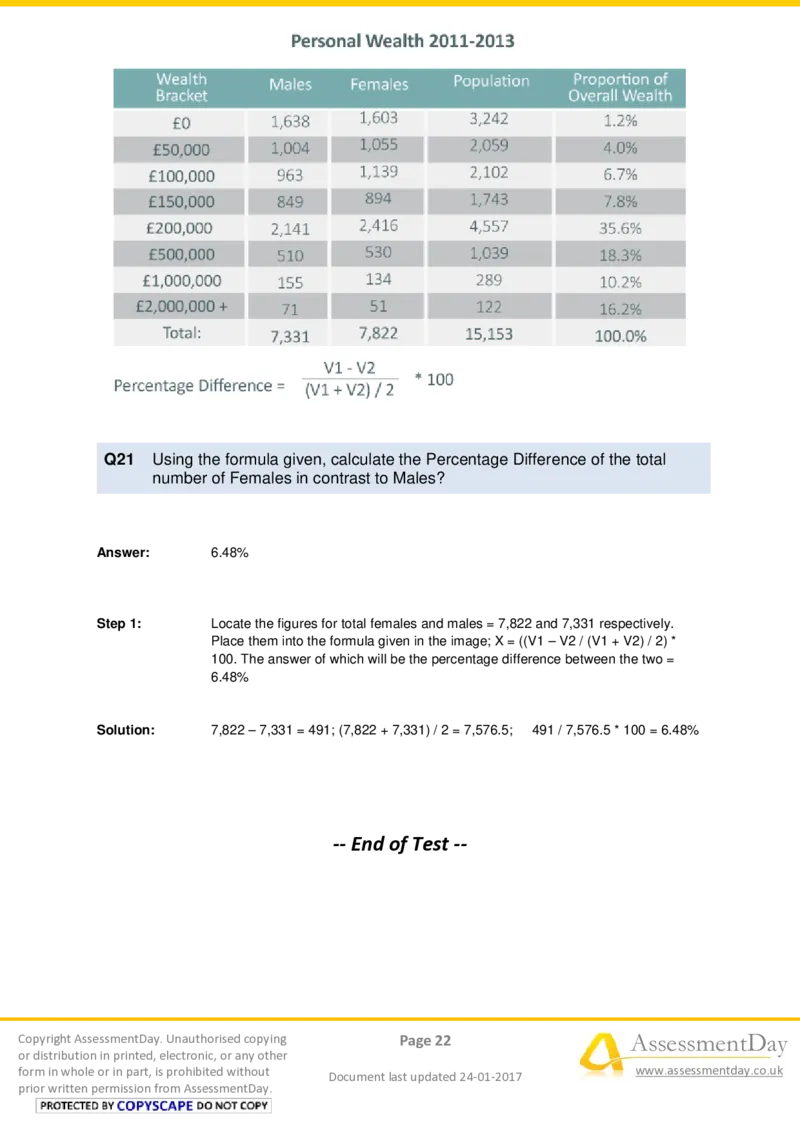
prior written permission from AssessmentDay.Q21 Using the formula given, calculate the Percentage Difference of the total
number of Females in contrast to Males?
Answer: 6.48%
Step 1: Locate the figures for total females and males = 7,822 and 7,331 respectively.
Place them into the formula given in the image; X = ((V1 – V2 / (V1 + V2) / 2) *
100. The answer of which will be the percentage difference between the two =
6.48%
Solution: 7,822 – 7,331 = 491; (7,822 + 7,331) / 2 = 7,576.5; 491 / 7,576.5 * 100 = 6.48%
-- End of Test --
Copyright AssessmentDay. Unauthorised copying Page 22 AssessmentDay
or distribution in printed, electronic, or any other
form in whole or in part, is prohibited without
Document last updated 24-01-2017
www.assessmentday.co.uk
prior written permission from AssessmentDay.

