
文档内容
1、
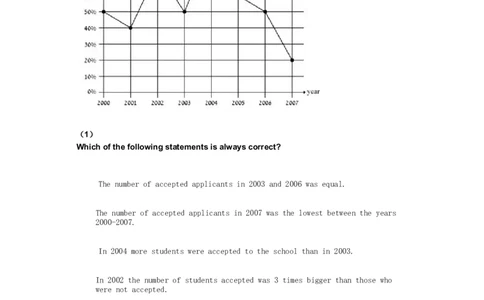
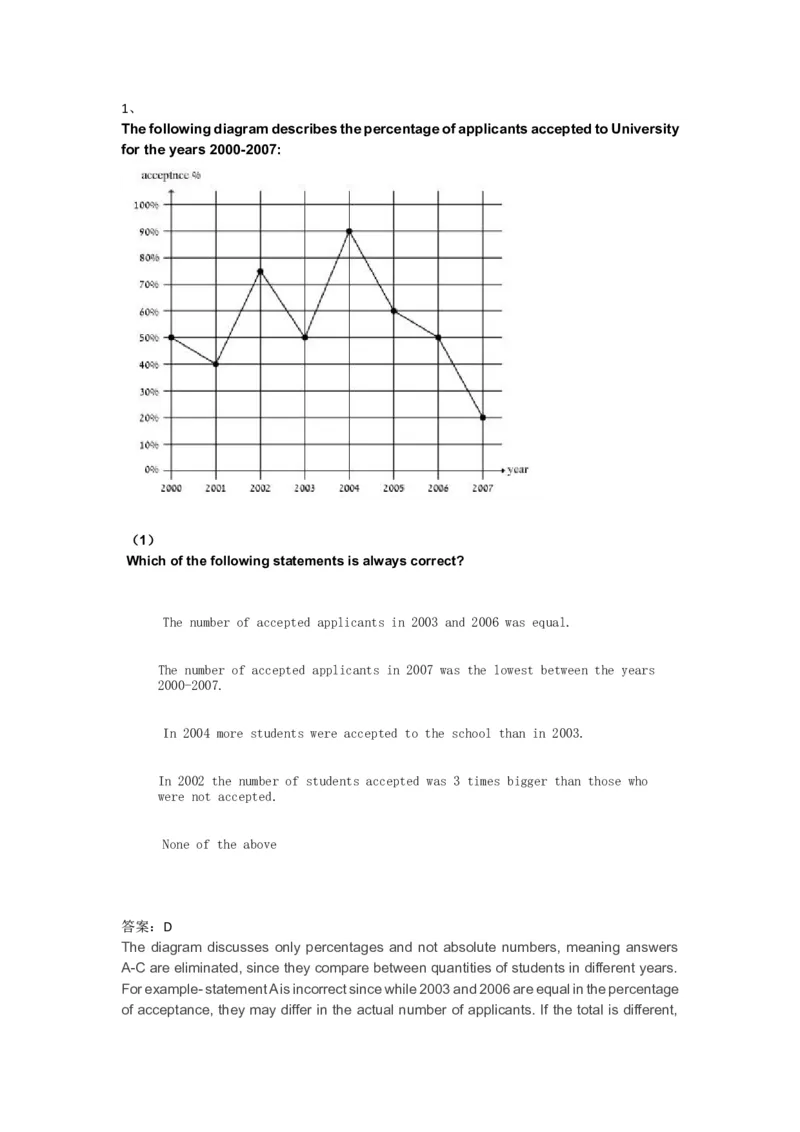
The following diagram describes the percentage of applicants accepted to University
for the years 2000-2007:
(1)
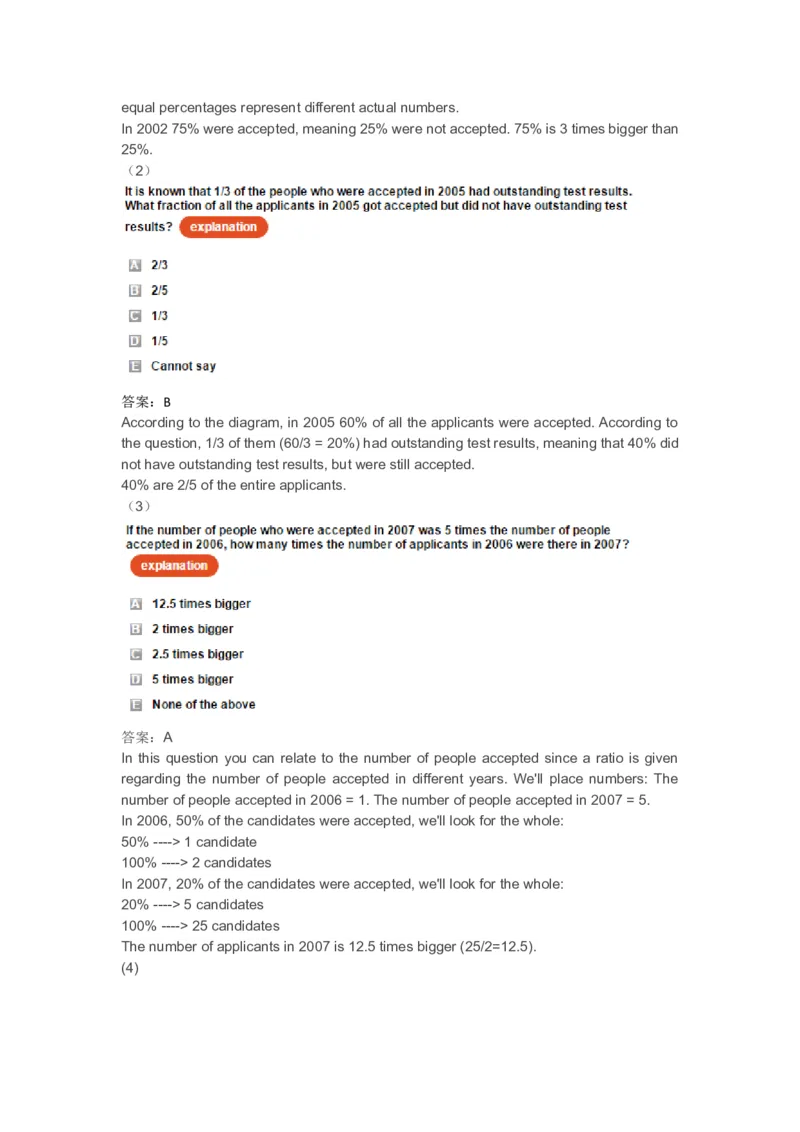
Which of the following statements is always correct?
A The number of accepted applicants in 2003 and 2006 was equal.
The number of accepted applicants in 2007 was the lowest between the years
B
2000-2007.
C In 2004 more students were accepted to the school than in 2003.
In 2002 the number of students accepted was 3 times bigger than those who
D
were not accepted.
E None of the above
答案:D
The diagram discusses only percentages and not absolute numbers, meaning answers
A-C are eliminated, since they compare between quantities of students in different years.
For example- statement A is incorrect since while 2003 and 2006 are equal in the percentage
of acceptance, they may differ in the actual number of applicants. If the total is different,equal percentages represent different actual numbers.
In 2002 75% were accepted, meaning 25% were not accepted. 75% is 3 times bigger than
25%.
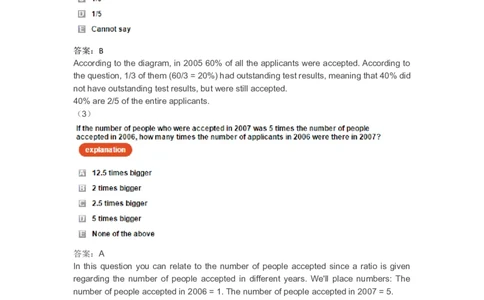
(2)
答案:B
According to the diagram, in 2005 60% of all the applicants were accepted. According to
the question, 1/3 of them (60/3 = 20%) had outstanding test results, meaning that 40% did
not have outstanding test results, but were still accepted.
40% are 2/5 of the entire applicants.
(3)
答案:A
In this question you can relate to the number of people accepted since a ratio is given
regarding the number of people accepted in different years. We'll place numbers: The
number of people accepted in 2006 = 1. The number of people accepted in 2007 = 5.
In 2006, 50% of the candidates were accepted, we'll look for the whole:
50% ----> 1 candidate
100% ----> 2 candidates
In 2007, 20% of the candidates were accepted, we'll look for the whole:
20% ----> 5 candidates
100% ----> 25 candidates
The number of applicants in 2007 is 12.5 times bigger (25/2=12.5).
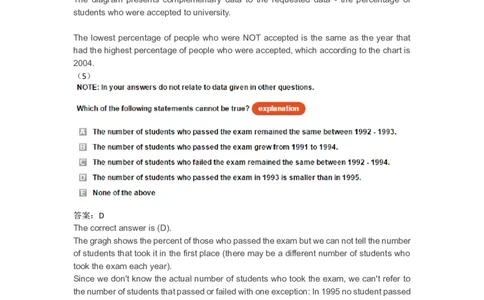
(4)答案:B
The diagram presents complementary data to the requested data - the percentage of
students who were accepted to university.
The lowest percentage of people who were NOT accepted is the same as the year that
had the highest percentage of people who were accepted, which according to the chart is
2004.
(5)
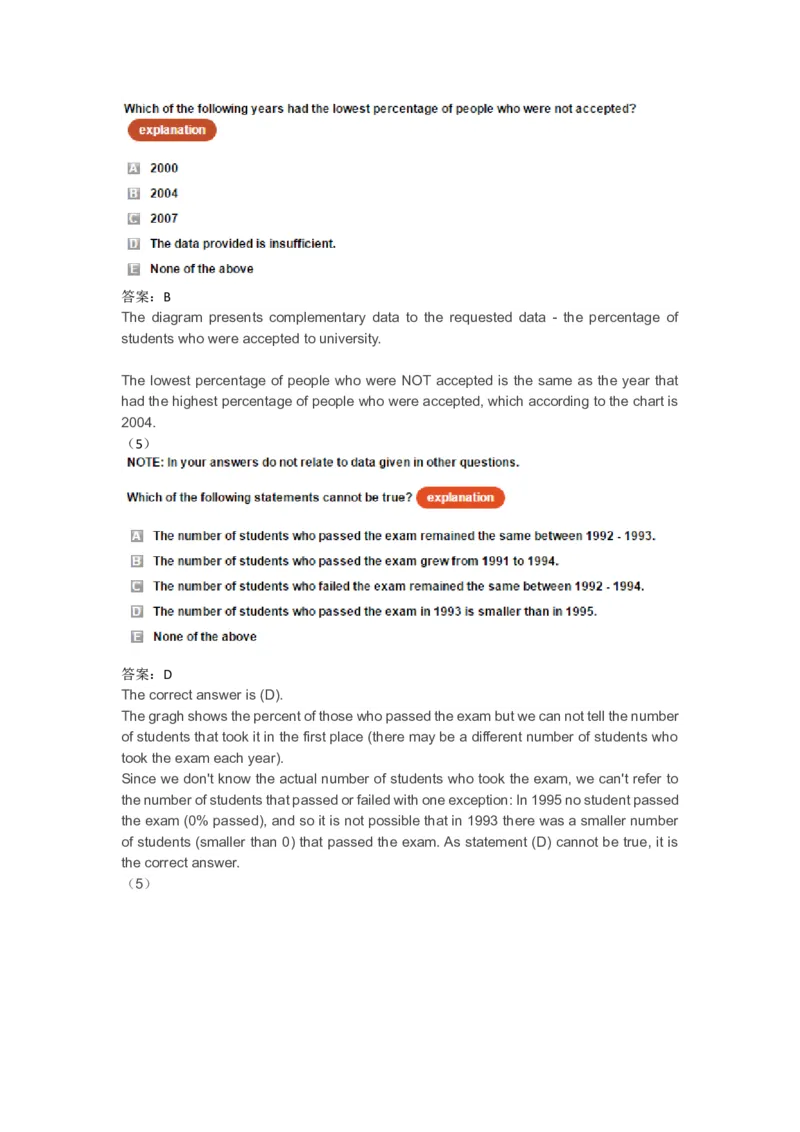
答案:D
The correct answer is (D).
The gragh shows the percent of those who passed the exam but we can not tell the number
of students that took it in the first place (there may be a different number of students who
took the exam each year).
Since we don't know the actual number of students who took the exam, we can't refer to
the number of students that passed or failed with one exception: In 1995 no student passed
the exam (0% passed), and so it is not possible that in 1993 there was a smaller number
of students (smaller than 0) that passed the exam. As statement (D) cannot be true, it is
the correct answer.
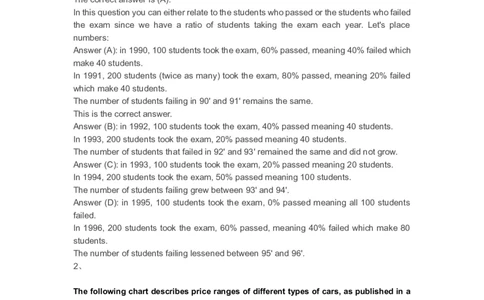
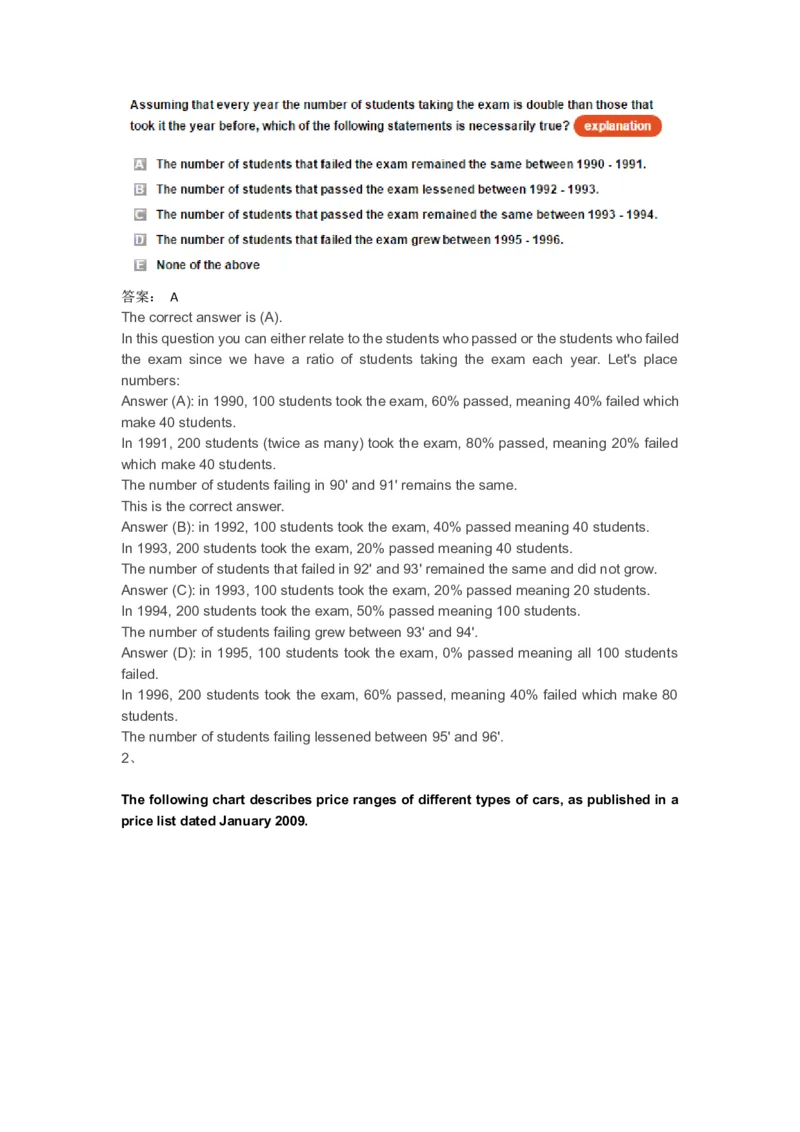
(5)答案: A
The correct answer is (A).
In this question you can either relate to the students who passed or the students who failed
the exam since we have a ratio of students taking the exam each year. Let's place
numbers:
Answer (A): in 1990, 100 students took the exam, 60% passed, meaning 40% failed which
make 40 students.
In 1991, 200 students (twice as many) took the exam, 80% passed, meaning 20% failed
which make 40 students.
The number of students failing in 90' and 91' remains the same.
This is the correct answer.
Answer (B): in 1992, 100 students took the exam, 40% passed meaning 40 students.
In 1993, 200 students took the exam, 20% passed meaning 40 students.
The number of students that failed in 92' and 93' remained the same and did not grow.
Answer (C): in 1993, 100 students took the exam, 20% passed meaning 20 students.
In 1994, 200 students took the exam, 50% passed meaning 100 students.
The number of students failing grew between 93' and 94'.
Answer (D): in 1995, 100 students took the exam, 0% passed meaning all 100 students
failed.
In 1996, 200 students took the exam, 60% passed, meaning 40% failed which make 80
students.
The number of students failing lessened between 95' and 96'.
2、
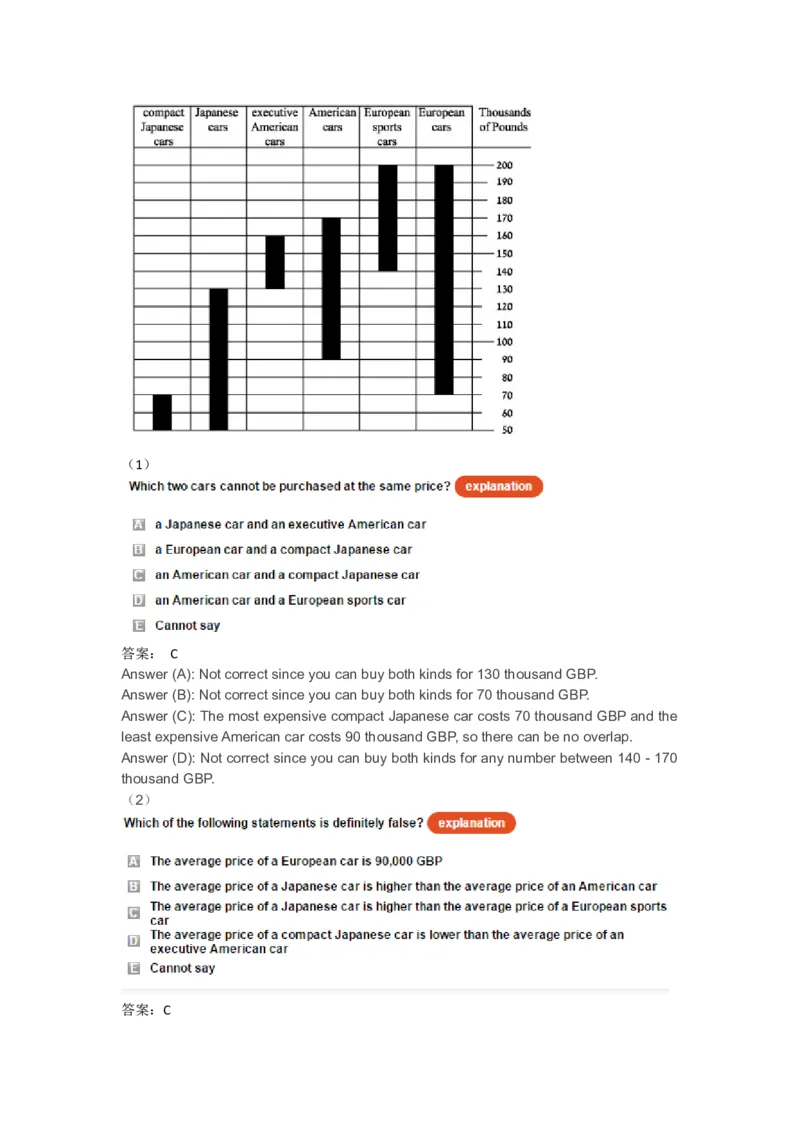
The following chart describes price ranges of different types of cars, as published in a
price list dated January 2009.(1)
答案: C
Answer (A): Not correct since you can buy both kinds for 130 thousand GBP.
Answer (B): Not correct since you can buy both kinds for 70 thousand GBP.
Answer (C): The most expensive compact Japanese car costs 70 thousand GBP and the
least expensive American car costs 90 thousand GBP, so there can be no overlap.
Answer (D): Not correct since you can buy both kinds for any number between 140 - 170
thousand GBP.
(2)
答案:CThe data in the graph state the possible price range for each type of car, yet we cannot tell
how many cars are there within the range. Therefore, we cannot know the exact average
of each type, only that it is somewhere within the range (except the top or bottom end).
The correct answer is (C).
Answer (A): The average can be anywhere in the range, including 90,000.
Answer (B): It is possible that most Japanese cars are relatively expensive and most
American cars are relatively not expensive and so the average price of Japanese cars is
higher than the average price of American cars.
Answer (C): There is no overlap between the two types of cars. Even if the average price
of a Japanese car is as high as possible (a bit less than 130,000) and the average price of
a European car is as low as possible (a bit higher than 140,000), this statement is still
incorrect.
Answer (D): This statement is always correct. Since all compact Japanese cars are less
expensive than all executive American cars the average price of the Japanese car is
necessarily lower than the average price of the executive American car.
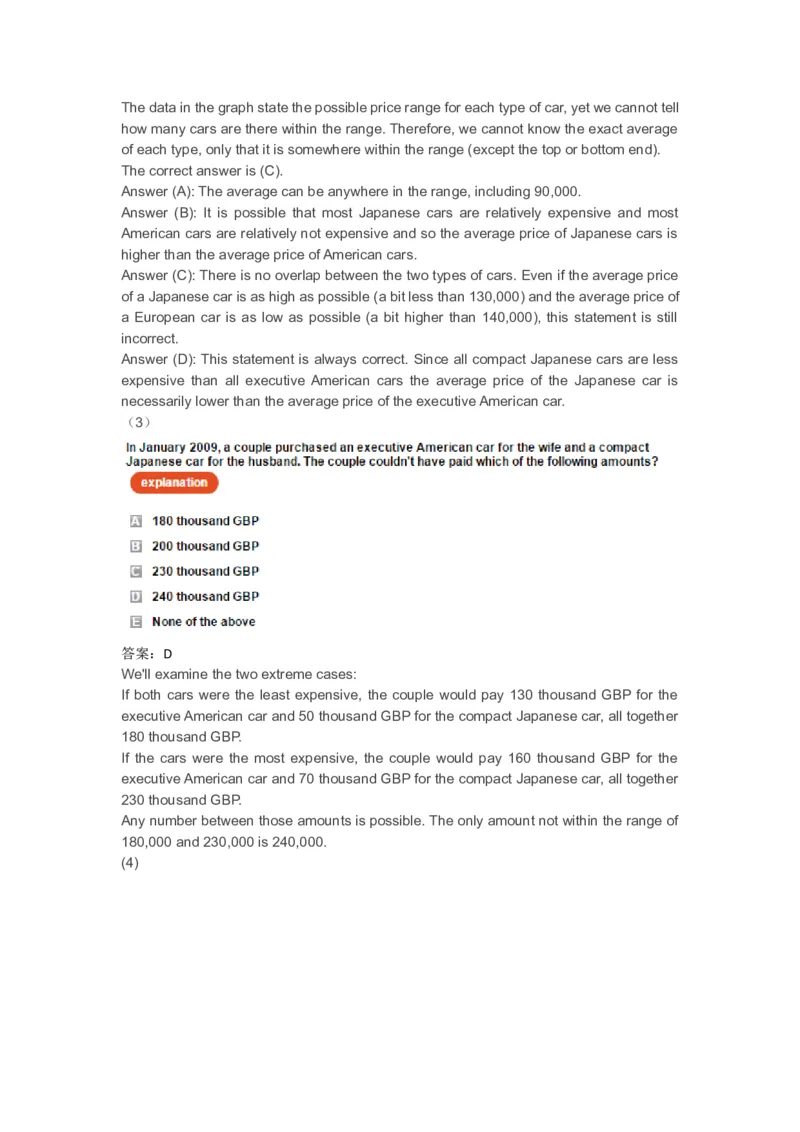
(3)
答案:D
We'll examine the two extreme cases:
If both cars were the least expensive, the couple would pay 130 thousand GBP for the
executive American car and 50 thousand GBP for the compact Japanese car, all together
180 thousand GBP.
If the cars were the most expensive, the couple would pay 160 thousand GBP for the
executive American car and 70 thousand GBP for the compact Japanese car, all together
230 thousand GBP.
Any number between those amounts is possible. The only amount not within the range of
180,000 and 230,000 is 240,000.
(4)答案:D
The greatest loss will occur if Dylan bought the most expensive car within the given range
(200 thousand GBP) and sold it for the cheapest price (120 thousand GBP). In this case
the loss is 80 thousand GBP (200-120).
The minimal loss will occur if Dylan bought the least expensive car within the range (140
thousand GBP) and sold it for the highest price possible (130 thousand GBP). In this case
the loss is 10 thousand GBP.
Please note that once reaching the maximal loss of 80 thousand GBP we got our answer
since only one of the answers has that number.
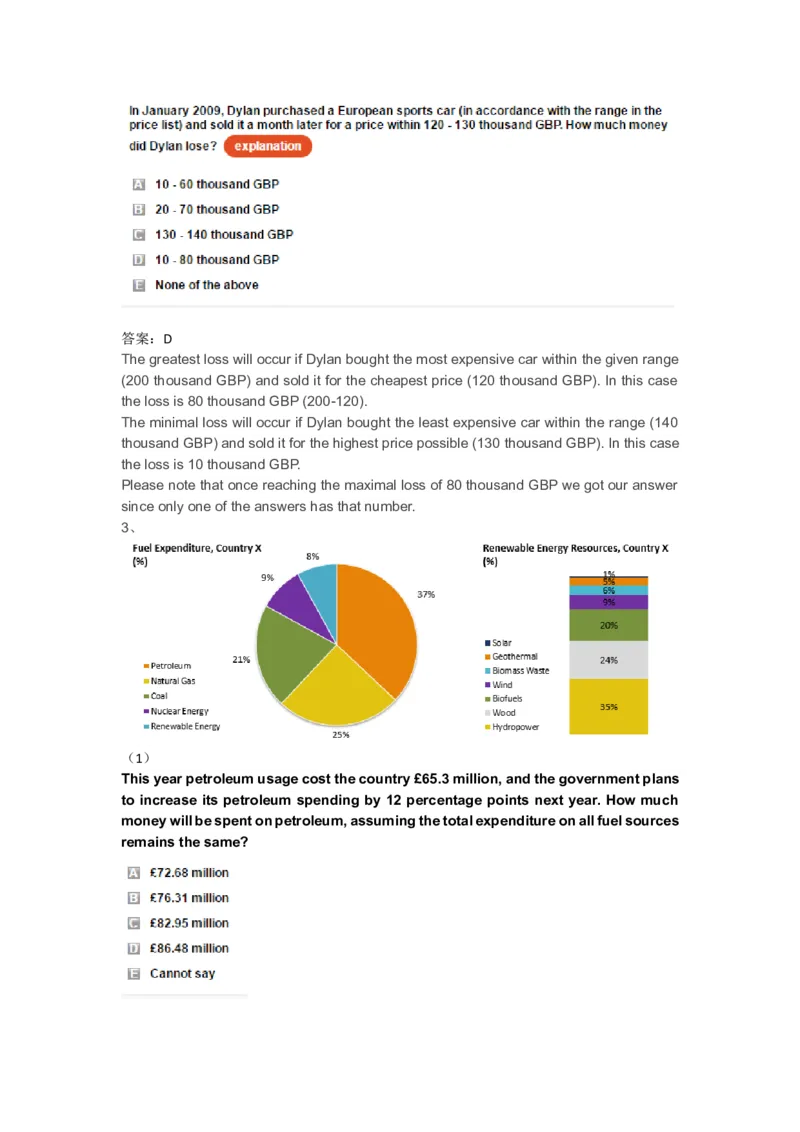
3、
(1)
This year petroleum usage cost the country £65.3 million, and the government plans
to increase its petroleum spending by 12 percentage points next year. How much
money will be spent on petroleum, assuming the total expenditure on all fuel sources
remains the same?答案:D
Notice: "Percentage Points" is a confusing term. It is an absolute increase in the percentage
number, not a relative increase!
Find the total expenditure on all fuel sources in the present year.
Let X represent the total expenditure on all fuel sources. Since Petroleum cost £65.3 million
and comprises 37% of total fuel expenditure we can calculate:
0.37 * X = £65.3 million --> X = £176.49 million.
We were told that next year the consumption of petroleum would increase by 12 percentage
points: 37%+12%=49%. (0.37+0.12) = 0.49.
Next we multiply the updated percentage by the total expenditure that remained constant,
in order to find its cost.
0.49*176.49 = £86.48 million.
4、
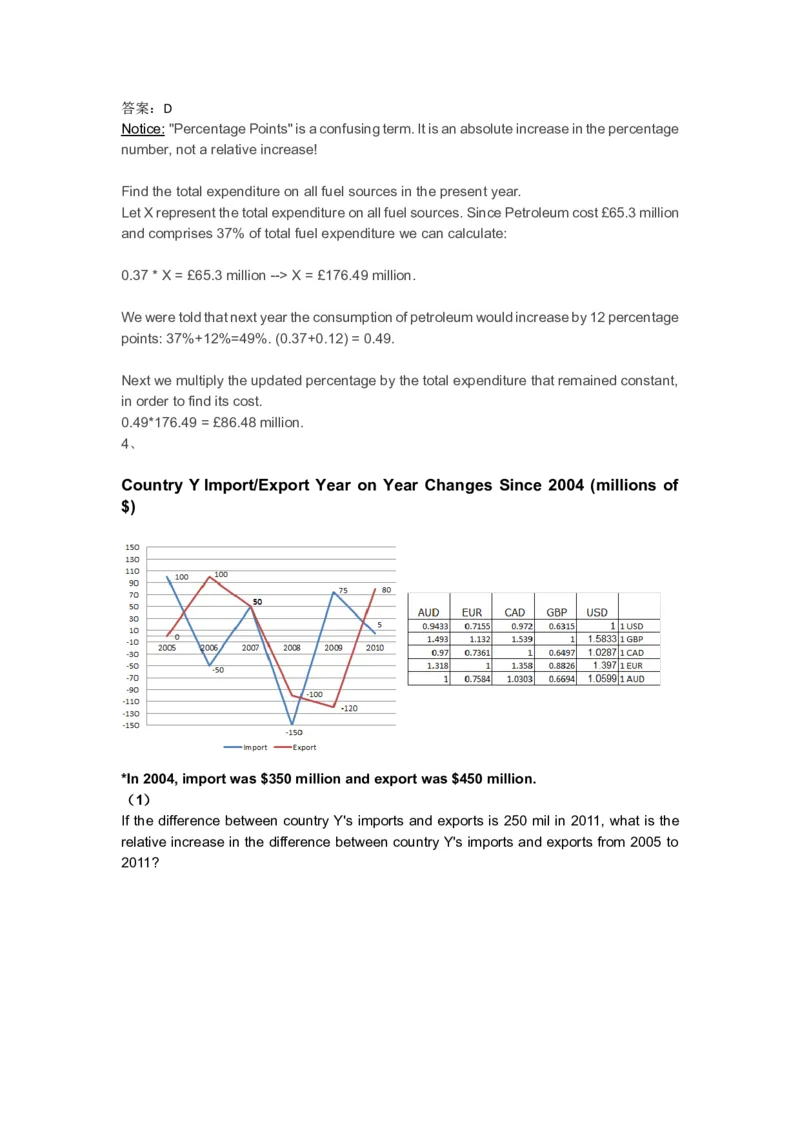
Country Y Import/Export Year on Year Changes Since 2004 (millions of
$)
*In 2004, import was $350 million and export was $450 million.
(1)
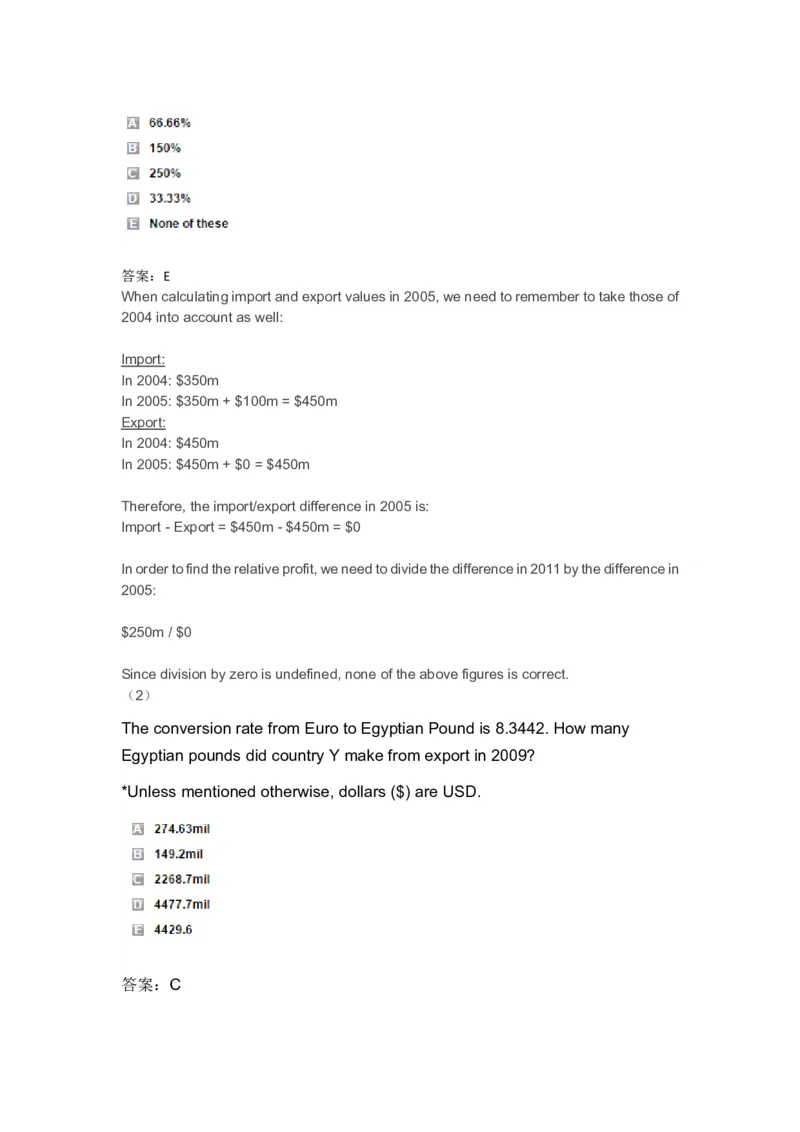
If the difference between country Y's imports and exports is 250 mil in 2011, what is the
relative increase in the difference between country Y's imports and exports from 2005 to
2011?答案:E
When calculating import and export values in 2005, we need to remember to take those of
2004 into account as well:
Import:
In 2004: $350m
In 2005: $350m + $100m = $450m
Export:
In 2004: $450m
In 2005: $450m + $0 = $450m
Therefore, the import/export difference in 2005 is:
Import - Export = $450m - $450m = $0
In order to find the relative profit, we need to divide the difference in 2011 by the difference in
2005:
$250m / $0
Since division by zero is undefined, none of the above figures is correct.
(2)
The conversion rate from Euro to Egyptian Pound is 8.3442. How many
Egyptian pounds did country Y make from export in 2009?
*Unless mentioned otherwise, dollars ($) are USD.
答案:CThe figures in the chart represent the changes in export, not the actual export values
each year. To find the actual export value in 2009, we have to start with the given export
for 2004 and then add-up the changes in each year until 2009. Thus:
Export incomes in 2009 are 450+0+100+50-100-120 = $380mil
Calculating the currency differences between US Dollars and Euros:
380*0.7155 = 271.89
And now to Egyptian Pounds:
271.89*8.3442 = 2268.7
Please note: The direction of the conversion can be easily determined by the leftmost
column. The "1" in front of each currency indicates that each row contains the conversion
rates from the left currency to the others. For example, the first row indicates the
conversion rates from USD to other currencies. Thus, 1 USD equals 0.7155 EUR.
4、
(1)
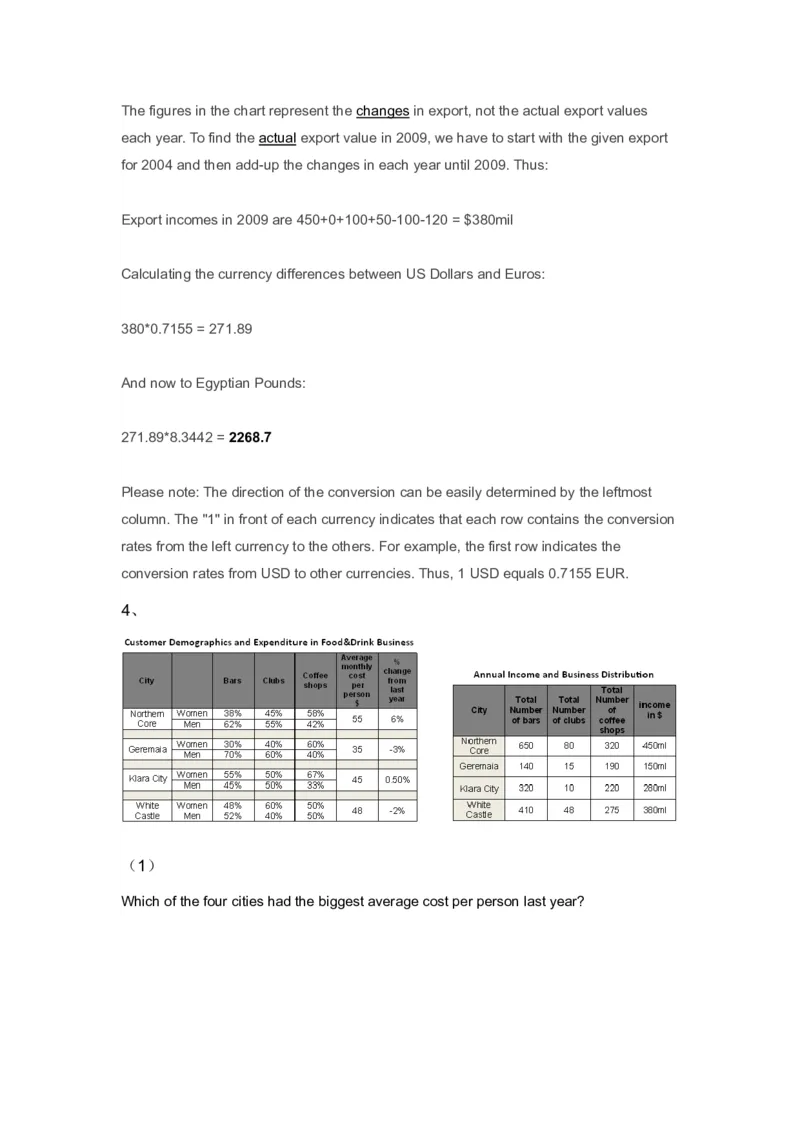
Which of the four cities had the biggest average cost per person last year?答案:C
Given the percent changes from last year, calculate the average expenditures.
Northern Core's is highest: 55/1.06=51.88
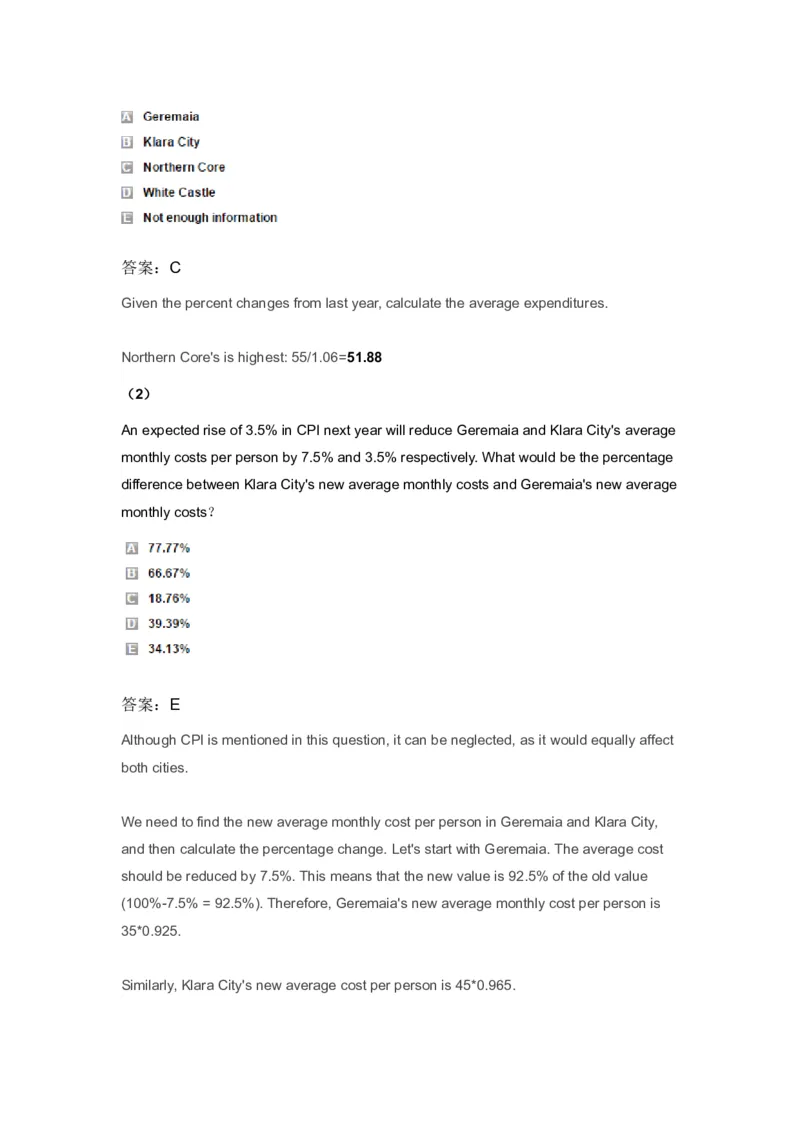
(2)
An expected rise of 3.5% in CPI next year will reduce Geremaia and Klara City's average
monthly costs per person by 7.5% and 3.5% respectively. What would be the percentage
difference between Klara City's new average monthly costs and Geremaia's new average
monthly costs?
答案:E
Although CPI is mentioned in this question, it can be neglected, as it would equally affect
both cities.
We need to find the new average monthly cost per person in Geremaia and Klara City,
and then calculate the percentage change. Let's start with Geremaia. The average cost
should be reduced by 7.5%. This means that the new value is 92.5% of the old value
(100%-7.5% = 92.5%). Therefore, Geremaia's new average monthly cost per person is
35*0.925.
Similarly, Klara City's new average cost per person is 45*0.965.In order to find the percentage change, we divide Klara City's new value by Geremaia's
new value, and subtract 1. This leaves us with:
[(45*0.965) / (35*0.925)]-1= 0.3413= 34.13%
5、
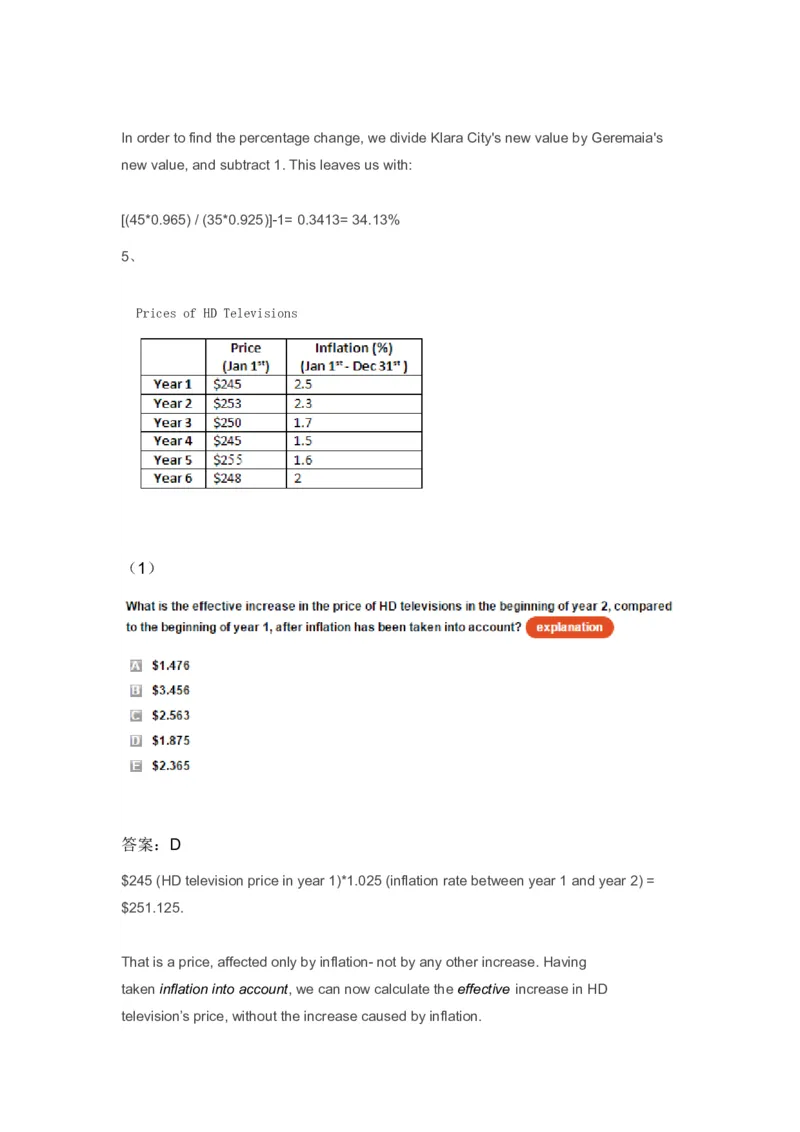
Prices of HD Televisions
(1)
答案:D
$245 (HD television price in year 1)*1.025 (inflation rate between year 1 and year 2) =
$251.125.
That is a price, affected only by inflation- not by any other increase. Having
taken inflation into account, we can now calculate the effective increase in HD
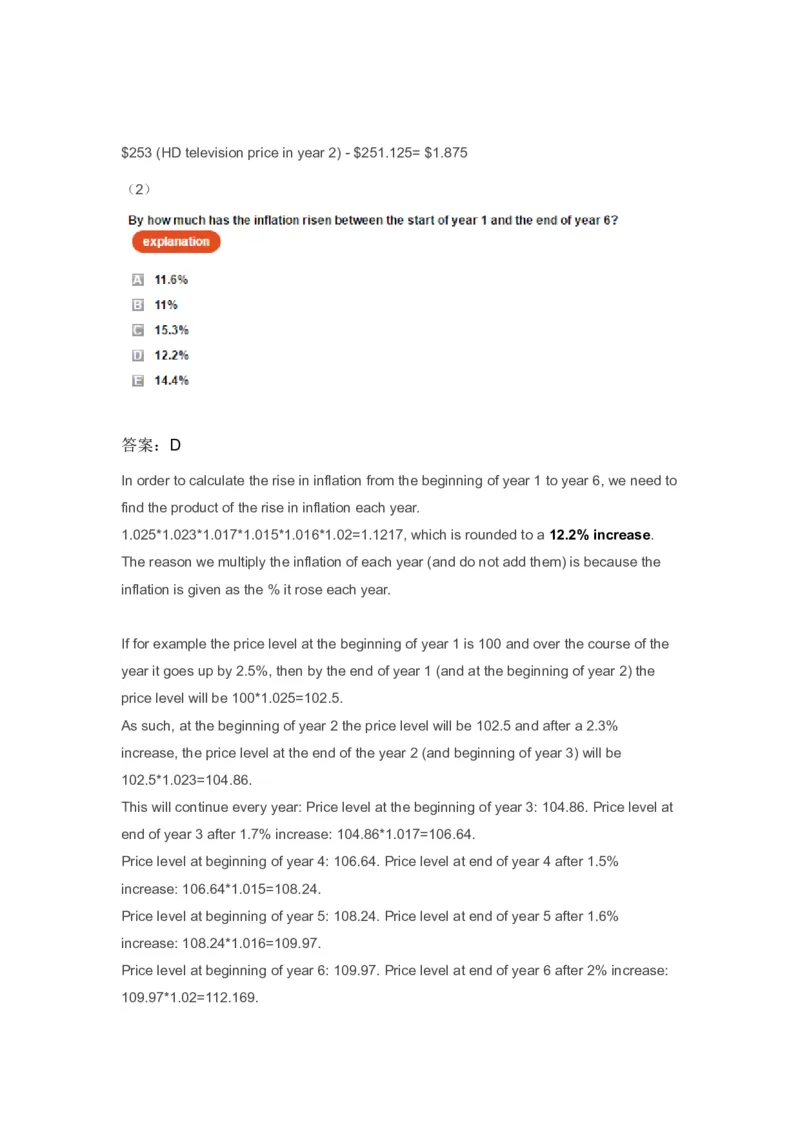
television’s price, without the increase caused by inflation.$253 (HD television price in year 2) - $251.125= $1.875
(2)
答案:D
In order to calculate the rise in inflation from the beginning of year 1 to year 6, we need to
find the product of the rise in inflation each year.
1.025*1.023*1.017*1.015*1.016*1.02=1.1217, which is rounded to a 12.2% increase.
The reason we multiply the inflation of each year (and do not add them) is because the
inflation is given as the % it rose each year.
If for example the price level at the beginning of year 1 is 100 and over the course of the
year it goes up by 2.5%, then by the end of year 1 (and at the beginning of year 2) the
price level will be 100*1.025=102.5.
As such, at the beginning of year 2 the price level will be 102.5 and after a 2.3%
increase, the price level at the end of the year 2 (and beginning of year 3) will be
102.5*1.023=104.86.
This will continue every year: Price level at the beginning of year 3: 104.86. Price level at
end of year 3 after 1.7% increase: 104.86*1.017=106.64.
Price level at beginning of year 4: 106.64. Price level at end of year 4 after 1.5%
increase: 106.64*1.015=108.24.
Price level at beginning of year 5: 108.24. Price level at end of year 5 after 1.6%
increase: 108.24*1.016=109.97.
Price level at beginning of year 6: 109.97. Price level at end of year 6 after 2% increase:
109.97*1.02=112.169.We can see that from the beginning of year 1 to the end of year 6 the price level rose
from 100 to 112.16 which (rounded to the nearest tenth) is a 12.2% increase.
5、
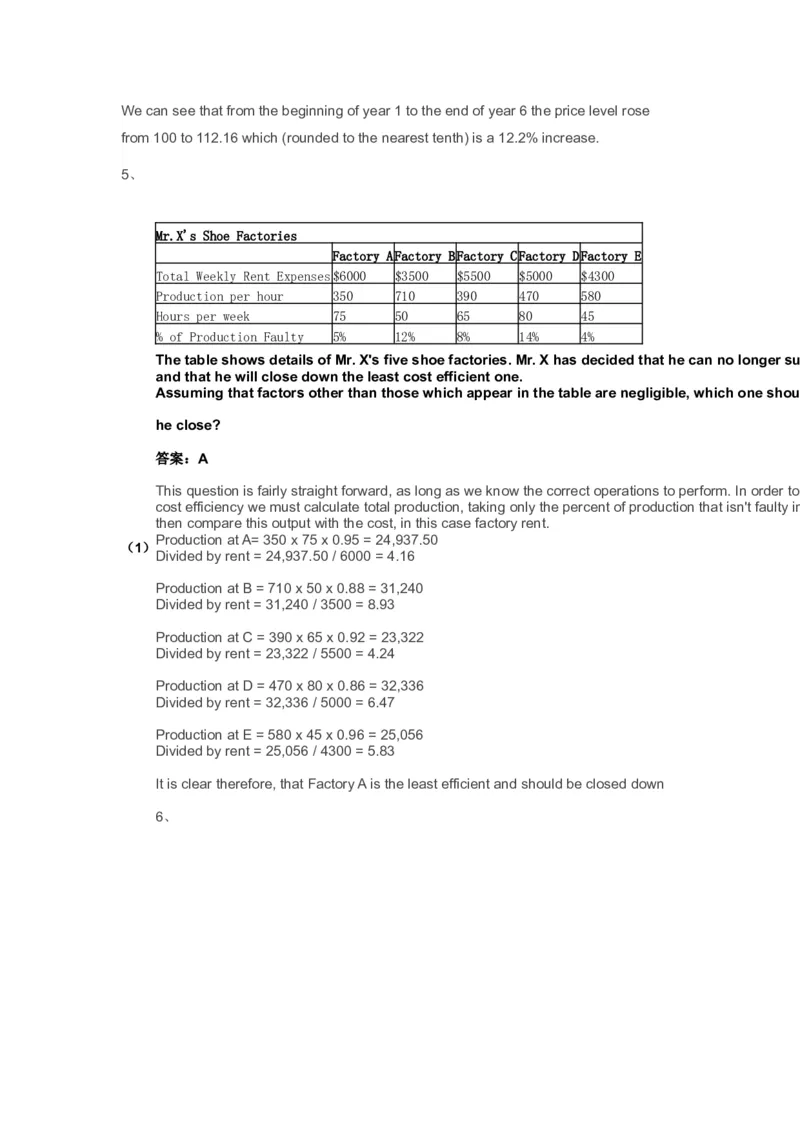
Mr.X's Shoe Factories
Factory AFactory BFactory CFactory DFactory E
Total Weekly Rent Expenses$6000 $3500 $5500 $5000 $4300
Production per hour 350 710 390 470 580
Hours per week 75 50 65 80 45
% of Production Faulty 5% 12% 8% 14% 4%
The table shows details of Mr. X's five shoe factories. Mr. X has decided that he can no longer support five factories
and that he will close down the least cost efficient one.
Assuming that factors other than those which appear in the table are negligible, which one should
he close?
答案:A
This question is fairly straight forward, as long as we know the correct operations to perform. In order to compare levels of
cost efficiency we must calculate total production, taking only the percent of production that isn't faulty into account. We must
then compare this output with the cost, in this case factory rent.
Production at A= 350 x 75 x 0.95 = 24,937.50
(1)
Divided by rent = 24,937.50 / 6000 = 4.16
Production at B = 710 x 50 x 0.88 = 31,240
Divided by rent = 31,240 / 3500 = 8.93
Production at C = 390 x 65 x 0.92 = 23,322
Divided by rent = 23,322 / 5500 = 4.24
Production at D = 470 x 80 x 0.86 = 32,336
Divided by rent = 32,336 / 5000 = 6.47
Production at E = 580 x 45 x 0.96 = 25,056
Divided by rent = 25,056 / 4300 = 5.83
It is clear therefore, that Factory A is the least efficient and should be closed down
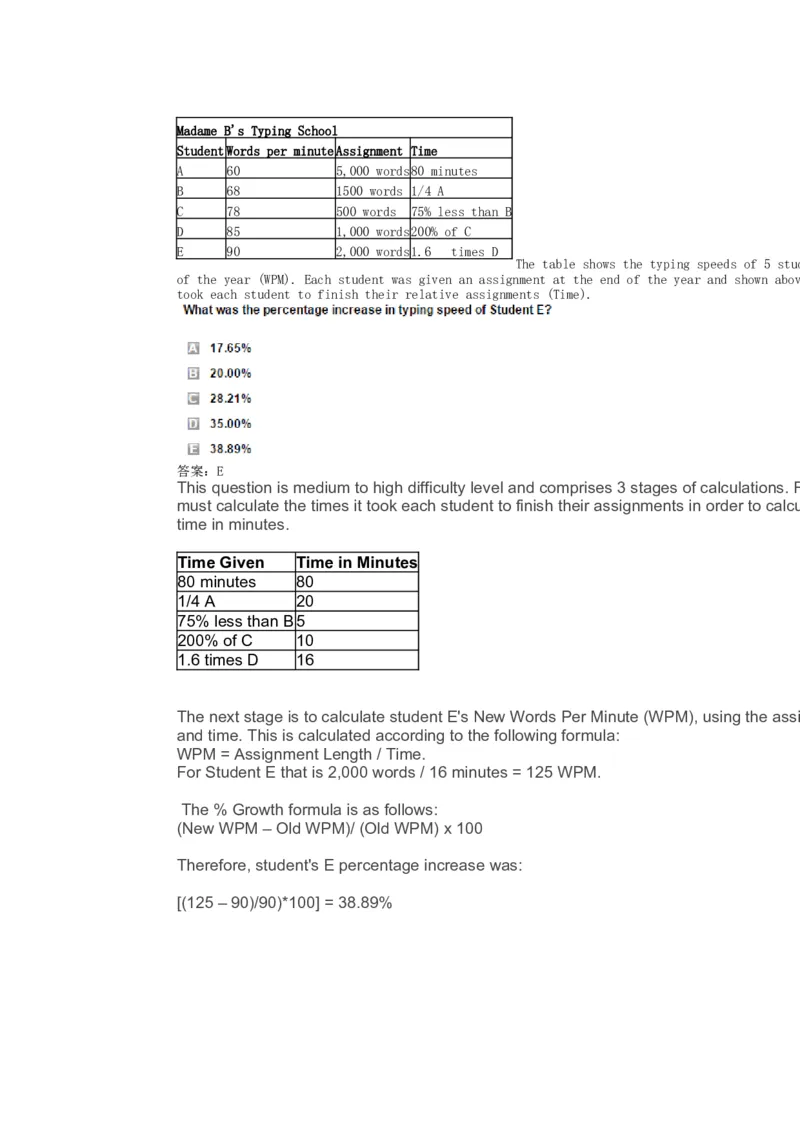
6、Madame B's Typing School
StudentWords per minuteAssignment Time
A 60 5,000 words80 minutes
B 68 1500 words 1/4 A
C 78 500 words 75% less than B
D 85 1,000 words200% of C
E 90 2,000 words1.6 times D
The table shows the typing speeds of 5 students at the start
of the year (WPM). Each student was given an assignment at the end of the year and shown above are the times it
took each student to finish their relative assignments (Time).
答案:E
This question is medium to high difficulty level and comprises 3 stages of calculations. First of all we
must calculate the times it took each student to finish their assignments in order to calculate student E's
time in minutes.
Time Given Time in Minutes
80 minutes 80
1/4 A 20
75% less than B5
200% of C 10
1.6 times D 16
The next stage is to calculate student E's New Words Per Minute (WPM), using the assignment length
and time. This is calculated according to the following formula:
WPM = Assignment Length / Time.
For Student E that is 2,000 words / 16 minutes = 125 WPM.
The % Growth formula is as follows:
(New WPM – Old WPM)/ (Old WPM) x 100
Therefore, student's E percentage increase was:
[(125 – 90)/90)*100] = 38.89%

