
文档内容
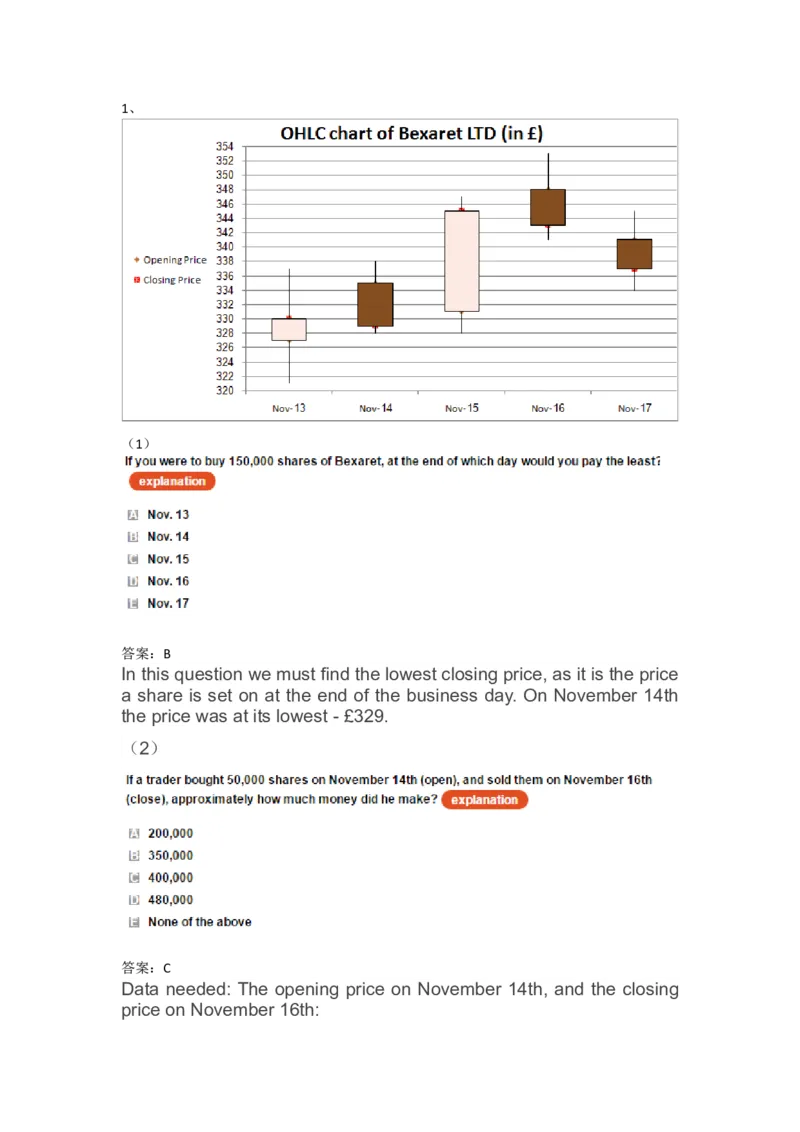
1、
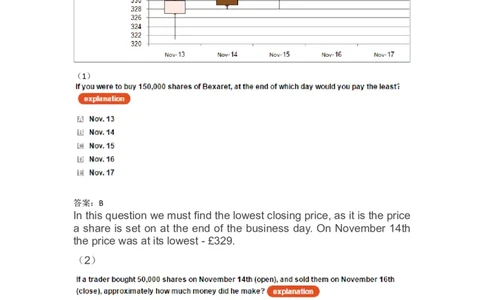
(1)
答案:B
In this question we must find the lowest closing price, as it is the price
a share is set on at the end of the business day. On November 14th
the price was at its lowest - £329.
(2)
答案:C
Data needed: The opening price on November 14th, and the closing
price on November 16th:Opening 14th: 335, Closing 16th: 343.
We then find the difference in prices between the dates. Notice you do
not need to calculate each transaction, and can instead multiply the
number of shares by the difference between the value of the share on
each day.
(343-335)*50,000 = 400,000.
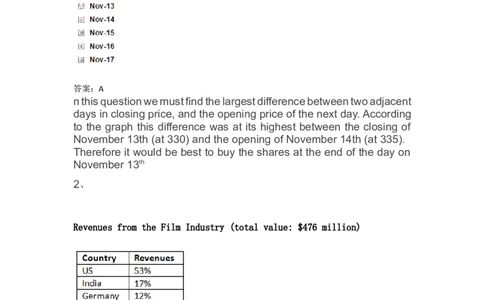
(3)
答案:A
n this question we must find the largest difference between two adjacent
days in closing price, and the opening price of the next day. According
to the graph this difference was at its highest between the closing of
November 13th (at 330) and the opening of November 14th (at 335).
Therefore it would be best to buy the shares at the end of the day on
November 13th
2、
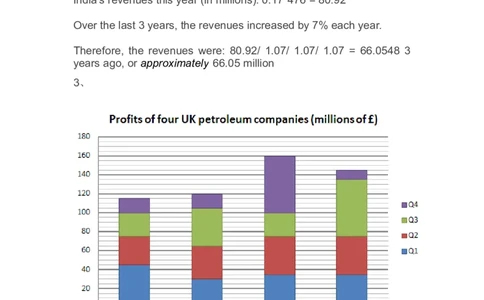
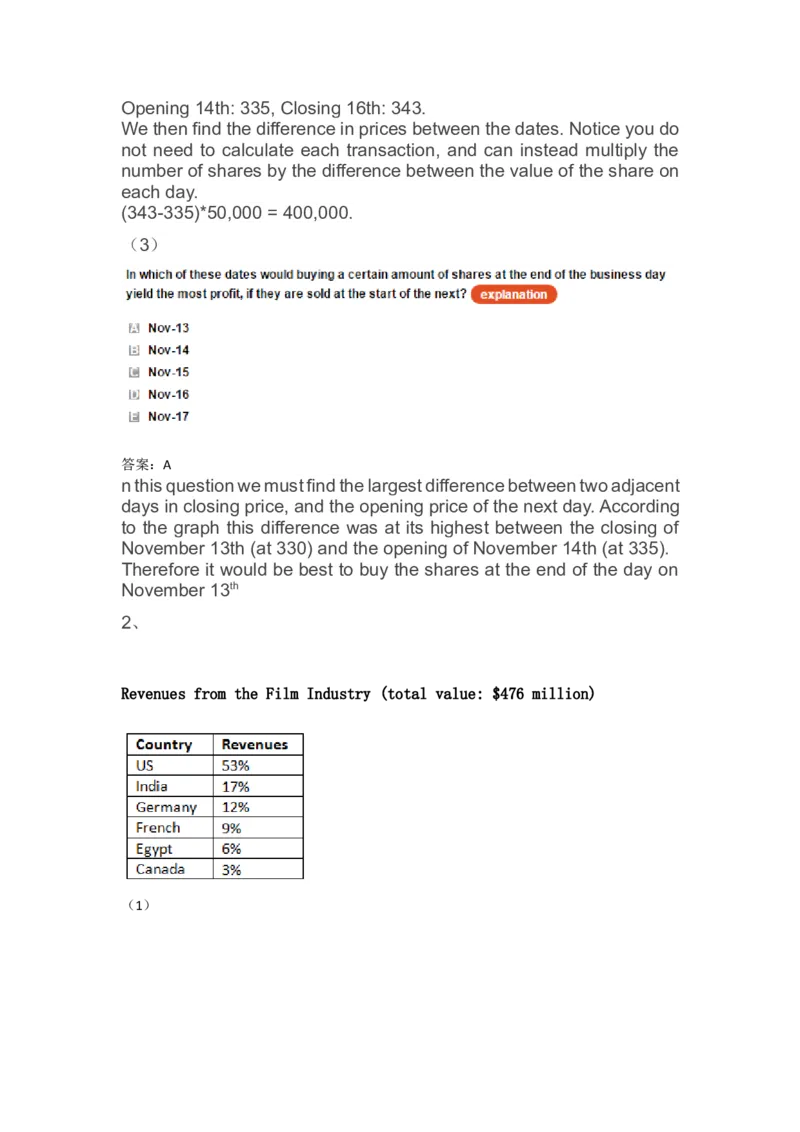
Revenues from the Film Industry (total value: $476 million)
(1)答案:D
India’s revenues this year (in millions): 0.17*476 = 80.92
Over the last 3 years, the revenues increased by 7% each year.
Therefore, the revenues were: 80.92/ 1.07/ 1.07/ 1.07 = 66.0548 3
years ago, or approximately 66.05 million
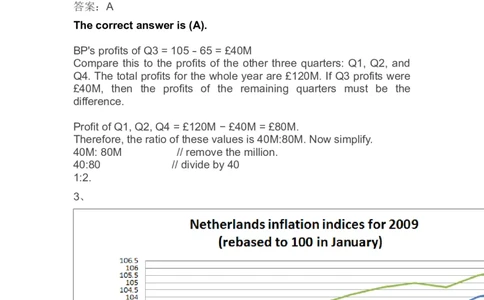
3、
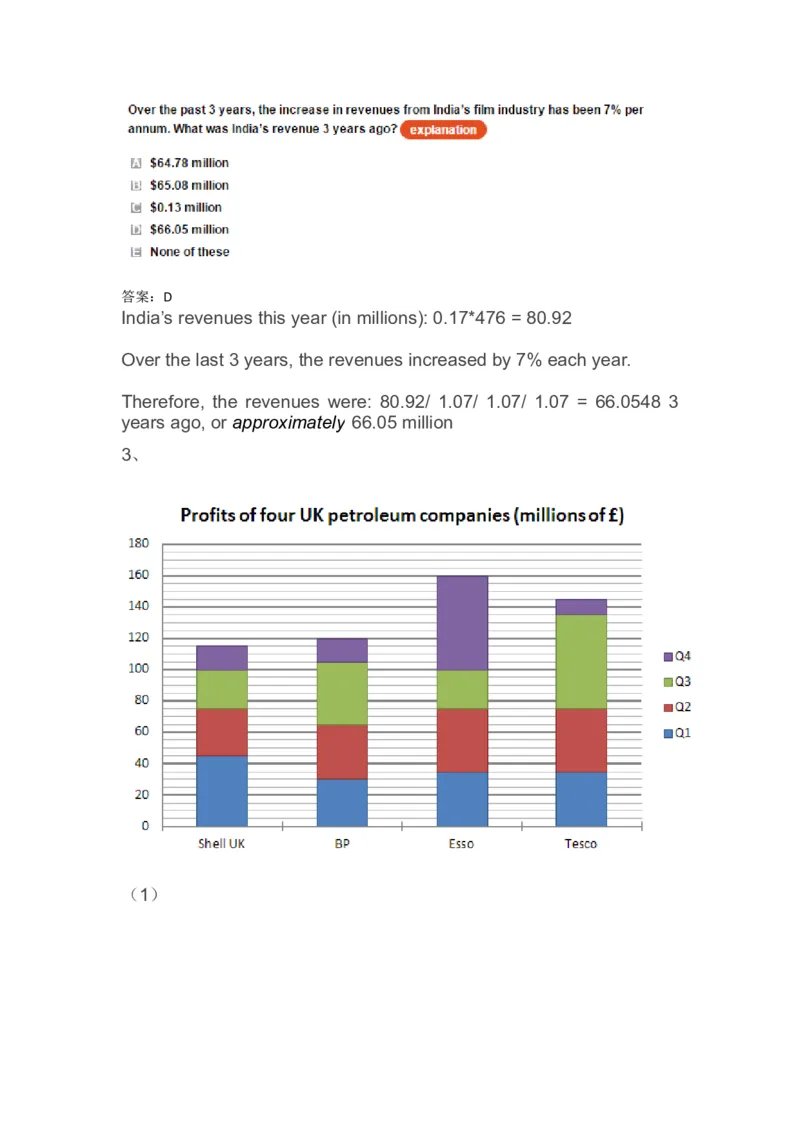
(1)答案:A
The correct answer is (A).
BP's profits of Q3 = 105 − 65 = £40M
Compare this to the profits of the other three quarters: Q1, Q2, and
Q4. The total profits for the whole year are £120M. If Q3 profits were
£40M, then the profits of the remaining quarters must be the
difference.
Profit of Q1, Q2, Q4 = £120M − £40M = £80M.
Therefore, the ratio of these values is 40M:80M. Now simplify.
40M: 80M // remove the million.
40:80 // divide by 40
1:2.
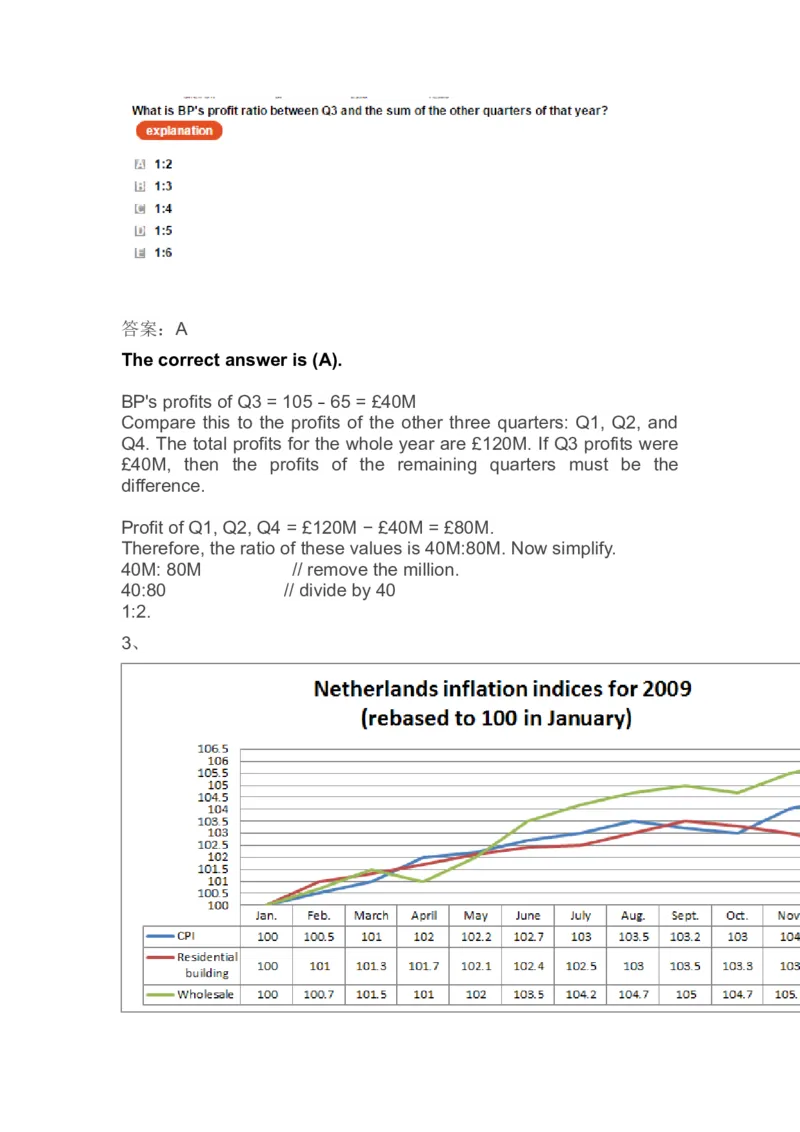
3、* CPI=Consumer Price Index
(1)
答案: D
The general formula to calculate a percentage change is:
(New - Old) / Old.
(New - Old) represents the absolute change in values. Both August
and December, for instance, show the same absolute change of 0.5.
However, the change is always relative to the older value, which is
larger for December (103) than it is for August (102.5). This means that
the percentage change in August is larger.
The same pattern can be applied when comparing the rest of the
answers.
May: (New - Old) / Old = (102.1 - 101.7) / 101.7 = 0.003933 ~
0.3933%
April: (New - Old) / Old = (101.7 - 101.3) / 101.3 = 0.003949 ~
0.3949%
November: (New - Old) / Old = (103 - 103.3) / 103.3 = -0.002904 ~
-0.2904%
August: (New - Old) / Old = (103 - 102.5) / 102.5 = 0.004878 ~
0.4878%
December: (New - Old) / Old = (102.5 - 103) / 103 = -0.004854 ~
-0.4854%
Therefore, the largest percentage change was in August.
Tip: Those of you who are baffled by the topic of inflation, please refer
to the video tutorial on inflation, to be found in the "Video Tutorials"
category in your main account.
(2)答案:A
The rise in index value from March to September indicates that inflation
caused a decrease in the value of money, and an increase in price
levels.
Check for the index differences:
March: 101.3
September: 103.5
The relative difference between September and March can be obtained
by dividing the inflation index of September by that of March.
(103.5/101.3)*352,220=359,869.4=359,869.
In addition, we have added to this question the element of accuracy.
Since you were not asked to find an approximate value, you must
check each digit in your calculation and round numbers accordingly.
Answer choice E is a distracter.
Tip: Those of you who are baffled by the topic of inflation, please refer
to the video tutorial on inflation, to be found in the "Video Tutorials"
category in your main account.
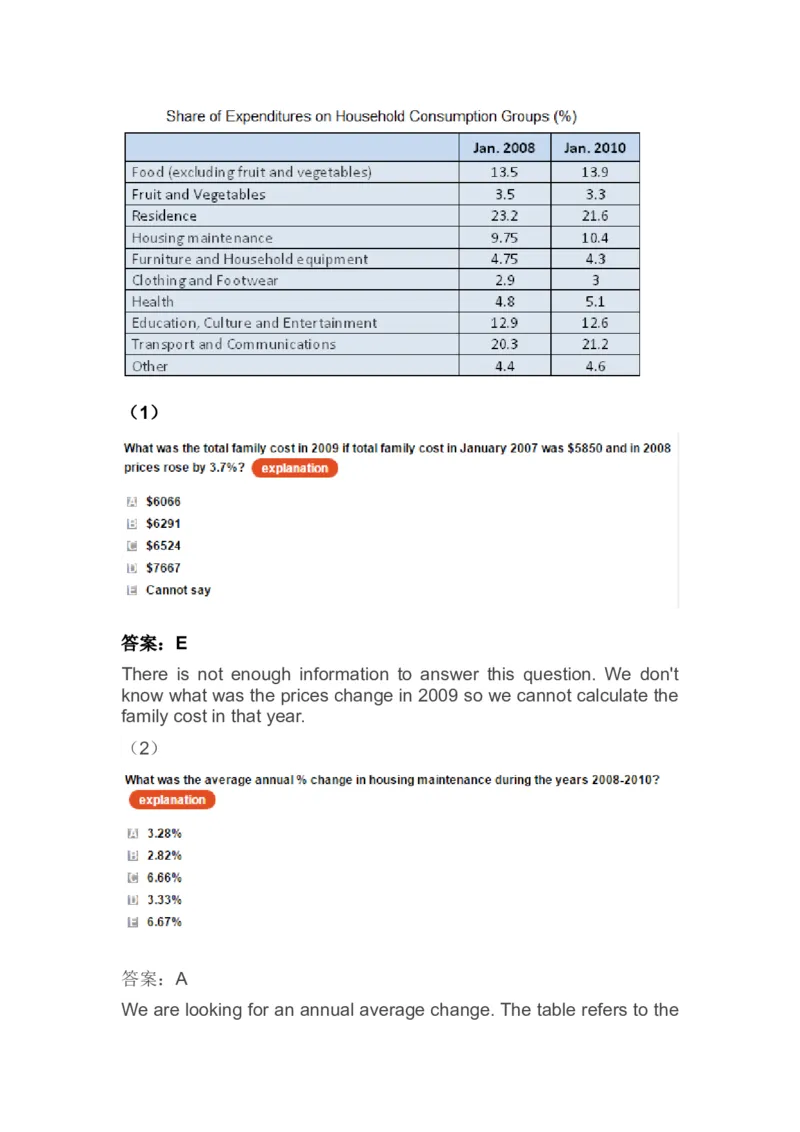
4、(1)
答案:E
There is not enough information to answer this question. We don't
know what was the prices change in 2009 so we cannot calculate the
family cost in that year.
(2)
答案:A
We are looking for an annual average change. The table refers to theyears 2008 and 2010 (and not to 2009). The average annual change
is the change that took place "twice" during a two-year period.
The relative change from 2010 to 2008 is: 10.4/9.75=1.066666667.
How do we calculate the annual average change? Note that treating
this as simple average and dividing by two would be a mistake, as
changes in percentages over years are treated like interest, i.e. the
change from 2009 to 2010 applies not only over the base-rate of 2008,
but also on the change from 2008 to 2009.
Since we have 2 annual changes from 2008 to 2010, we need to
calculate a squared root rather than a simple division by 2.
We take the squared root of 1.066666667 ,which is 1.0328.
Now we can calculate the average annual % change:
(1.0328-1)*100=3.28%
Expansion: If the question had given information about a 3-year period,
and we had known only the total relative change, we could calculate
the annual average change by taking the 3rd root. A 4-year period -->
4th root, etc.
5、
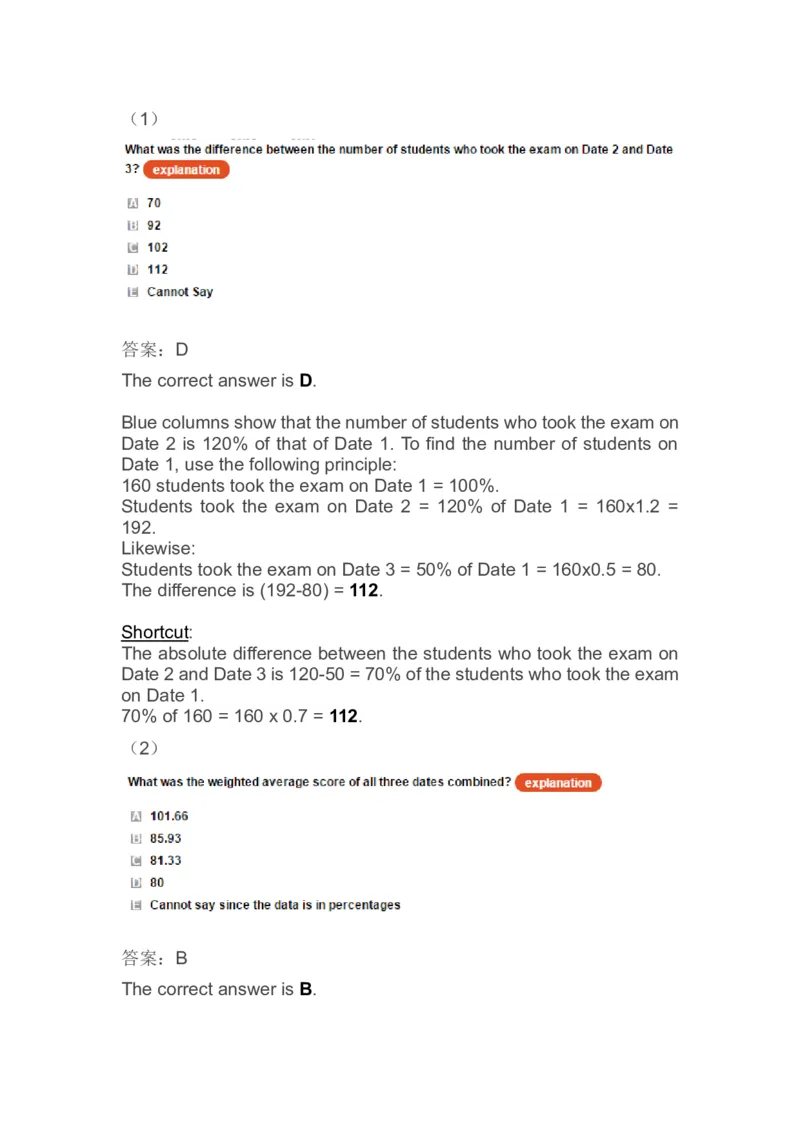
The yearly Maths exam was administered three times. From a total of 432 students, 160
students took the exam on Date 1 and gained an average score of 80. The statistics of
Date 1 were used as comparison measures to the other two dates, as seen below.(1)
答案:D
The correct answer is D.
Blue columns show that the number of students who took the exam on
Date 2 is 120% of that of Date 1. To find the number of students on
Date 1, use the following principle:
160 students took the exam on Date 1 = 100%.
Students took the exam on Date 2 = 120% of Date 1 = 160x1.2 =
192.
Likewise:
Students took the exam on Date 3 = 50% of Date 1 = 160x0.5 = 80.
The difference is (192-80) = 112.
Shortcut:
The absolute difference between the students who took the exam on
Date 2 and Date 3 is 120-50 = 70% of the students who took the exam
on Date 1.
70% of 160 = 160 x 0.7 = 112.
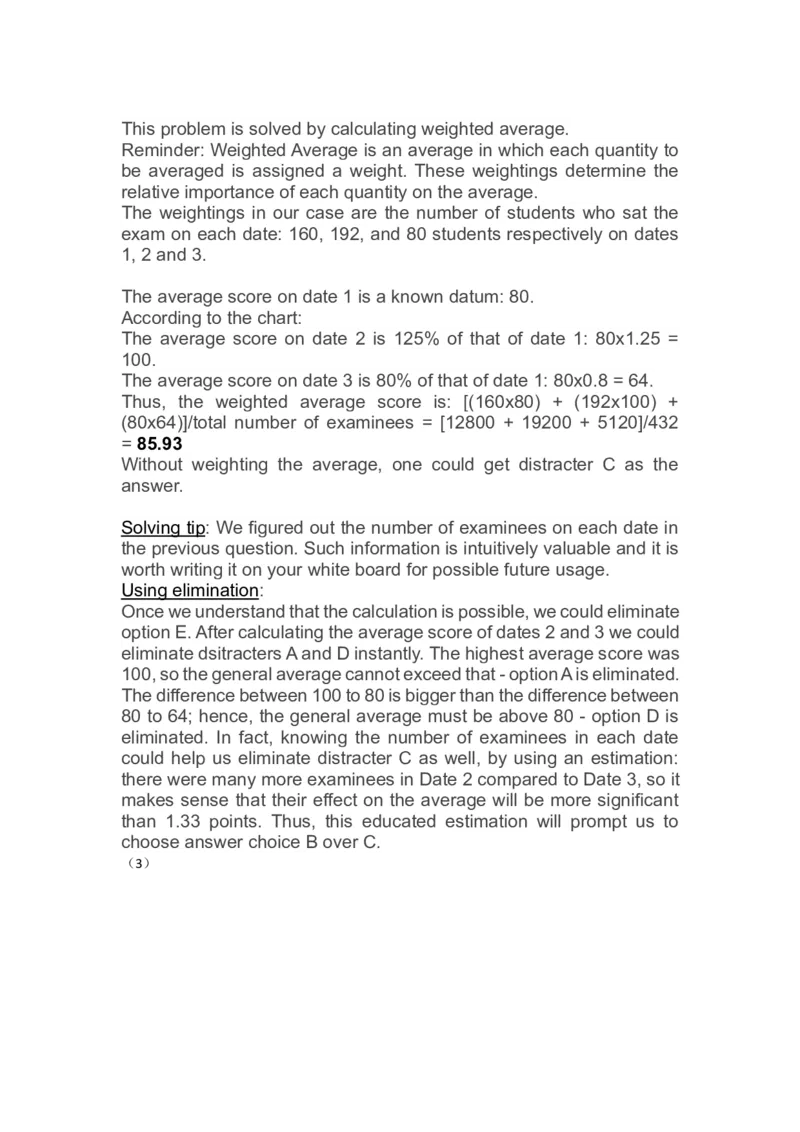
(2)
答案:B
The correct answer is B.This problem is solved by calculating weighted average.
Reminder: Weighted Average is an average in which each quantity to
be averaged is assigned a weight. These weightings determine the
relative importance of each quantity on the average.
The weightings in our case are the number of students who sat the
exam on each date: 160, 192, and 80 students respectively on dates
1, 2 and 3.
The average score on date 1 is a known datum: 80.
According to the chart:
The average score on date 2 is 125% of that of date 1: 80x1.25 =
100.
The average score on date 3 is 80% of that of date 1: 80x0.8 = 64.
Thus, the weighted average score is: [(160x80) + (192x100) +
(80x64)]/total number of examinees = [12800 + 19200 + 5120]/432
= 85.93
Without weighting the average, one could get distracter C as the
answer.
Solving tip: We figured out the number of examinees on each date in
the previous question. Such information is intuitively valuable and it is
worth writing it on your white board for possible future usage.
Using elimination:
Once we understand that the calculation is possible, we could eliminate
option E. After calculating the average score of dates 2 and 3 we could
eliminate dsitracters A and D instantly. The highest average score was
100, so the general average cannot exceed that - option A is eliminated.
The difference between 100 to 80 is bigger than the difference between
80 to 64; hence, the general average must be above 80 - option D is
eliminated. In fact, knowing the number of examinees in each date
could help us eliminate distracter C as well, by using an estimation:
there were many more examinees in Date 2 compared to Date 3, so it
makes sense that their effect on the average will be more significant
than 1.33 points. Thus, this educated estimation will prompt us to
choose answer choice B over C.
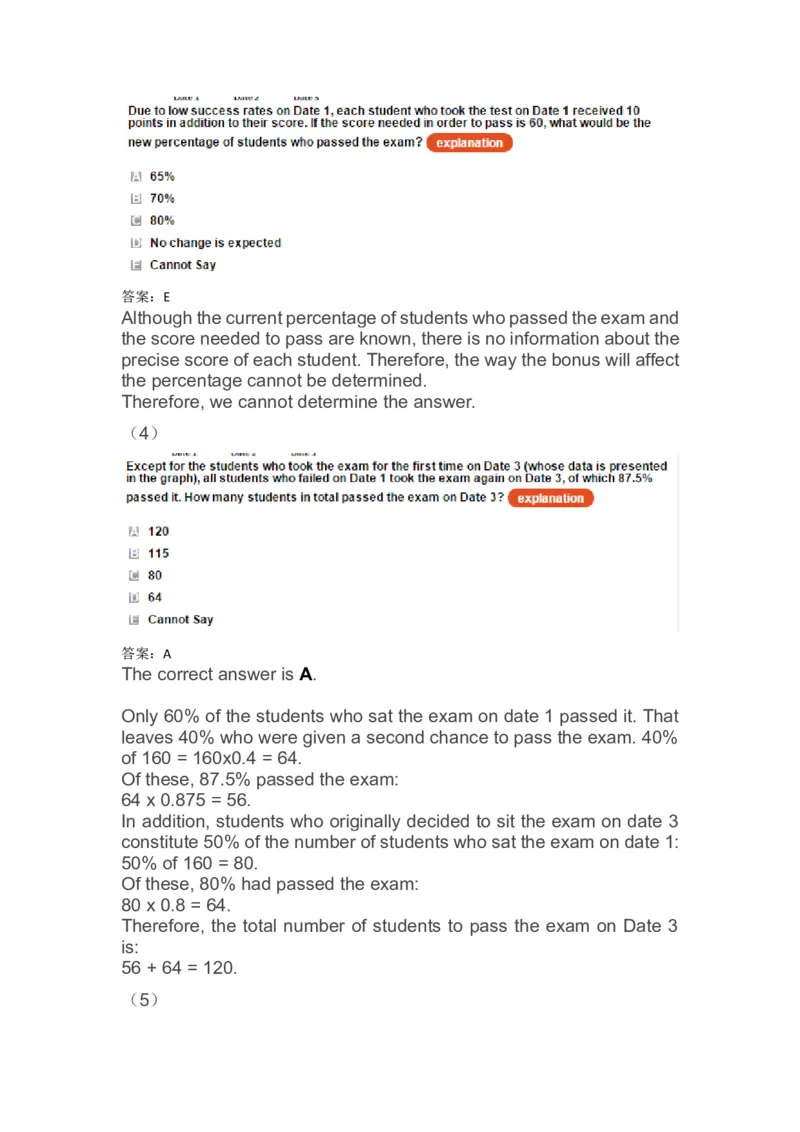
(3)答案:E
Although the current percentage of students who passed the exam and
the score needed to pass are known, there is no information about the
precise score of each student. Therefore, the way the bonus will affect
the percentage cannot be determined.
Therefore, we cannot determine the answer.
(4)
答案:A
The correct answer is A.
Only 60% of the students who sat the exam on date 1 passed it. That
leaves 40% who were given a second chance to pass the exam. 40%
of 160 = 160x0.4 = 64.
Of these, 87.5% passed the exam:
64 x 0.875 = 56.
In addition, students who originally decided to sit the exam on date 3
constitute 50% of the number of students who sat the exam on date 1:
50% of 160 = 80.
Of these, 80% had passed the exam:
80 x 0.8 = 64.
Therefore, the total number of students to pass the exam on Date 3
is:
56 + 64 = 120.
(5)答案:E
The correct answer is E
The proportion of senior citizens in Great Britain is 0.42*0.1=0.042
The proportion of young citizens in the Netherlands is
0.08*0.6*0.25=0.012
Moving the decimal point three places to the right will give 42:12 =(/2)=
21:6 =(/3)= 7:2.
Remember that any ratio has directionality, thus answer choice E is
correct.
6、
A marital status survey in the UK was conducted by one of the
offices of the British Census.
Citizens who were born in the years 1946-1960 ("Year") were
asked about their marital status at the ages of 20 - 49 ("Age").
The survey included an equal number of participants from each
year of birth mentioned in the table.
Seven percent of the population across all categories were
widows/ers.答案:E
The correct answer is E – the year 2009.
This question, not a common UKCAT question, was issued in order to
examine your table comprehension. Neither the categories nor the title
provide information about the specific time at which the survey was
conducted, so in order to deduce this information we must combine the
information from the table and that of the additional passage.
The passage tells us that participants were from all available years that
appear in the "Year" column. We look at the table and find that
the latest relevant year of birth mentioned is 1960. In addition, we find
that eldest relevant age was 49.
If someone was born in 1960 and is now 49 years old, then the current
year is:
1960 + 49 = 2009.
(2)
A marital status survey in the UK was conducted by one of the
offices of the British Census.
Citizens who were born in the years 1946-1960 ("Year") were asked
about their marital status throughout their lives, starting at the
age of 20 ("Age").
The survey included an equal number of participants from each
year of birth mentioned in the table. All participants were above
the age of 20. Seven per cent of the population across all
categories were widows/ers.答案:C
This question demands a simple average, yet the challenge is to include
only relevant data.
The sub-group of people who were born in 1946-1950 aged 40-44 in
1990 [calculation of the range: 1990-1946 = 44; 1990-1950 = 40 -->
ages 40-44]. According to the table, from that group at these ages 79%
were married.
In the same manner, the sub-group of people who were born in 1951-
1955 aged 35-39 in 1990 and 77% of them were married. The sub-
group of people who were born in 1956-1960 aged 30-34 in 1990 and
71% of them were married.
Since the number of participants in each group was equal we can
perform a simple average of the marriage percent:
(79 + 77 + 71)/3 = 75.67%.
The closest answer to this outcome is answer choice C – 75%.
Solving Tip – inter-items hints:
Note that if you chose a different answer than 2005 or 2009 in the
previous question, then this question should have raised a red flag for
you. This question infers that the survey is relevant to the year 1990,
so it is not possible for it to be sealed in a preceding year.
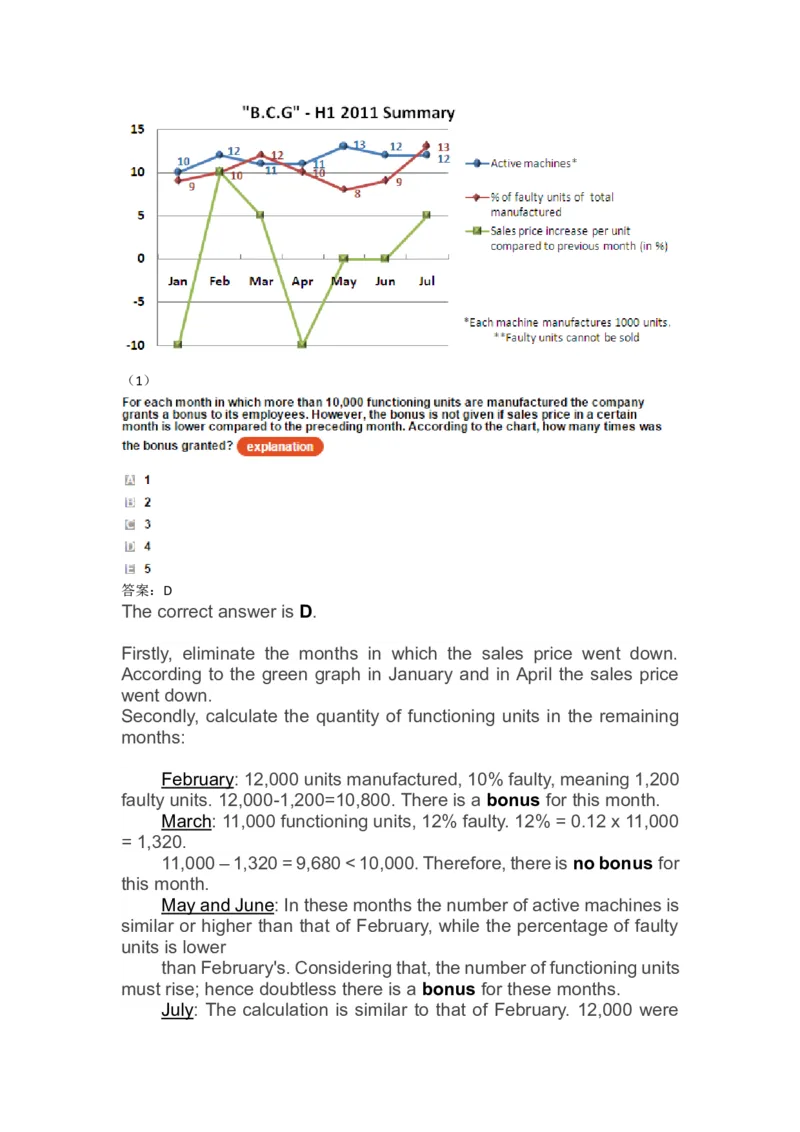
7、(1)
答案:D
The correct answer is D.
Firstly, eliminate the months in which the sales price went down.
According to the green graph in January and in April the sales price
went down.
Secondly, calculate the quantity of functioning units in the remaining
months:
February: 12,000 units manufactured, 10% faulty, meaning 1,200
faulty units. 12,000-1,200=10,800. There is a bonus for this month.
March: 11,000 functioning units, 12% faulty. 12% = 0.12 x 11,000
= 1,320.
11,000 – 1,320 = 9,680 < 10,000. Therefore, there is no bonus for
this month.
May and June: In these months the number of active machines is
similar or higher than that of February, while the percentage of faulty
units is lower
than February's. Considering that, the number of functioning units
must rise; hence doubtless there is a bonus for these months.
July: The calculation is similar to that of February. 12,000 weremanufactured, this time 13% faulty.
13% = 0.13 x 12,000 = 1,560. 12,000 – 1,560 = 10,440. Bonus!
Note that the sort of shortcuts that we have made considering the
decision about May and June are very important, and we must try to
perform them as often as possible in order to save precious time.
(2)
答案:B
The correct answer is B
To solve this problem no calculation is required. The graph shows that
the manufactured quantity in June was higher compared to January,
while the percentage of faulty units was equal in both months (9%). It
can be inferred that June will be represented by a higher figure in the
ratio.
Only answer B meets this condition.
Yet, in order to see that this answer is indeed the correct answer, let's
perform the calculation:
We search for the ratio:
[functioning units for January] : [functioning units for June] .
Since the percentage of faulty units in both months is equal, the ratio
depends only on the number of manufactured units each month:
[units produced in Jan] : [units produced in Jun]
Since the production capacity of each machine is similar, then the
number of active machines is the only thing we need check:
[no. of active machines on Jan] : [no. of active machines on
Jun] = 10:12 = 5:6.
(3)答案:A
The correct answer is A
The green graph shows an increase of 10% in February. According to
the information provided in the question, a 10% increase equals $20.
So if X is the price in January, we can now calculate:
0.1*X=20 so X=200.
Meaning, the price in January was $200. Therefore, the price in
February was $220.
The graph also shows an increase of 5% between February and March.
At this point answers C and D can be eliminated since they indicate a
decrease of the price and answer E as well since an accurate value
can be calculated.
Now calculate 5% of 220 --> 0.05 x 220 = $11
Therefore the price in March was 220+11=$231.
Distracter B is aimed to test whether you understood that any month's
increase/decrease must be calculated relatively to the previous month.
If one forgets that, then 5% could be attributed as half of the previous
increase of 10%, which is $10.
(3)
答案:E
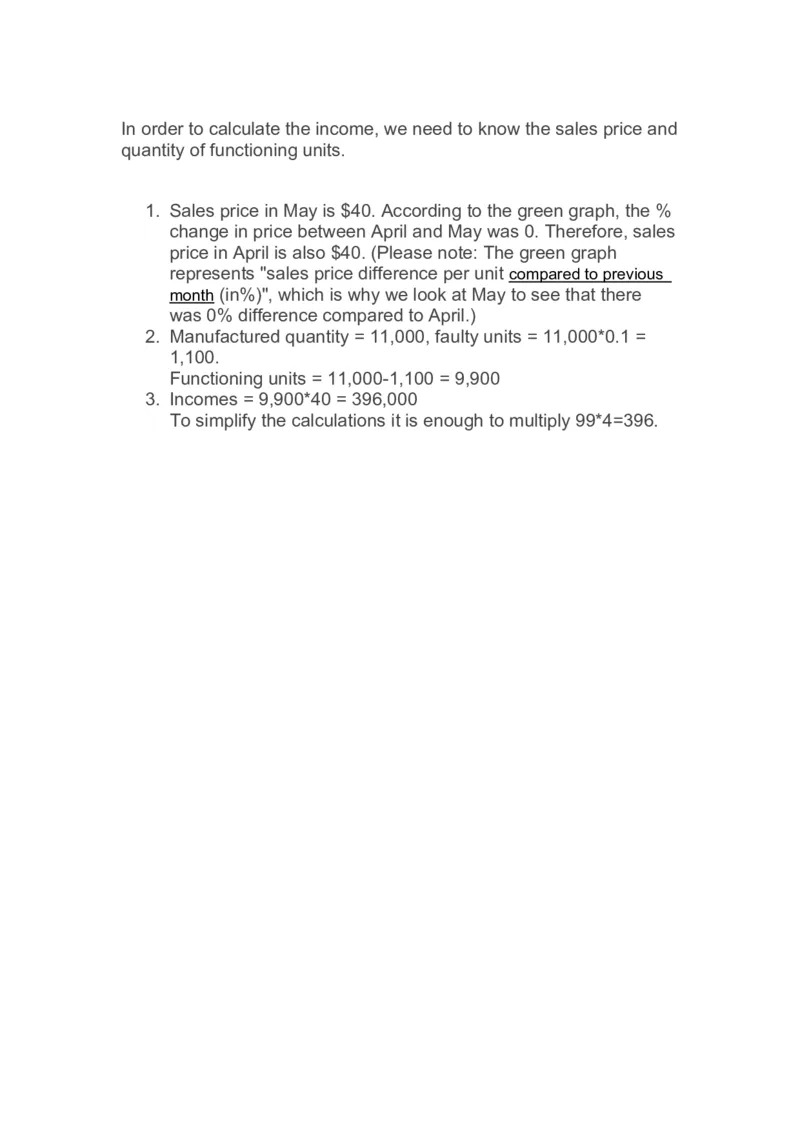
The answer is EIn order to calculate the income, we need to know the sales price and
quantity of functioning units.
1. Sales price in May is $40. According to the green graph, the %
change in price between April and May was 0. Therefore, sales
price in April is also $40. (Please note: The green graph
represents "sales price difference per unit compared to previous
month (in%)", which is why we look at May to see that there
was 0% difference compared to April.)
2. Manufactured quantity = 11,000, faulty units = 11,000*0.1 =
1,100.
Functioning units = 11,000-1,100 = 9,900
3. Incomes = 9,900*40 = 396,000
To simplify the calculations it is enough to multiply 99*4=396.

