

文档内容
说明:本文档仅为录课过程记录,如与纸质版教材有出入,请以纸质版教材为准。
*1-10用单词去表达,10以上的用数字去表达。40000000000,fourbillion,12billion
Hundred 百
Thousand 千
Tenthousand 万
Onehundredthousand 十万
Million 百万
Tenmillion 千万
Onehundredmillion 亿
Million 十亿
Tenmillion 百亿
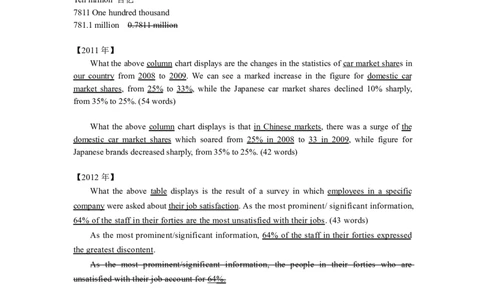
7811Onehundredthousand
781.1million 0.7811million
【2011年】
Whatthe above column chartdisplays arethechanges inthestatistics ofcarmarketsharesin
our country from 2008 to 2009. We can see a marked increase in the figure for domestic car
market shares, from 25% to 33%, while the Japanese car market shares declined 10% sharply,
from35%to25%.(54words)
What the above column chart displays is that in Chinese markets, there was a surge of the
domestic car market shares which soared from 25% in 2008 to 33 in 2009, while figure for
Japanesebrandsdecreasedsharply,from35%to25%.(42words)
【2012年】
What the above table displays is the result of a survey in which employees in a specific
companywereaskedabouttheirjobsatisfaction.As the most prominent/ significant information,
64% ofthe staff in their forties are the most unsatisfied with their jobs. (43 words)
As the most prominent/significant information, 64% of the staff in their forties expressed
the greatest discontent.
As the most prominent/significant information, the people in their forties who are
unsatisfied with their job account for 64%.
【2013年】
What the above pie chart displays is the result of a survey in which the students in a specific
universitywereaskedaboutwhethertheytakepart-timejobs.As the most prominent/ significant
information, senior students doing part-time jobs account for 88.24% and the figures are very
similar for freshmen to juniors, at about 70%. (55 words)
with... 和……类似 AissimilarwithB A和B类似。
for... 对于……而言 sth.issimilarforAandB 对于A和B,sth.是类似的。
习惯性、经常性:Ihavebreakfastat7a.m.
一次性:Ihadbreakfastat7a.m.【2014年】
What the above column chart displays is that in urban areas, there was a surge of the
population which soared from 300 million in 1990 to 670 million in 2010. On the contrary, the
figure for rural areas fell down from 820 million to 680 million over the same 20-year span. (51
words)
【2016】
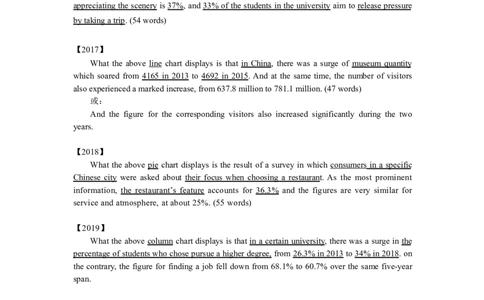
What the above pie chart displays is the result of a survey in which students in a specific
university were asked about their aims of travelling. The percentage of the students travelling for
appreciating the scenery is 37%, and 33% of the students in the university aim to release pressure
bytakingatrip.(54words)
【2017】
What the above line chart displays is that in China, there was a surge of museum quantity
which soared from 4165 in 2013 to 4692 in 2015. And at the same time, the number of visitors
alsoexperiencedamarkedincrease,from637.8millionto781.1million.(47words)
或:
And the figure for the corresponding visitors also increased significantly during the two
years.
【2018】
What the above pie chart displays is the result of a survey in which consumers in a specific
Chinese city were asked about their focus when choosing a restaurant. As the most prominent
information, the restaurant’s feature accounts for 36.3% and the figures are very similar for
service and atmosphere, at about 25%. (55 words)
【2019】
What the above column chart displays is that in a certain university, there was a surge in the
percentageofstudentswhochosepursueahigher degree,from 26.3%in 2013to34%in2018. on
the contrary, the figure for finding a job fell down from 68.1% to 60.7% over the same five-year
span.
【2020】
What the above pie chart displays is the result of a survey in which students in a specific
university were asked about their aims when they read on the phones. As the most prominent
information, acquiring knowledge accounts for 59.5% and the figures are very similar for
killing time and getting information, at about 20%. (55 words)

