


文档内容
ARDAMAN-ACE
CONSULTING ENGINEERS IN SOIL MECHANICS,
FOUNDATIONS AND MATERIAL TESTING
The Iconic Tower (T01) in AL-Alamain Downtown Towers
New Alamain City, Egypt New Cairo, Egypt
Report on
Analysis of Field Pumping Test
And
Dewatering System Recommendations
Submitted to
China State Construction Engineering Corp. Ltd
(CSCEC)
Revision (1)
May, 2022
3 Abd El-Kawi Ahmed St., off Shehab St., Mohandeseen, Giza, Egypt
Tel.: +202 3030438 - +202 3030439
Fax.: +202 3030197
Email: ardace@intouch.comThe Iconic Tower (T01)
AL-Alamain Downtown Towers, New Alamain City, Egypt
Report on Analysis of Field Pumping Test and
Dewatering System Recommendations
Revision (1)
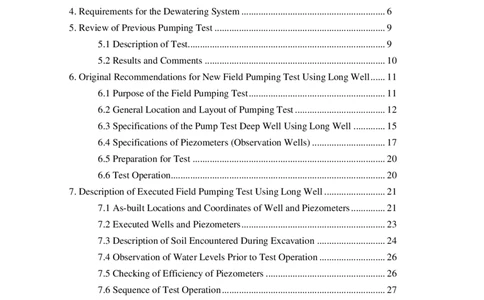
Table of Contents
Page
1. Introduction ......................................................................................................... 1
2. General Description of the Project ...................................................................... 1
3. Subsurface Soil and Groundwater Conditions ..................................................... 2
4. Requirements for the Dewatering System ........................................................... 6
5. Review of Previous Pumping Test ...................................................................... 9
5.1 Description of Test................................................................................. 9
5.2 Results and Comments .......................................................................... 10
6. Original Recommendations for New Field Pumping Test Using Long Well ...... 11
6.1 Purpose of the Field Pumping Test ........................................................ 11
6.2 General Location and Layout of Pumping Test ..................................... 12
6.3 Specifications of the Pump Test Deep Well Using Long Well ............. 15
6.4 Specifications of Piezometers (Observation Wells) .............................. 17
6.5 Preparation for Test ............................................................................... 20
6.6 Test Operation........................................................................................ 20
7. Description of Executed Field Pumping Test Using Long Well ......................... 21
7.1 As-built Locations and Coordinates of Well and Piezometers .............. 21
7.2 Executed Wells and Piezometers ........................................................... 23
7.3 Description of Soil Encountered During Excavation ............................ 24
7.4 Observation of Water Levels Prior to Test Operation ........................... 26
7.5 Checking of Efficiency of Piezometers ................................................. 26
7.6 Sequence of Test Operation ................................................................... 27
8. Presentation of Results of Field Pumping Test – Long Well ............................. 28
9. Execution and Results of Pumping Test Using Short Well ................................. 33
10. Design Parameters Based on Pumping Test Results ........................................ 41
10.1 Type of Aquifer and Governing Equations .......................................... 41
10.2 Effective Thickness of Aquifer (H) ..................................................... 43
10.3 Coefficient of Permeability (k) ............................................................ 44
10.4 Radius of Influence (R) ........................................................................ 44
10.5 Recommended Design Parameters ...................................................... 45
(i)
ARDAMAN-ACEThe Iconic Tower (T01)
AL-Alamain Downtown Towers, New Alamain City, Egypt
Report on Analysis of Field Pumping Test and
Dewatering System Recommendations
Revision (1)
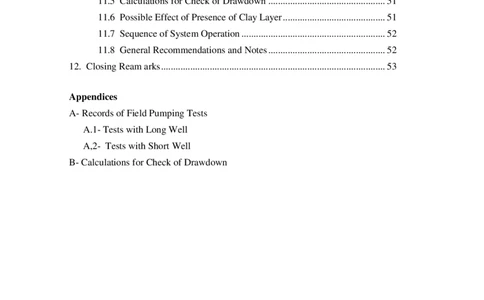
11. Dewatering System Components ...................................................................... 45
11.1 System Components ............................................................................ 45
11.2 Layout of Dewatering System .............................................................. 46
11.3 Standby Wells and Temporary Wells .................................................. 46
11.4 Specifications of Wells and Piezometers ............................................. 46
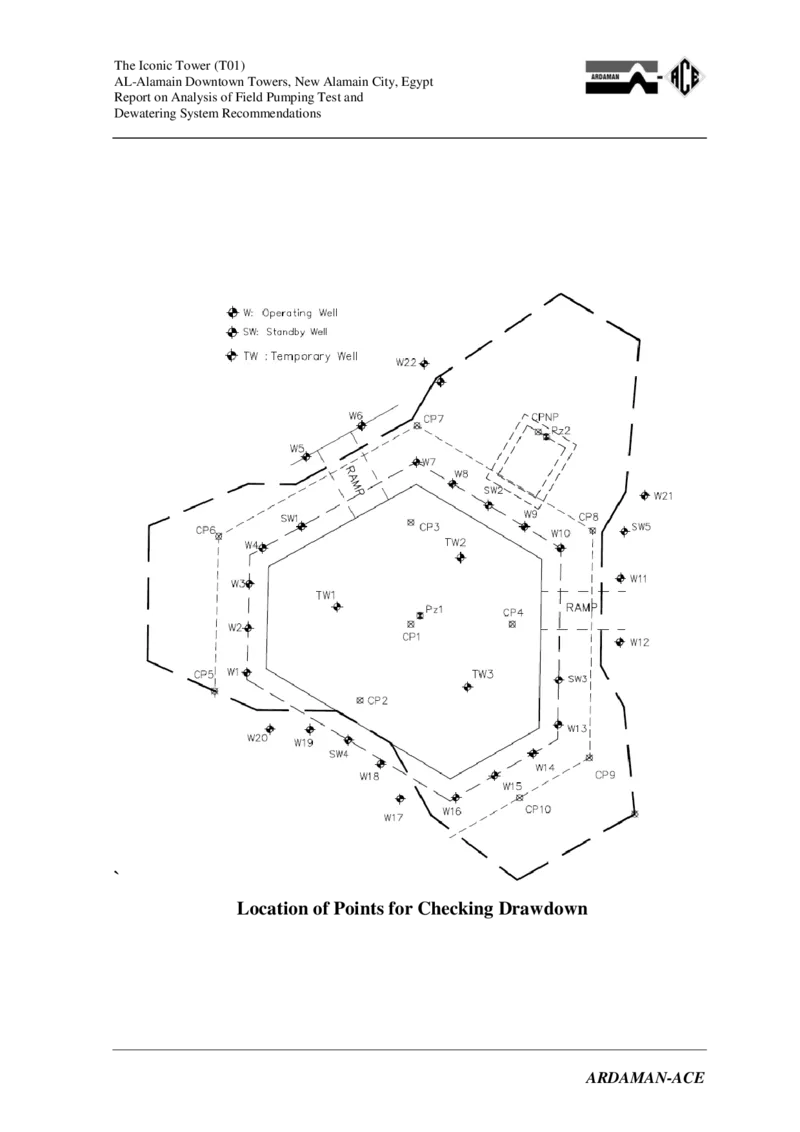
11.5 Calculations for Check of Drawdown ................................................ 51
11.6 Possible Effect of Presence of Clay Layer .......................................... 51
11.7 Sequence of System Operation ........................................................... 52
11.8 General Recommendations and Notes ................................................ 52
12. Closing Ream arks ............................................................................................ 53
Appendices
A- Records of Field Pumping Tests
A.1- Tests with Long Well
A,2- Tests with Short Well
B- Calculations for Check of Drawdown
(ii)
ARDAMAN-ACEThe Iconic Tower (T01)
AL-Alamain Downtown Towers, New Alamain City, Egypt
Report on Analysis of Field Pumping Test and
Dewatering System Recommendations
Revision (1)
The Iconic Tower (T01) in AL-Alamain Downtown Towers New
Alamain City, Egypt New Cairo, Egypt
Report on Analysis of Field Pumping Test and
Dewatering System Recommendations
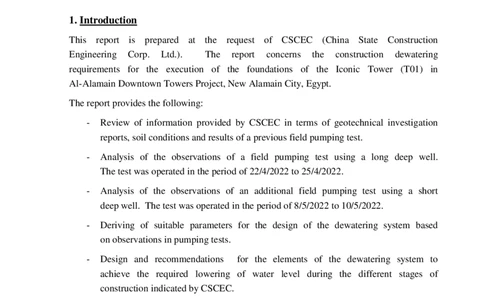
1. Introduction
This report is prepared at the request of CSCEC (China State Construction
Engineering Corp. Ltd.). The report concerns the construction dewatering
requirements for the execution of the foundations of the Iconic Tower (T01) in
Al-Alamain Downtown Towers Project, New Alamain City, Egypt.
The report provides the following:
- Review of information provided by CSCEC in terms of geotechnical investigation
reports, soil conditions and results of a previous field pumping test.
- Analysis of the observations of a field pumping test using a long deep well.
The test was operated in the period of 22/4/2022 to 25/4/2022.
- Analysis of the observations of an additional field pumping test using a short
deep well. The test was operated in the period of 8/5/2022 to 10/5/2022.
- Deriving of suitable parameters for the design of the dewatering system based
on observations in pumping tests.
- Design and recommendations for the elements of the dewatering system to
achieve the required lowering of water level during the different stages of
construction indicated by CSCEC.
The current revision of the report, Revision (1), accounts for the results of both pumping tests
as well as requirements of CSCEC concerning expected stages of construction.
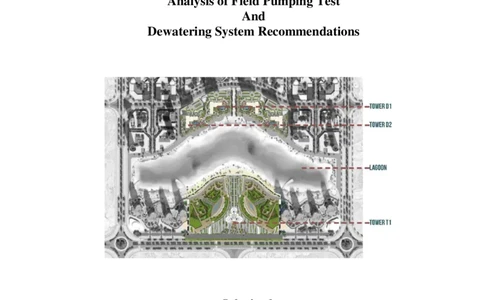
2. General Description of the Project
The site is located at New Alamain City in northwest Egypt. The project consists of
a number of towers surrounded with podiums and landscape areas.
The subject of this report is the Residential Tower T01. The main building of the
68-floor tower occupies an area of about 3000 square meters.
(1)
ARDAMAN-ACEThe Iconic Tower (T01)
AL-Alamain Downtown Towers, New Alamain City, Egypt
Report on Analysis of Field Pumping Test and
Dewatering System Recommendations
Revision (1)
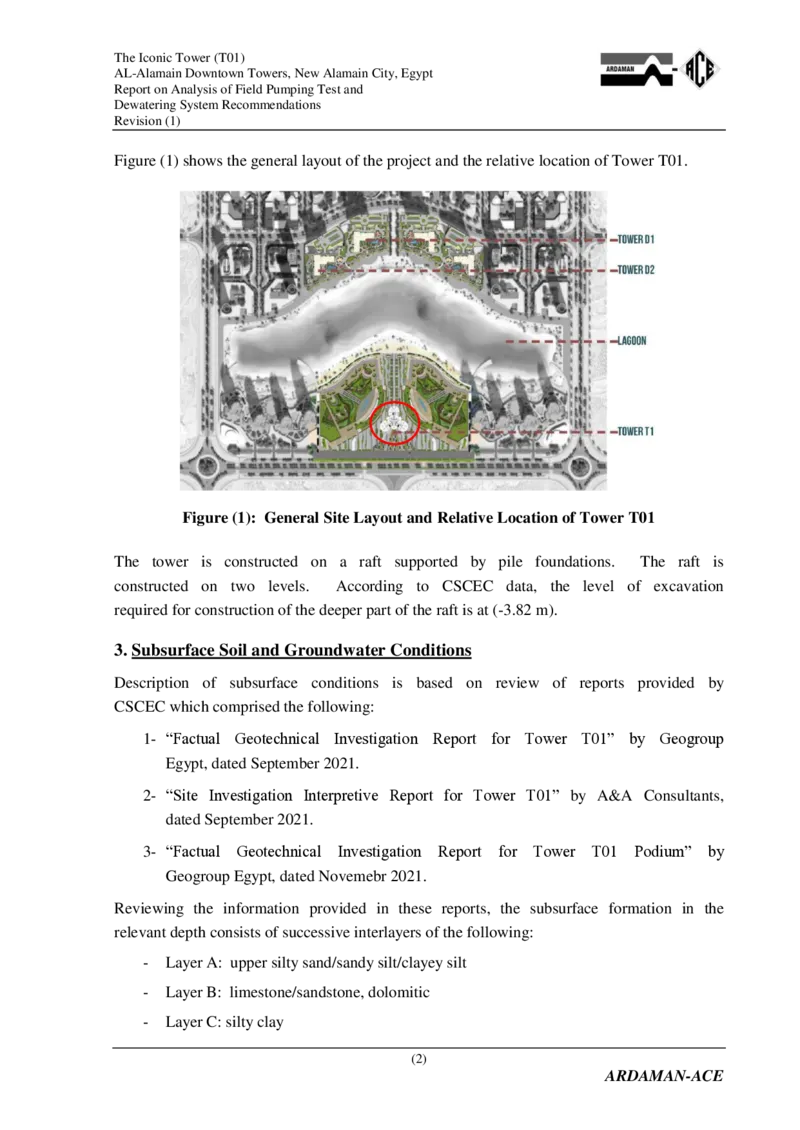
Figure (1) shows the general layout of the project and the relative location of Tower T01.
Figure (1): General Site Layout and Relative Location of Tower T01
The tower is constructed on a raft supported by pile foundations. The raft is
constructed on two levels. According to CSCEC data, the level of excavation
required for construction of the deeper part of the raft is at (-3.82 m).
3. Subsurface Soil and Groundwater Conditions
Description of subsurface conditions is based on review of reports provided by
CSCEC which comprised the following:
1- “Factual Geotechnical Investigation Report for Tower T01” by Geogroup
Egypt, dated September 2021.
2- “Site Investigation Interpretive Report for Tower T01” by A&A Consultants,
dated September 2021.
3- “Factual Geotechnical Investigation Report for Tower T01 Podium” by
Geogroup Egypt, dated Novemebr 2021.
Reviewing the information provided in these reports, the subsurface formation in the
relevant depth consists of successive interlayers of the following:
- Layer A: upper silty sand/sandy silt/clayey silt
- Layer B: limestone/sandstone, dolomitic
- Layer C: silty clay
(2)
ARDAMAN-ACEThe Iconic Tower (T01)
AL-Alamain Downtown Towers, New Alamain City, Egypt
Report on Analysis of Field Pumping Test and
Dewatering System Recommendations
Revision (1)
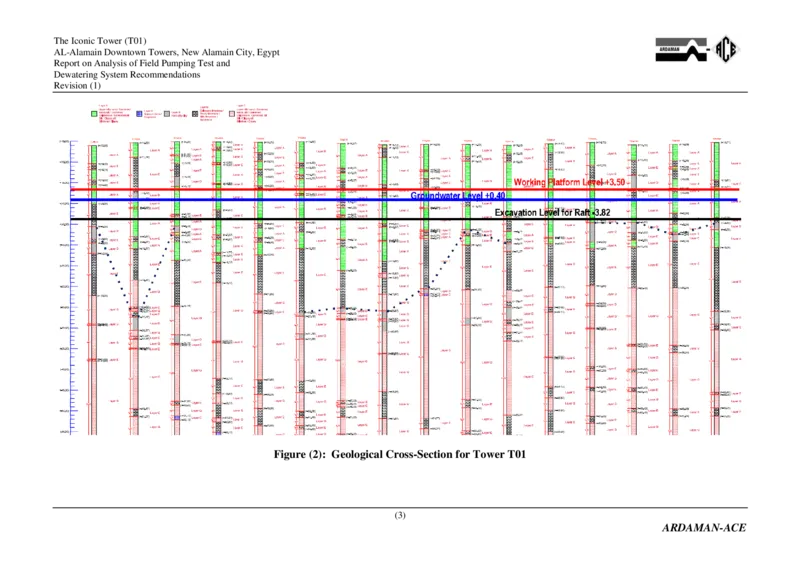
Figure (2): Geological Cross-Section for Tower T01
(3)
ARDAMAN-ACEThe Iconic Tower (T01)
AL-Alamain Downtown Towers, New Alamain City, Egypt
Report on Analysis of Field Pumping Test and
Dewatering System Recommendations
Revision (1)
Figure (2) shows a compiled geological cross-section for Tower T01, as provided by
CSCEC.
According to water depth recorded on the borehole logs of Tower T01, the water
level ranges between (+0.2) and (+1.3) with an average around (+0.6). Water level
observations in the piezometers installed for pumping test indicated an average water
level of (+0.3) during the period of 20/4/2022 to 22/4/2022.
The water bearing layers are Layer A and Layer B. Layer C (silty clay) may be
considered practically impervious. The clay layer, if present in a large area
continuously, may act as a barrier for water flow, separating the groundwater regime
into two aquifers, above and below the continuous impervious layer.
Table (1) shows the levels of the top and bottom of the clay layer as derived from
boreholes of the geotechnical report for Tower T01 and nearby boreholes in the
surrounding podium. The shown clay layers are those existing between levels (+1.0)
and (-20.0), since these are the levels relevant to the dewatering requirements.
Figure (3) shows the distribution of the clay layers on the plan.
Table (1): Levels of Clay Layers in Boreholes
(For Clay Layers between Levels +1.0 and -20.0)
Clay Layer Level (m)
Borehole Thickness
Number (m)
Top Bottom
TO1-1A -5.55 -12.05 6.5(*)
TO1-3A -5.15 -6.95 1.8
TO1-9A -6.37 -6.77 0.4
TO1-10A -5.79 -7.29 1.5
TO1-11A -9.66 -11.56 1.9
TO1-13A -4.58 -9.28 4.7
TO1-14A -4.49 -6.99 2.5
TO1-15A -7.43 -9.03 1.6
TO1-16A -4.68 -6.28 1.6
TO1-P-04 -11.38 -13.98 2.6
TO1-NP-27 -5.41 8..01 2.6
(*) With interlayer of sandy limestone of thickness 1.0 m
(4)
ARDAMAN-ACEThe Iconic Tower (T01)
AL-Alamain Downtown Towers, New Alamain City, Egypt
Report on Analysis of Field Pumping Test and
Dewatering System Recommendations
Revision (1)
Figure (3): Distribution of Clay Layers within Levels between (+1.0) and (-20.0)
(Numbers in Brackets Indicate Top and Bottom Levels )
Reviewing Table (1) and Figure (3) indicates the following:
- The existence of the clay layer in the relevant levels is not continuous
throughout the site.
- The top level ranges between (-4.5) and (-11.4), but mainly around level (-5.5).
(5)
ARDAMAN-ACEThe Iconic Tower (T01)
AL-Alamain Downtown Towers, New Alamain City, Egypt
Report on Analysis of Field Pumping Test and
Dewatering System Recommendations
Revision (1)
- The thickness of the clay layers ranges between 0.4 m and 6.5 m, but mainly
around 1.8 m, except at the locations of boreholes T01-01A and T01-13A,
with clay thickness of 6.5 m and 4.7 m, respectively.
The implications of the non-homogeneous distribution of clay layer on the
dewatering system is considered later.
4. Requirements for the Dewatering System
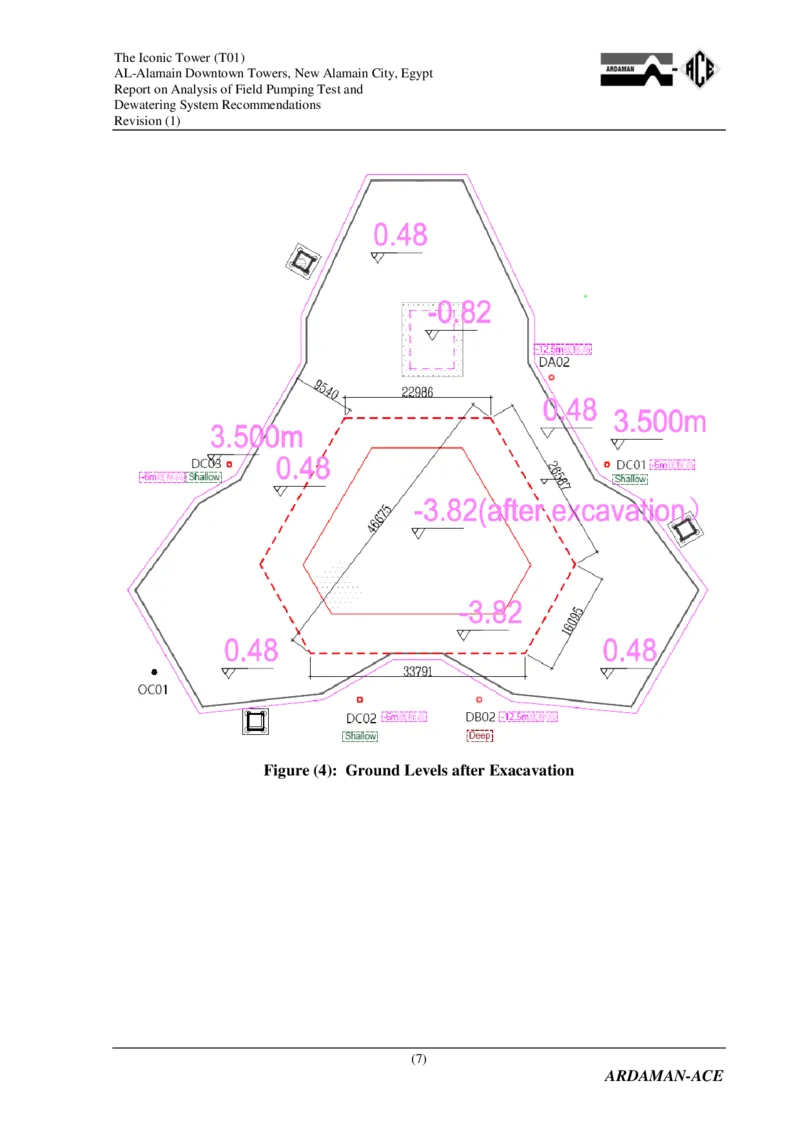
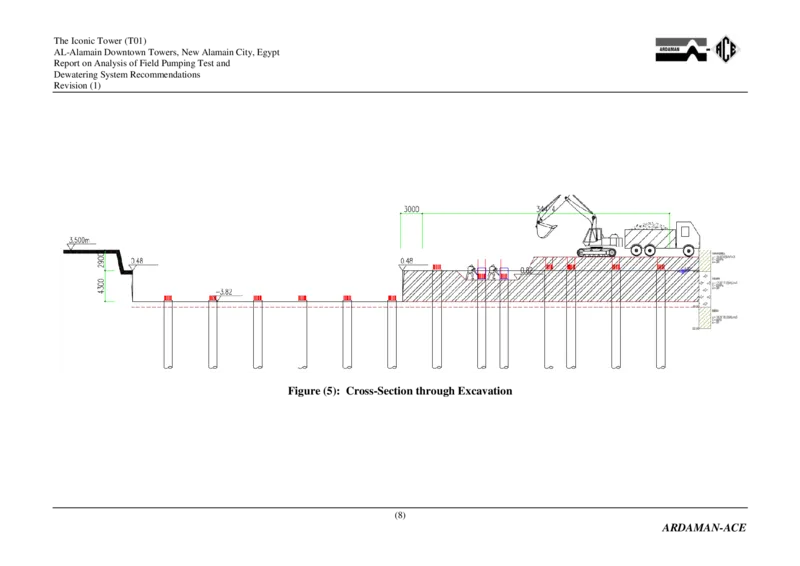
CSCEC has provided a drawing showing the required excavation levels for the
different areas of the tower foundations as shown in Figure (4). A cross-section
through the excavation is shown in Figure (5).
The excavation level for the lower raft is at (-3.82). The excavation level for the
upper raft is at (+0.48), with a small pit on the north side requiring excavation level
at (-0.82).
The typical requirement for excavation level within a pervious layer is to lower the
water level to 0.5 m below the excavation level to allow construction in dry
conditions. Therefore, water level in the lower raft area should be reduced to level
(-4.32). Considering that the observed current water level is at (+0.4), the required
drawdown is 4.72 m. For the north pit, the water level should be reduced to (-1.32),
requiring a drawdown of 1.72 m.
For the remainder of the upper raft with excavation level (+0.48) and current water
level of (+0.40), the groundwater control could be achieved with shallow surface
dewatering. However, CSCEC has indicated that the top level of the lower raft shall
be at (+0.3) and it is required to guard against the seepage of water across the joint
between the upper and lower rafts. Consequently, the water level should be
maintained below level (0.0) for a suitable distance outside the boundaries of the
lower raft during the construction of the upper raft.
These conditions would be considered in the design of the dewatering system and
checks of drawdown during the various stages of construction.
(6)
ARDAMAN-ACEThe Iconic Tower (T01)
AL-Alamain Downtown Towers, New Alamain City, Egypt
Report on Analysis of Field Pumping Test and
Dewatering System Recommendations
Revision (1)
Figure (4): Ground Levels after Exacavation
(7)
ARDAMAN-ACEThe Iconic Tower (T01)
AL-Alamain Downtown Towers, New Alamain City, Egypt
Report on Analysis of Field Pumping Test and
Dewatering System Recommendations
Revision (1)
Figure (5): Cross-Section through Excavation
(8)
ARDAMAN-ACEThe Iconic Tower (T01)
AL-Alamain Downtown Towers, New Alamain City, Egypt
Report on Analysis of Field Pumping Test and
Dewatering System Recommendations
Revision (1)
5. Review of Previous Pumping Test
5.1 Description of Test
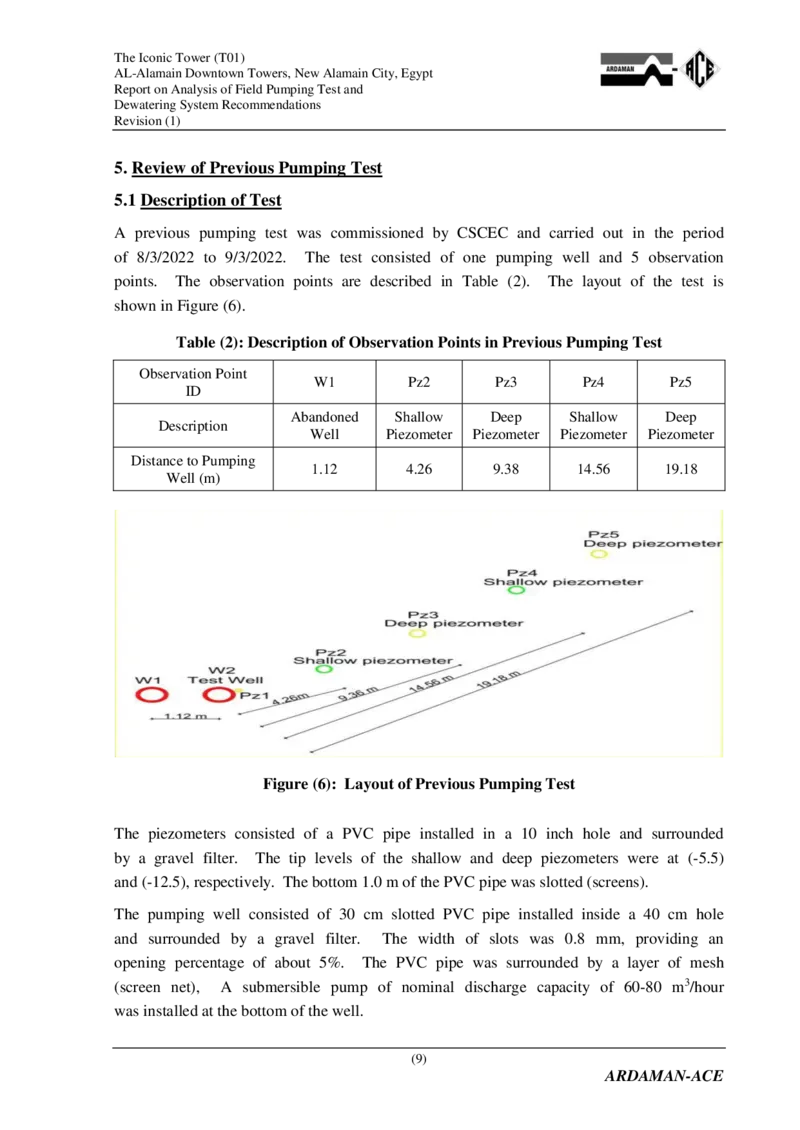
A previous pumping test was commissioned by CSCEC and carried out in the period
of 8/3/2022 to 9/3/2022. The test consisted of one pumping well and 5 observation
points. The observation points are described in Table (2). The layout of the test is
shown in Figure (6).
Table (2): Description of Observation Points in Previous Pumping Test
Observation Point
W1 Pz2 Pz3 Pz4 Pz5
ID
Abandoned Shallow Deep Shallow Deep
Description
Well Piezometer Piezometer Piezometer Piezometer
Distance to Pumping
1.12 4.26 9.38 14.56 19.18
Well (m)
Figure (6): Layout of Previous Pumping Test
The piezometers consisted of a PVC pipe installed in a 10 inch hole and surrounded
by a gravel filter. The tip levels of the shallow and deep piezometers were at (-5.5)
and (-12.5), respectively. The bottom 1.0 m of the PVC pipe was slotted (screens).
The pumping well consisted of 30 cm slotted PVC pipe installed inside a 40 cm hole
and surrounded by a gravel filter. The width of slots was 0.8 mm, providing an
opening percentage of about 5%. The PVC pipe was surrounded by a layer of mesh
(screen net), A submersible pump of nominal discharge capacity of 60-80 m3/hour
was installed at the bottom of the well.
(9)
ARDAMAN-ACEThe Iconic Tower (T01)
AL-Alamain Downtown Towers, New Alamain City, Egypt
Report on Analysis of Field Pumping Test and
Dewatering System Recommendations
Revision (1)
The test was conducted at an average discharge of 30 m3/hour for a period of
24 hours, followed by a recovery period of 1.25 hours.
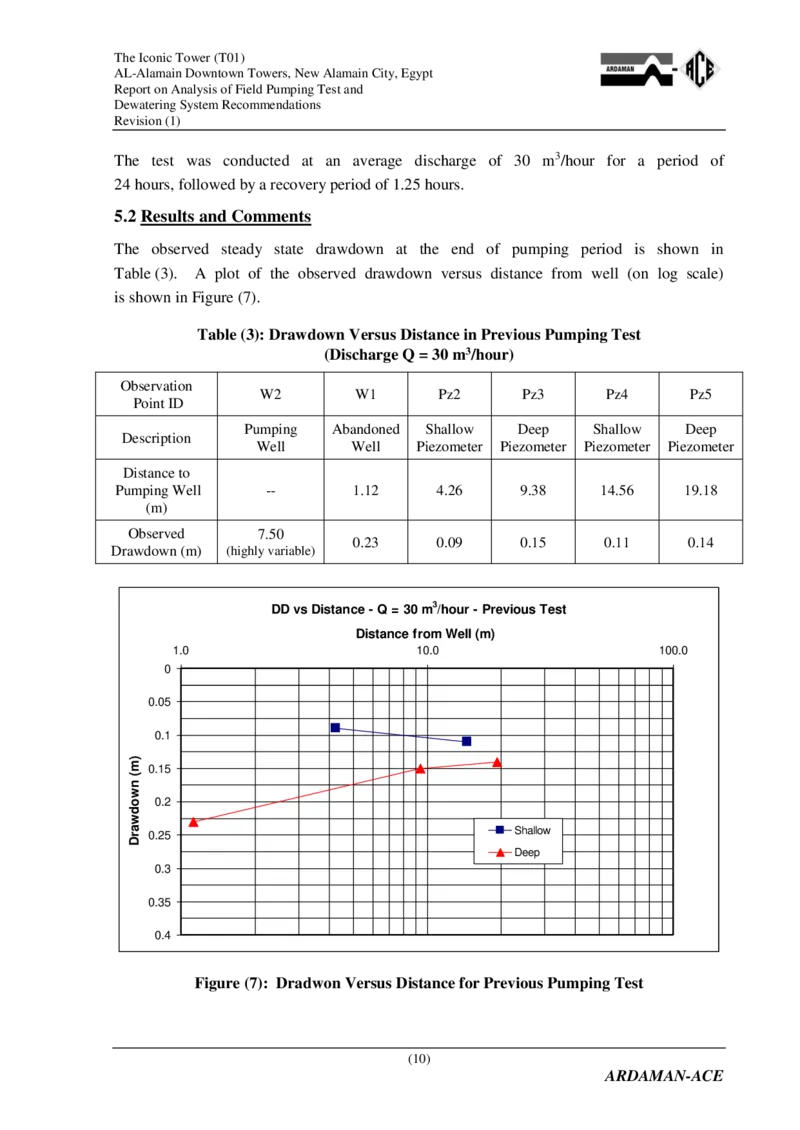
5.2 Results and Comments
The observed steady state drawdown at the end of pumping period is shown in
Table (3). A plot of the observed drawdown versus distance from well (on log scale)
is shown in Figure (7).
Table (3): Drawdown Versus Distance in Previous Pumping Test
(Discharge Q = 30 m3/hour)
Observation
W2 W1 Pz2 Pz3 Pz4 Pz5
Point ID
Pumping Abandoned Shallow Deep Shallow Deep
Description
Well Well Piezometer Piezometer Piezometer Piezometer
Distance to
Pumping Well -- 1.12 4.26 9.38 14.56 19.18
(m)
Observed 7.50
0.23 0.09 0.15 0.11 0.14
Drawdown (m) (highly variable)
(10)
ARDAMAN-ACE
0
0
0
0
0
.0 5
0 .1
.1 5
0 .2
.2 5
0 .3
.3 5
0 .4
1 .0
D D v s D is t a n c e
D
-
is
Q
t a
=
n c
3
e
0 m
f r o
1 0
3
m
.0
/h o
W
u
e
r - P
ll ( m
r
)
e v io u s T e s t
1 0 0 .0
)
m
(
n
w
o
d
w
a
r
D
S
D
h
e
a
e
llo
p
w
Figure (7): Dradwon Versus Distance for Previous Pumping TestThe Iconic Tower (T01)
AL-Alamain Downtown Towers, New Alamain City, Egypt
Report on Analysis of Field Pumping Test and
Dewatering System Recommendations
Revision (1)
The following comments apply to the results of the previous pumping test:
- The drawdown at the well was highly variable ranging between 7.5 and 14 m.
The difference between the drawdown at the well and the nearby observation
points is very large, indicating high head loss for passage of water through the
screens and into the well. This is probably caused by a low percentage of
openings together with the installation of a surrounding mesh.
- The supposedly deep piezometers were not supplied with an impervious seal at
a suitable depth to separate them from water level of the upper layers during
pumping. Consequently, distinction between water levels in the upper and lower
layers could not be confirmed.
- Reviewing of Figure (7) indicates that there is no clear trend of reduction of
drawdown with distance, such that application of aquifer equations to derive
permeability is not possible. More piezometers at increasing distances should
have been installed.
Based on the above, the observations in the previous pumping test were not enough
to provide conclusions on the suitable design parameters.
6. Original Recommendations for New Field Pumping Test Using Long Well
In this section, the original recommendations for a new field pumping test as given
in a previous report (March 2022) are listed. Variations from recommendations
during actual execution due to field conditions and other factors are indicated in
Section 7, with reference to the original conditions.
Initial review of the soil strata and observations of escape of drilling fluid during
execution of boreholes indicated that the subsurface soil/rock might have a wide
range of permeability. In order to ensure achieving high discharge from the wells,
the first pumping test was carried out using a relatively long deep well. Based on
observations from this test, a second pumping test was recommended and carried out
using a short deep well. The execution and results of the second test are presented
later.
6.1 Purpose of the Field Pumping Test
Due to the complexity and variability in soil/rock strata below the groundwater level,
it is recommended to conduct a field pumping test. The pumping test shall comprise
execution of a test well and a set of observation piezometers, followed by pumping
and recoding of well discharge and water level in piezometers.
(11)
ARDAMAN-ACEThe Iconic Tower (T01)
AL-Alamain Downtown Towers, New Alamain City, Egypt
Report on Analysis of Field Pumping Test and
Dewatering System Recommendations
Revision (1)
The purpose of the pumping test is to obtain information on layers permeability and
the possible radius of influence of the pumping wells. This would allow for the
design of the suitable dewatering system and checking of feasibility of locating the
operating wells outside the raft boundaries.
The pumping test would also give information on whether the silty clay layer has an
effect on separating the groundwater regime into two aquifers. For this purpose each
station of piezometers shall include one shallow piezometer, with its tip above the
presumed level of the clay layer, and one deep piezometer with its tip below the clay
layer and sealed above the screens to allow observation of water level in the deeper
aquifer, if present.
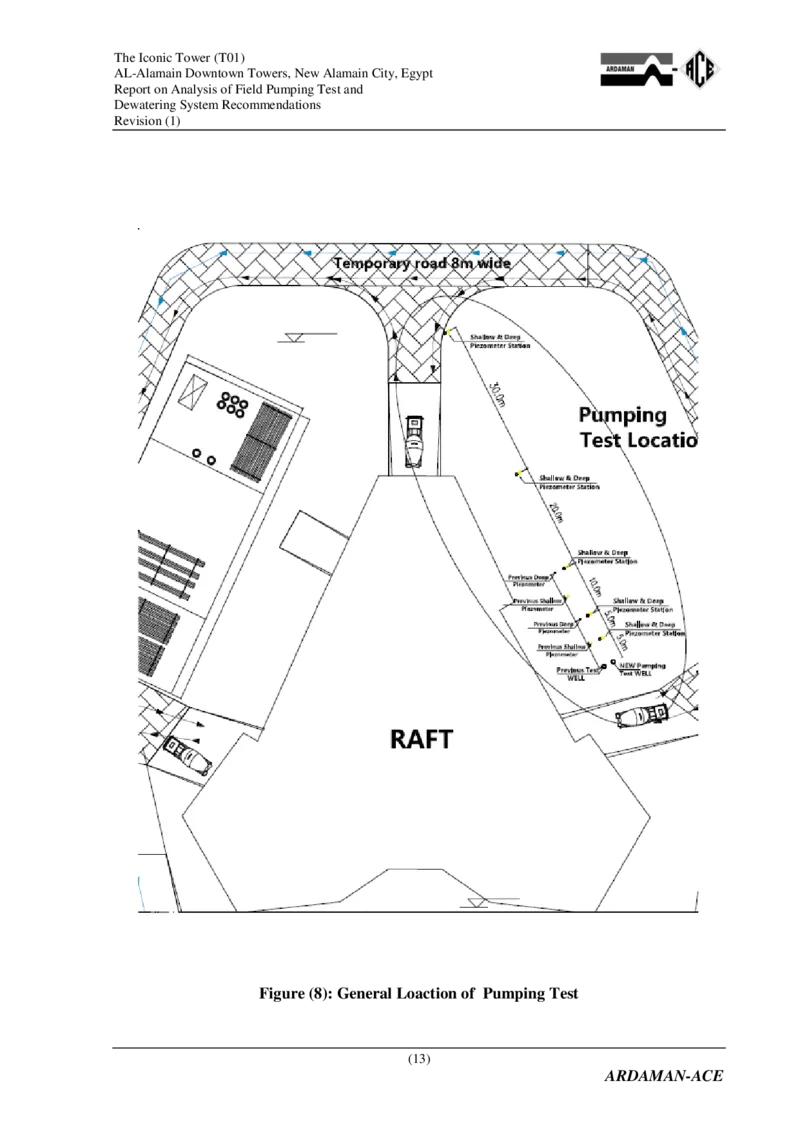
6.2 General Location and Layout of Pumping Test
The general location of the recommended pumping test is chosen on the east side of
the raft within the area of the previous pumping test.
Figure (8) shows the general location of the pumping test relative to the raft. The
location is chosen adjacent to the previously executed pumping test. The extent of
possible locations of observation piezometers is limited by the temporary access
roads to the construction area.
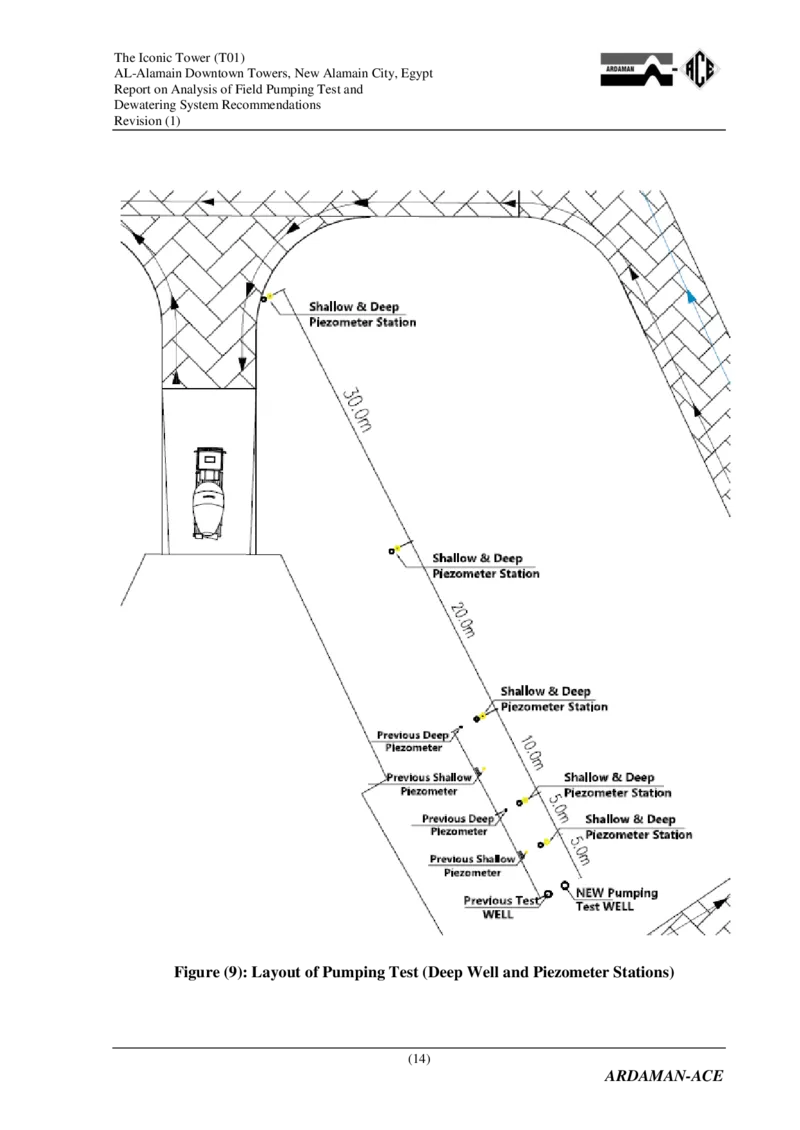
Figure (9) shows the layout of pumping well and observation piezometer stations.
The piezometer stations shall be located at distances of 5 m, 10 m, 20 m, 40 m and
70 m from the pumping well. Each piezometer station shall comprise one shallow
piezometer and one deep piezometer with specifications as given later herein.
The existing wells and piezometers of the previous pumping test may be used as
extra observation points.
The specifications for the pumping test deep well and the observation piezometers
are given below, followed by recommendations for pump test operation.
(12)
ARDAMAN-ACEThe Iconic Tower (T01)
AL-Alamain Downtown Towers, New Alamain City, Egypt
Report on Analysis of Field Pumping Test and
Dewatering System Recommendations
Revision (1)
Figure (8): General Loaction of Pumping Test
(13)
ARDAMAN-ACEThe Iconic Tower (T01)
AL-Alamain Downtown Towers, New Alamain City, Egypt
Report on Analysis of Field Pumping Test and
Dewatering System Recommendations
Revision (1)
Figure (9): Layout of Pumping Test (Deep Well and Piezometer Stations)
(14)
ARDAMAN-ACEThe Iconic Tower (T01)
AL-Alamain Downtown Towers, New Alamain City, Egypt
Report on Analysis of Field Pumping Test and
Dewatering System Recommendations
Revision (1)
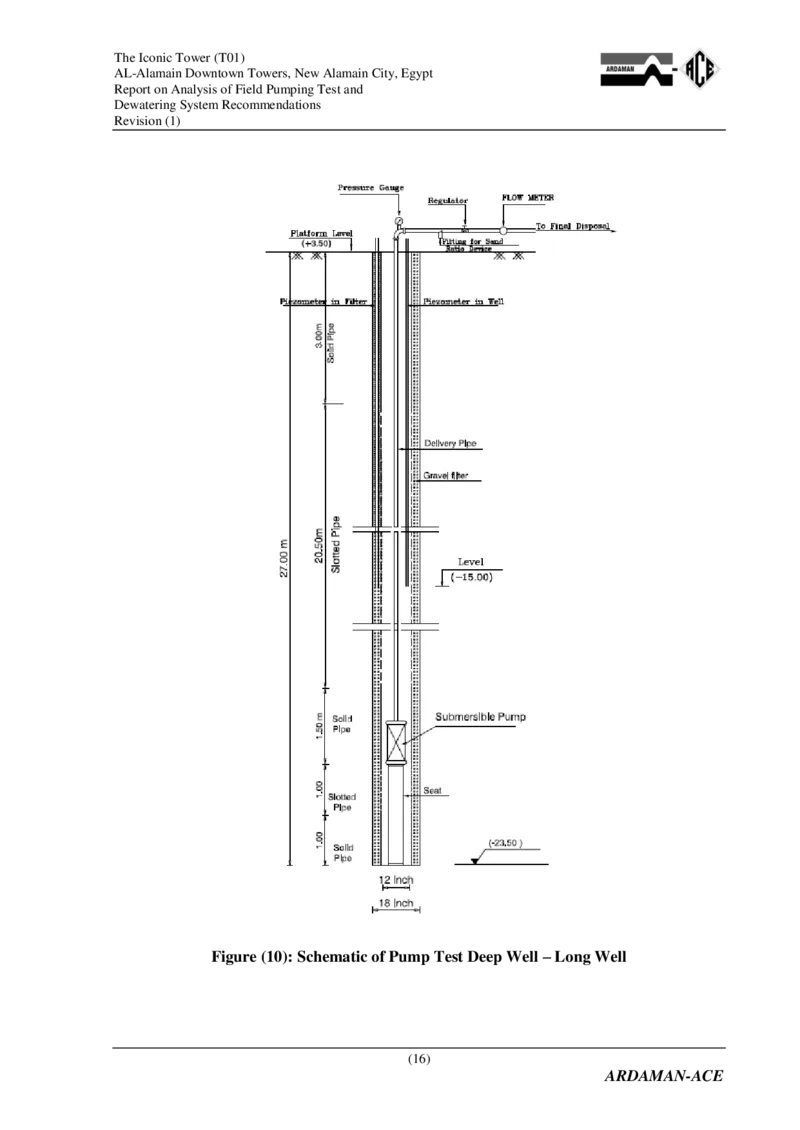
6.3 Specifications of the Pump Test Deep Well Using Long Well
The deep well specifications are as follows (Figure 10):
- The well penetration shall be 27 m form current platform level (+3.50 m) such
that the bottom of well is at level (-23.5 m)
- Well casing pipes shall be of diameter 0.3 m (12 inches).
- The well casing pipes are to be installed inside a hole of diameter at least 0.45 m
(18 inch).
- The well casing pipes are either steel pipes or UPVC pipes. The distribution of slotted
parts (screens) and the solid parts along the depth of the well shall be as shown in
Figure (10). In case steel pipes are used, a bridge slotted type is recommended for the
screens.
- The slots shall provide a percentage of openings in the order of 10% of the total
area of the circumference.
- No bentonite is to be used in drilling the well.
- The annulus around the well pipe is to be filled with a suitable gravel filter
material with percentage of fines not exceeding 2%. If needed, the filter material
should be washed before use to remove the fines.
- The pump test well shall be fitted with submersible pump of capacity not less than
150 m3/hour and capable to be throttled down to a discharge of 100 m3/hour and
50 m3/hour.
- The well shall be provided with the following (refer to Figure 10):
- Filter piezometer.
- Well piezometer.
- Flow regulator (throttle valve).
- Flow meter for measuring discharge.
- Pressure gauge.
- Fitting for sand ratio device.
- Logs for classification of soil encountered during excavation of well are to be
recorded during excavation and maintained.
- A suitable method is to be employed by the dewatering contractor in order to
develop the well prior to continuous operation.
(15)
ARDAMAN-ACEThe Iconic Tower (T01)
AL-Alamain Downtown Towers, New Alamain City, Egypt
Report on Analysis of Field Pumping Test and
Dewatering System Recommendations
Revision (1)
Figure (10): Schematic of Pump Test Deep Well – Long Well
(16)
ARDAMAN-ACEThe Iconic Tower (T01)
AL-Alamain Downtown Towers, New Alamain City, Egypt
Report on Analysis of Field Pumping Test and
Dewatering System Recommendations
Revision (1)
6.4 Specifications of Piezometers (Observation Wells)
Stations of shallow and deep piezometers shall be installed at distances from the
pumping well as described in Section 6
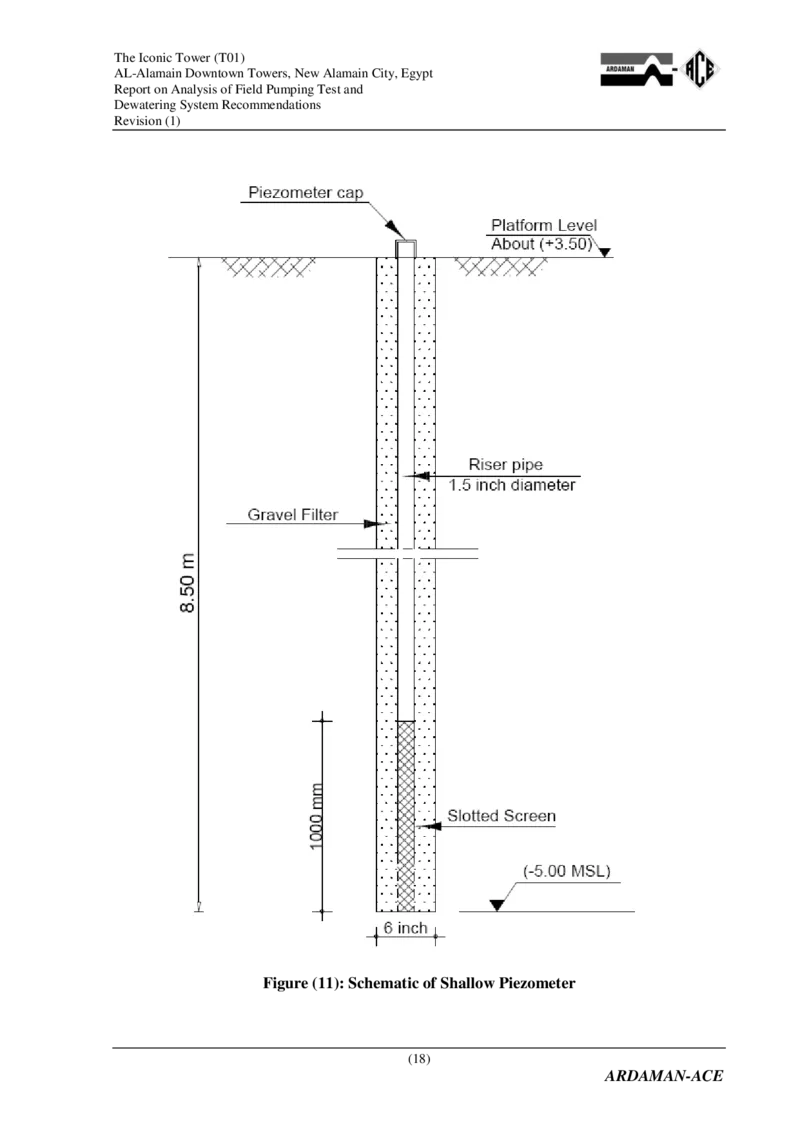
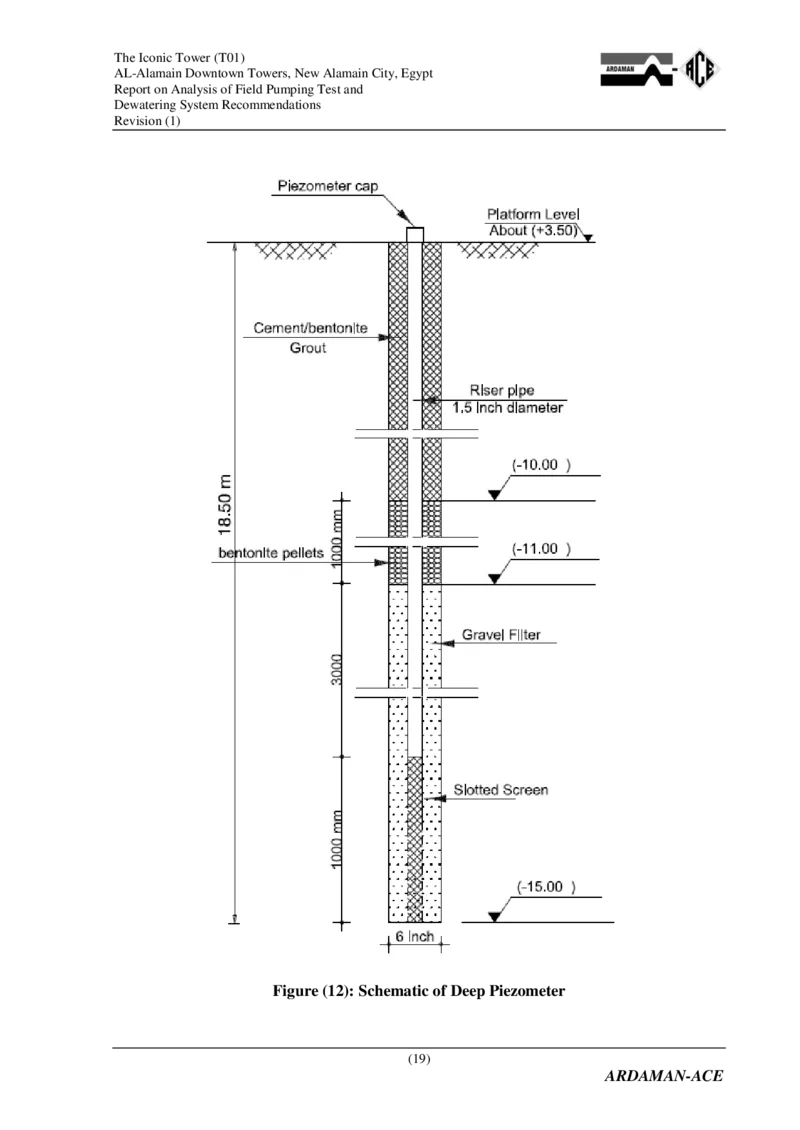
The following specifications apply to the piezometers (refer to Figures 11 and 12):
- Diameter of piezometer pipe and screen: 1.5 inch.
- Diameter of piezometer hole: not less than 6 inches.
- Length of piezometer screen: not less than 1.0 m.
- The annulus around the piezometer pipe and screen is to be filled with a suitable
clean gravel filter material.
- The depth of shallow piezometers (Figure 11) shall be 8.5 m from current
working platform level (+3.50 m), such that the bottom of the piezometer shall
be at level (-5.0 m).
- For deep piezometers:
- The depth of deep piezometers (Figure 12) shall be 18.5 m from current
working platform level (+3.50 m), such that the bottom of the piezometer
shall be at level (-15.0 m).
- The filter material shall be placed to fill up to level (-11.0 m).
- A seal of bentonite pellets of thickness 1.0 m shall be applied above the
filter. The remainder of the hole shall be filled with bentonite/cement grout.
- The piezometer is to be provided with a protective cover.
- Logs for classification of soil encountered during excavation of piezometers are
to be recorded during excavation and maintained.
(17)
ARDAMAN-ACEThe Iconic Tower (T01)
AL-Alamain Downtown Towers, New Alamain City, Egypt
Report on Analysis of Field Pumping Test and
Dewatering System Recommendations
Revision (1)
Figure (11): Schematic of Shallow Piezometer
(18)
ARDAMAN-ACEThe Iconic Tower (T01)
AL-Alamain Downtown Towers, New Alamain City, Egypt
Report on Analysis of Field Pumping Test and
Dewatering System Recommendations
Revision (1)
Figure (12): Schematic of Deep Piezometer
(19)
ARDAMAN-ACEThe Iconic Tower (T01)
AL-Alamain Downtown Towers, New Alamain City, Egypt
Report on Analysis of Field Pumping Test and
Dewatering System Recommendations
Revision (1)
6.5 Preparation for Test
The following preparations are to be carried out prior to the start of tests:
- Surveying for the as-built coordinates of the deep well, new piezometers and
existing piezometers.
- Surveying for elevations of all piezometer pipes from which water depth will be
measured.
- Testing of piezometers by taking initial water level readings then filling with
water and observing time for water level to return to initial level,
- Observation of water level in well and all piezometers for two days at 6 hour
intervals.
- A suitable number of electric dip meters should be made available to allow for
monitoring of water levels in piezometers at the recommended time intervals.
- Ensuring that the following is available:
- Installation of header line(s).
- Source of electricity and standpipe generator.
- Location for disposal of discharged water. The location and setup of
discharge system should ensure no recharge in the pump test area.
6.6 Test Operation
The test shall be performed at stage pumping as follows:
- Stage (1) Test: operation of well at a constant discharge of 50 m3/hour for
a period of 24 hours or until steady state conditions are satisfied, whichever is
earlier.
- Stage (2) Test: increasing well discharge and operation at a constant discharge of
100 m3/hour for a period of 24 hours or until steady state conditions are satisfied,
whichever is earlier.
- Stage (3) Test: increasing well discharge and operation at a constant discharge of
150 m3/hour for a period of 24 hours or until steady state conditions are satisfied,
whichever is later.
- Stage (4) Recovery: shutdown of the system and observations for a recovery
period of 24 hours.
(20)
ARDAMAN-ACEThe Iconic Tower (T01)
AL-Alamain Downtown Towers, New Alamain City, Egypt
Report on Analysis of Field Pumping Test and
Dewatering System Recommendations
Revision (1)
- Steady state conditions are considered to be satisfied if the change of
observations of water levels in all piezometers does not exceed +/-2 cm
throughout a period of 4 hours.
- During the tests, readings of water depths inside the installed piezometers and
the well are to be recorded, in addition to observations in piezometers and wells
of the previous pump test.
- The sequence of readings for each stage shall be as follows:
- Every 15 minutes for the first hour.
- Every 30 minutes next 3 hours.
- Every hour for the remaining period of observation.
- The same intervals of readings should be followed during recovery period,
with the times measured from the stop of pumping.
- The discharged volume and the discharge rate shall be recorded at the same
intervals of observations of water levels.
Results are to be presented, tabulated with time versus observed reading.
After completion of test, a factual report presenting the complete records and observations
and drilling logs should be presented by the contractor performing the test.
7. Description of Executed Field Pumping Test Using Long Well
In this section, a description of the actual executed pumping test is provided, with
notes on conditions of site and limiting factors during execution.
7.1 As-built Locations and Coordinates of Well and Piezometers
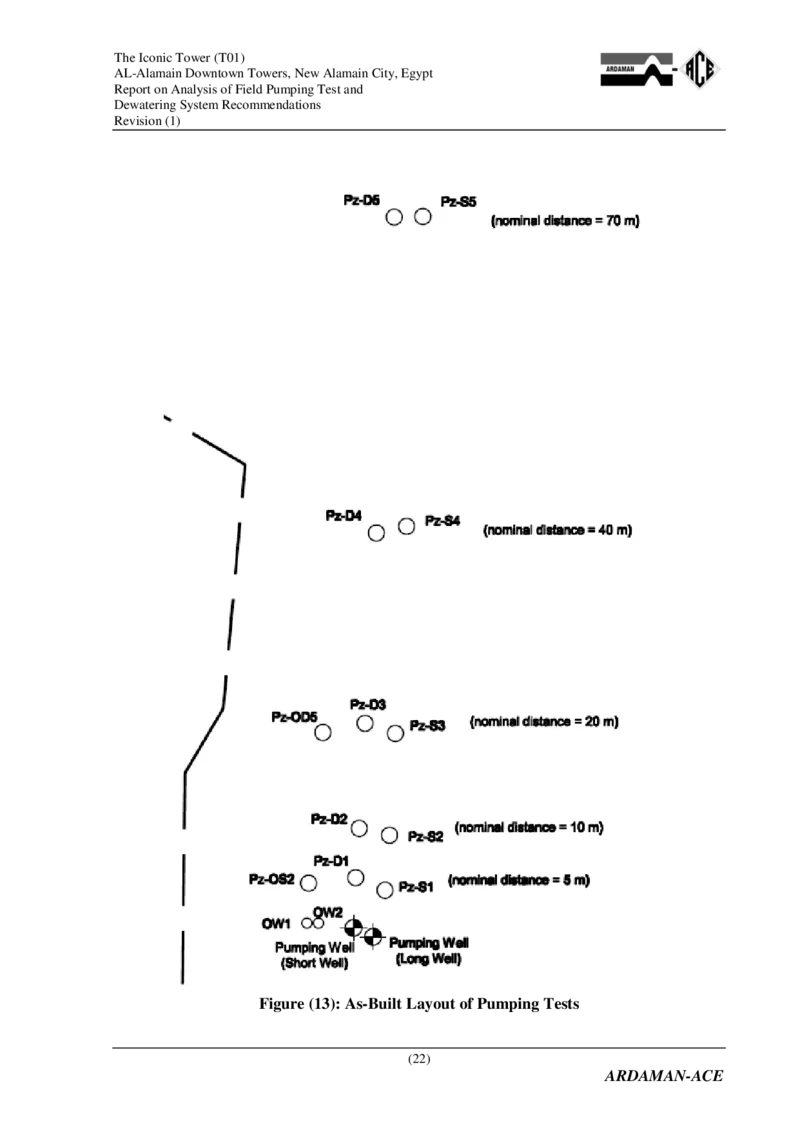
Figure (13) shows the as-built layout of the pumping test and the designation of
piezometers and observation wells. (The location of the short pumping well
executed later is also shown.)
Table (4) shows the coordinates provided by CSCEC for the pumping well, the new
piezometers and the observation points from the previous pumping test. The level of
top of pipe from which depth of water is measured is also indicated.
(21)
ARDAMAN-ACEThe Iconic Tower (T01)
AL-Alamain Downtown Towers, New Alamain City, Egypt
Report on Analysis of Field Pumping Test and
Dewatering System Recommendations
Revision (1)
Figure (13): As-Built Layout of Pumping Tests
(22)
ARDAMAN-ACEThe Iconic Tower (T01)
AL-Alamain Downtown Towers, New Alamain City, Egypt
Report on Analysis of Field Pumping Test and
Dewatering System Recommendations
Revision (1)
Table (4): As-Built Coordinates and Levels – Long Well
Coordinates (m) Distance to
Level
ID Description Pumping
X Y (m)
Well (m)
Pump Piezometer in Well 4.47 --
296172.36 877072.21
Well Piezometer in Filter 4.28 --
Pz-S1 New Shallow Piez. 296176.91 877073.37 4.06 4.70
Pz-D1 New Deep Piez. 296178.13 877070.51 4.11 6.01
Pz-S2 New Shallow Piez. 296182.29 877073.81 3.97 10.06
Pz-D2 New Deep Piez. 296182.96 877070.85 3.86 10.69
Pz-S3 New Shallow Piez. 296192.24 877074.39 4.30 20.00
Pz-D3 New Deep Piez. 296193.22 877071.42 4.31 20.88
Pz-S4 New Shallow Piez. 296212.48 877075.50 4.50 40.26
Pz-D4 New Deep Piez. 296211.84 877072.53 4.37 39.48
Pz-S5 New Shallow Piez. 296242.79 877077.08 4.09 70.60
Pz-D5 New Deep Piez. 296242.74 877074.29 3.90 70.41
Pz-OS2 Old Shallow Piez. 296177.60 877065.91 3.34 8.19
Pz-OD5 Old Deep Piez. 296192.34 877067.32 4.47 20.57
OW2 Old Pumping Well 296173.68 877066.86 3.39 5.50
OW1 Old Observation Well 296173.69 877065.74 3.25 6.60
7.2 Executed Wells and Piezometers
The specifications of the well and piezometers were provided in Section 6. In this
section, the variations of the executed elements are listed for record.
- The pumping well was executed according to specifications. The average percentage of
openings was in the order of 9%, slightly less than the required 10%.
- The shallow piezometers were executed to the required depth. The diameter of
the PVC pipe was 2 inches and the diameter of the hole was 8 inches, larger than
minimum required.
- The deep piezometers were executed to the required depth. The diameter of the
PVC pipe was 2 inches and the diameter of the hole was 12 inches, larger than
minimum required.
(23)
ARDAMAN-ACEThe Iconic Tower (T01)
AL-Alamain Downtown Towers, New Alamain City, Egypt
Report on Analysis of Field Pumping Test and
Dewatering System Recommendations
Revision (1)
- For the deep piezometers, factory made bentonite pellets were not available to the
dewatering subcontractor. Due to limitations on time, some alternative
precautions were affected to guard against the top cement/bentonite grout
penetrating the filter and clogging the slotted pipe. Hand-made bentonite balls
coupled with pouring of bentonite was applied on top of the filter. The thickness
of filter above the slotted pipe was increased from 3 m to 4 to 5 m. The thickness
of the bentonite part was increased from 1 m to 2 to 2.5 m, followed by grouting
with cement/bentonite up to ground surface.
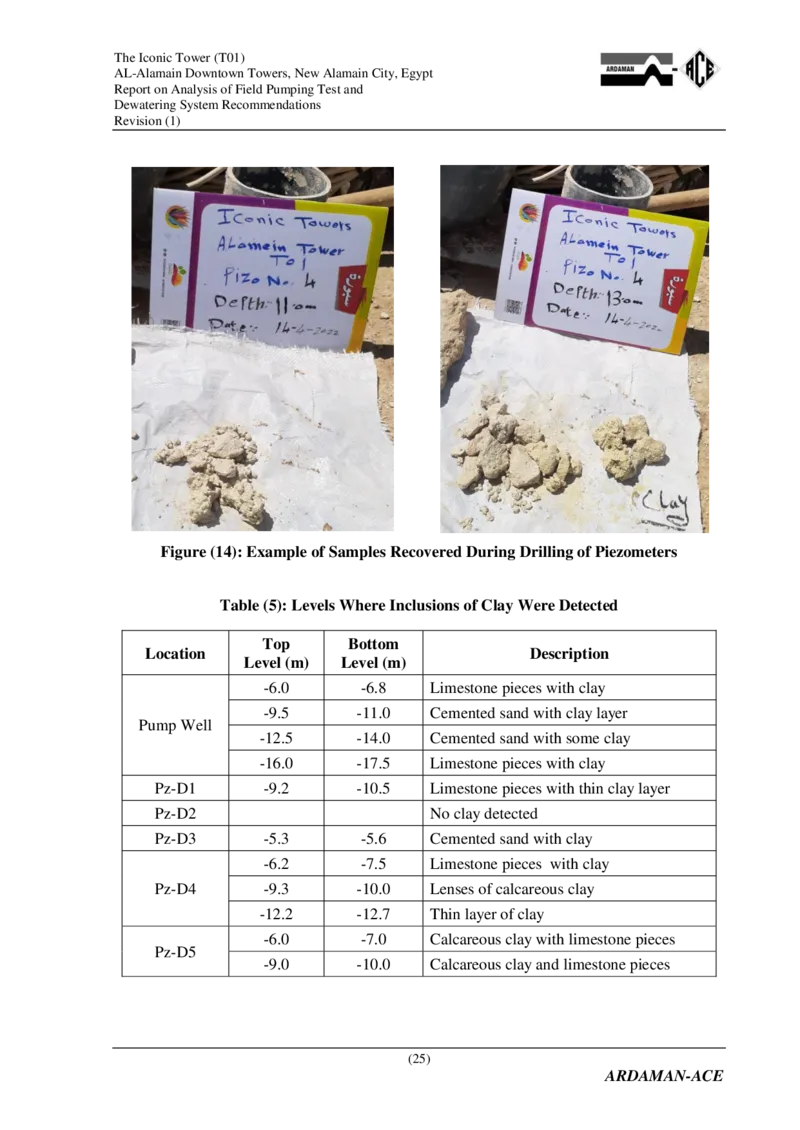
7.3 Description of Soil Encountered During Excavation
The well and the deep piezometers were executing using percussion drilling. Water
was added to facilitate advance of the bailer. This methodology produced disturbed
samples with relatively small recovery. Figure (14) shows example photos of the
recovered samples.
Based on the recovered samples, the general description of the encountered soil/rock
is limestone recovered as pieces in coarse gravel size or cemented calcareous silty
sand or a mixture of both as interlayers. At several stretches of depth, the limestone
is observed to be vuggy/fossiliferous with significant pores. The limestone is more
prevalent than the cemented sand in the deeper layers below level (-7.0).
Of interest is to check the presence of clay layers that could act as an impervious
boundary separating aquifers. Table (5) shows the levels and description of layers
where inclusions of clay were detected, assuming all drilling were carried out from
level (+3.5).
Reviewing Table (5) indicates that no distinct thick clay layer was detected in the
recovered samples. The clay appeared as relatively thin inclusions within the
limestone and cemented sand.
(24)
ARDAMAN-ACEThe Iconic Tower (T01)
AL-Alamain Downtown Towers, New Alamain City, Egypt
Report on Analysis of Field Pumping Test and
Dewatering System Recommendations
Revision (1)
Figure (14): Example of Samples Recovered During Drilling of Piezometers
Table (5): Levels Where Inclusions of Clay Were Detected
Top Bottom
Location Description
Level (m) Level (m)
-6.0 -6.8 Limestone pieces with clay
-9.5 -11.0 Cemented sand with clay layer
Pump Well
-12.5 -14.0 Cemented sand with some clay
-16.0 -17.5 Limestone pieces with clay
Pz-D1 -9.2 -10.5 Limestone pieces with thin clay layer
Pz-D2 No clay detected
Pz-D3 -5.3 -5.6 Cemented sand with clay
-6.2 -7.5 Limestone pieces with clay
Pz-D4 -9.3 -10.0 Lenses of calcareous clay
-12.2 -12.7 Thin layer of clay
-6.0 -7.0 Calcareous clay with limestone pieces
Pz-D5
-9.0 -10.0 Calcareous clay and limestone pieces
(25)
ARDAMAN-ACEThe Iconic Tower (T01)
AL-Alamain Downtown Towers, New Alamain City, Egypt
Report on Analysis of Field Pumping Test and
Dewatering System Recommendations
Revision (1)
7.4 Observation of Water Levels Prior to Test Operation
The water levels in the installed piezometers were recorded for two days prior to the
test operation. The observations are listed in Table (6), accounting for the provided
top levels of piezometer pipes.
Table (6): Observations of Water Levels Prior to Test Operation
Water Level (m) at Different Dates
Top Level
Location 20/4/2022 20/4/2022 21/4/2022 21/4/2022 22/4/2022
of Pipe (m)
Morning Afternoon Morning Afternoon Afternoon
Pz-S1 4.06 0.35 0.35 0.36 0.36 0.38
Pz-D1 4.11 0.32 0.33 0.32 0.35 0.37
Pz-S2 3.97 0.30 0.31 0.32 0.32 0.35
Pz-D2 3.86 0.33 0.34 0.34 0.35 0.37
Pz-S3 4.30 -0.03 -0.02 -0.03 -0.02 0.00
Pz-D3 4.31 0.31 0.31 0.33 0.32 0.34
Pz-S4 4.50 0.34 0.35 0.36 0.36 0.37
Pz-D4 4.37 0.18 0.19 0.20 0.22 0.22
Pz-S5 4.09 0.32 0.31 0.32 0.33 0.33
Pz-D5 3.90 0.27 0.28 0.30 0.30 0.36
Pz-OS2 3.34 0.28 0.32 0.33
Pz-OD5 4.47 0.32 0.35 0.36
The water levels ranged between (-0.03) and (+0.48), with an average around (+0.3).
The discrepancies in water levels in adjacent piezometers and odd levels (such as
Pz-S3) may be attributed to inaccuracies in survey of top level of pipes. However,
such inaccuracies would not affect the analysis of pumping test results, since these
would be based on drawdown relative to the initial water level at each location.
7.5 Checking of Efficiency of Piezometers
In order to check the efficiency of the installed piezometers and operation similar to
a falling head permeability test was conducted. The piezometers pipes were filled to
the top and the drop of water level with time was recorded.
The initial head at the start of the test ranged between 3.2 m and 4.1 m. The head
reduced to 50% in less than 3 minutes and to 10% in about 7 minutes. These
observations indicate adequate response and efficiency.
(26)
ARDAMAN-ACEThe Iconic Tower (T01)
AL-Alamain Downtown Towers, New Alamain City, Egypt
Report on Analysis of Field Pumping Test and
Dewatering System Recommendations
Revision (1)
7.6 Sequence of Test Operation
The original recommended sequence of test operation was given in Section (6.6).
The test was supposed to be conducted on continuous stages of discharge:
50 m3/hour, 100 m3/hour and 150 m3/hour. The first two stages were to be
maintained until steady state conditions are reached and the last stage maintained for
24 hours.
During the actual operation of the test on-site, the discharged water was dumped in
intermediary tanks. The water from the tanks was then discharged outside the site
using suction-delivery pumps. The combined capacity of these pumps could not
handle the discharge from the test for a sustained period of time and the water
overflowed from tanks after some time and the test had to be stopped.
The actual sequence of test operation is presented in Table (7):
Table (7): Sequence of Executed Tests – Long Well
Actual Time to
Target Total
Test Average Start End Steady
Date Discharge Time
No. Discharge Time Time State
(m3/hour) (hour)
(m3/hour) (hour)
1 22/4/2022 50 50 1:50 pm 7:50 pm 6.0 1.5
2 23/4/2022 100 102 8:20 am 2:20 pm 6.0 3.0
3 24/4/2022 150 122 9:23 am 3:23 pm 6.0 4.0
4 25/4/2022 150 126 9:30 am 11:30 am 2.0 --
Following Test No. (3), observations of recovery with time were recorded for two
hours. Within the two hours of observation the recovery of drawdown ranged
between 70% and 100% with an average around 95%.
It is noted that the supplied pump could not achieve the required discharge of
150 m3/hour. Test No. (4) was conducted with the pump level raised by 4 m above
its original level in an attempt to achieve larger discharge. The attempt did not
produce any appreciable increase of discharge.
The complete record of tests readings is provided in Appendix (A.1)
(27)
ARDAMAN-ACEThe Iconic Tower (T01)
AL-Alamain Downtown Towers, New Alamain City, Egypt
Report on Analysis of Field Pumping Test and
Dewatering System Recommendations
Revision (1)
8. Presentation of Results of Field Pumping Test – Long Well
The records of the pumping test for each discharge are provided in Appendix (A.1). For each
observation point (piezometer or well), the steady state drawdown (DD) is inferred from the
pump test records. The drawdown is the reduction in water level relative to the water level
before start of pumping. The results are summarized in Table (8).
Table (8): Summary of Steady State Drawdown – Long Well
Distance to Drawdown (m)
ID Description Pumping Q = 50 Q = 100 Q = 122
Well (m) m3/hour m3/hour m3/hour
Pumping Well –
WF(*) -- 0.27 0.74 1.28
Filter Piezometer
S1 New - Shallow 4.70 0.10 0.28 0.41
S2 New - Shallow 6.01 0.13 0.27 0.38
S3 New - Shallow 10.06 0.07 0.10 0.23
S4 New - Shallow 10.69 0.04 0.10 0.14
S5 New - Shallow 20.00 0.02 0.07 0.09
D1 New – Deep 20.88 0.07 0.20 0.27
D2 New – Deep 40.26 0.06 0.20 0.28
D3 New – Deep 39.48 0.01 0.03 0.05
D4 New – Deep 70.60 0.01 0.02 0.01
D5 New – Deep 70.41 0.05 0.01 0.01
OW2(*) Old Pumping Well 8.19 0.20 0.41
OW1(*) Old Observation Well 20.57 0.32 0.40
OS2(*) Old – Shallow 5.50 0.09 0.29 0.38
OD5(*) Old - Deep 6.60 0.06 0.15 0.21
(*) Observations are considered mixed – No distinction between shallow and deep
It is noted that in the deep piezometer (OD5) of the previous test there was no
grouted seal separating the deep water level of the upper layers during pumping,
therefore, the conditions are considered as mixed. This would also apply to the wells
of the previous test and the current pumping well.
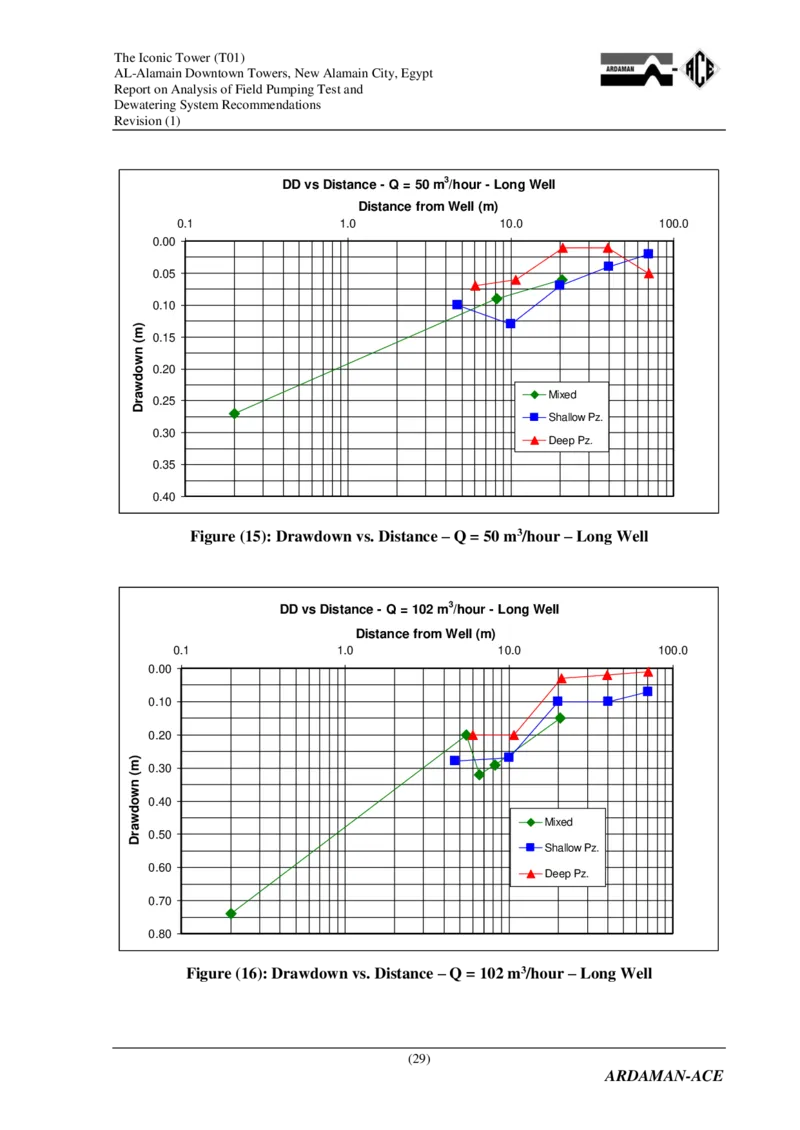
Figures (15) to (17) show plots of drawdown versus distance from pumping well,
with distance plotted on logarithmic scale, for the three discharge rates (Q).
(28)
ARDAMAN-ACEThe Iconic Tower (T01)
AL-Alamain Downtown Towers, New Alamain City, Egypt
Report on Analysis of Field Pumping Test and
Dewatering System Recommendations
Revision (1)
(29)
ARDAMAN-ACE
0
0
0
0
0
0
0
0
0
.0
.0
.1
.1
.2
.2
.3
.3
.4
0
5
0
5
0
5
0
5
0
0 .1
D D v s D is t a
1 .0
n c
D
e
is
- Q
t a n
=
c e
5
f
0 m
r o m
3 /h
W
o
e
u r -
ll ( m
L
)
o
1
n g
0 .0
W e ll
1 0 0 .0
)
m
(
n
w
o
d
w
a
r
D
M
S
D
ix e d
h a llo w
e e p P
P
z .
z .
Figure (15): Drawdown vs. Distance – Q = 50 m3/hour – Long Well
DD vs Distance - Q = 102 m3/hour - Long Well
Distance from Well (m)
0.1 1.0 10.0 100.0
0.00
0.10
0.20
)
m
0.30
(
n
w
o 0.40
d
w Mixed
a
r 0.50
D
Shallow Pz.
0.60
Deep Pz.
0.70
0.80
Figure (16): Drawdown vs. Distance – Q = 102 m3/hour – Long WellThe Iconic Tower (T01)
AL-Alamain Downtown Towers, New Alamain City, Egypt
Report on Analysis of Field Pumping Test and
Dewatering System Recommendations
Revision (1)
(30)
ARDAMAN-ACE
0
0
0
0
0
1
1
1
.0
.2
.4
.6
.8
.0
.2
.4
0
0
0
0
0
0
0
0
0 .1
D D v s D is t
1
a n
.0
c
D
e
is
- Q
t a n
=
c e
1
f
2 2
r o
m
m
3
W
/h
e
o u
ll (
r
m
- L
)
1
o
0
n
.0
g W e ll
1 0 0 .0
)
m
(
n
w
o
d
w
a
r D
M
S
D
ix e d
h a llo w
e e p P
P
z .
z .
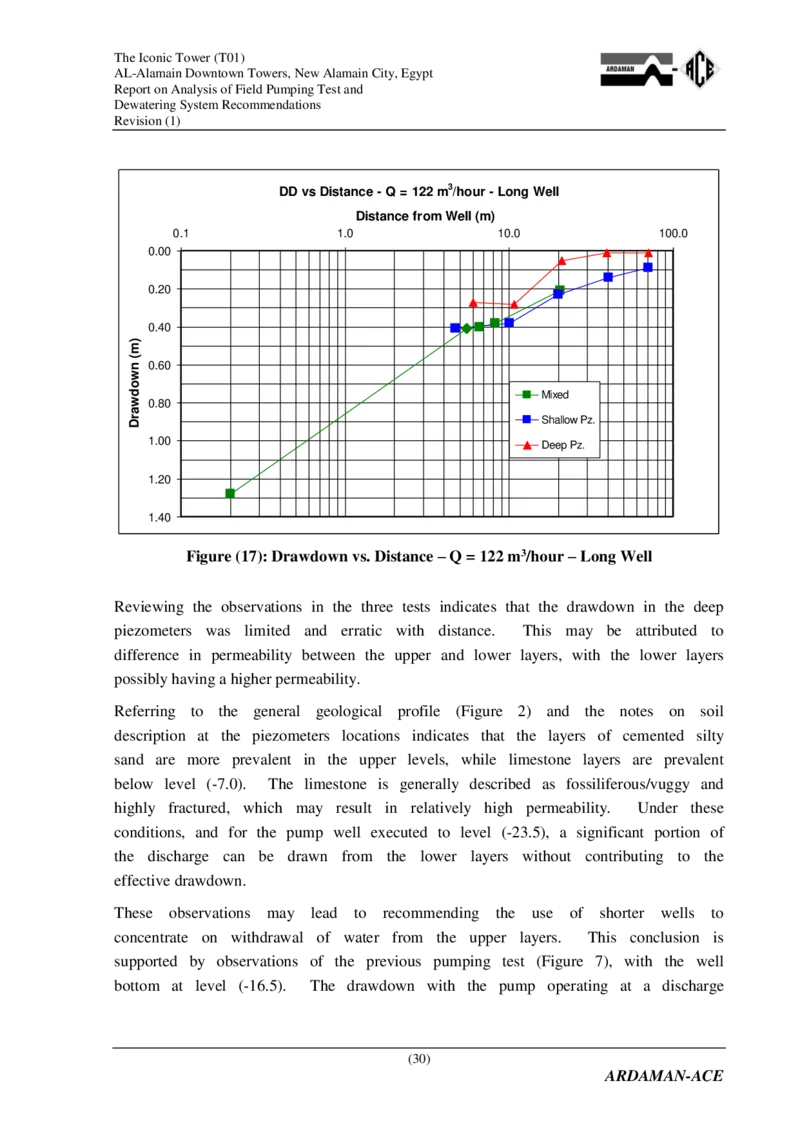
Figure (17): Drawdown vs. Distance – Q = 122 m3/hour – Long Well
Reviewing the observations in the three tests indicates that the drawdown in the deep
piezometers was limited and erratic with distance. This may be attributed to
difference in permeability between the upper and lower layers, with the lower layers
possibly having a higher permeability.
Referring to the general geological profile (Figure 2) and the notes on soil
description at the piezometers locations indicates that the layers of cemented silty
sand are more prevalent in the upper levels, while limestone layers are prevalent
below level (-7.0). The limestone is generally described as fossiliferous/vuggy and
highly fractured, which may result in relatively high permeability. Under these
conditions, and for the pump well executed to level (-23.5), a significant portion of
the discharge can be drawn from the lower layers without contributing to the
effective drawdown.
These observations may lead to recommending the use of shorter wells to
concentrate on withdrawal of water from the upper layers. This conclusion is
supported by observations of the previous pumping test (Figure 7), with the well
bottom at level (-16.5). The drawdown with the pump operating at a dischargeThe Iconic Tower (T01)
AL-Alamain Downtown Towers, New Alamain City, Egypt
Report on Analysis of Field Pumping Test and
Dewatering System Recommendations
Revision (1)
30 m3/hour was somewhat higher than the corresponding drawdown at 50 m3/hour in
the current test with deeper well.
For this reason, an additional pumping test was recommended and executed using
a short well with the current observation points. The execution and results of this
additional test are given later in this document.
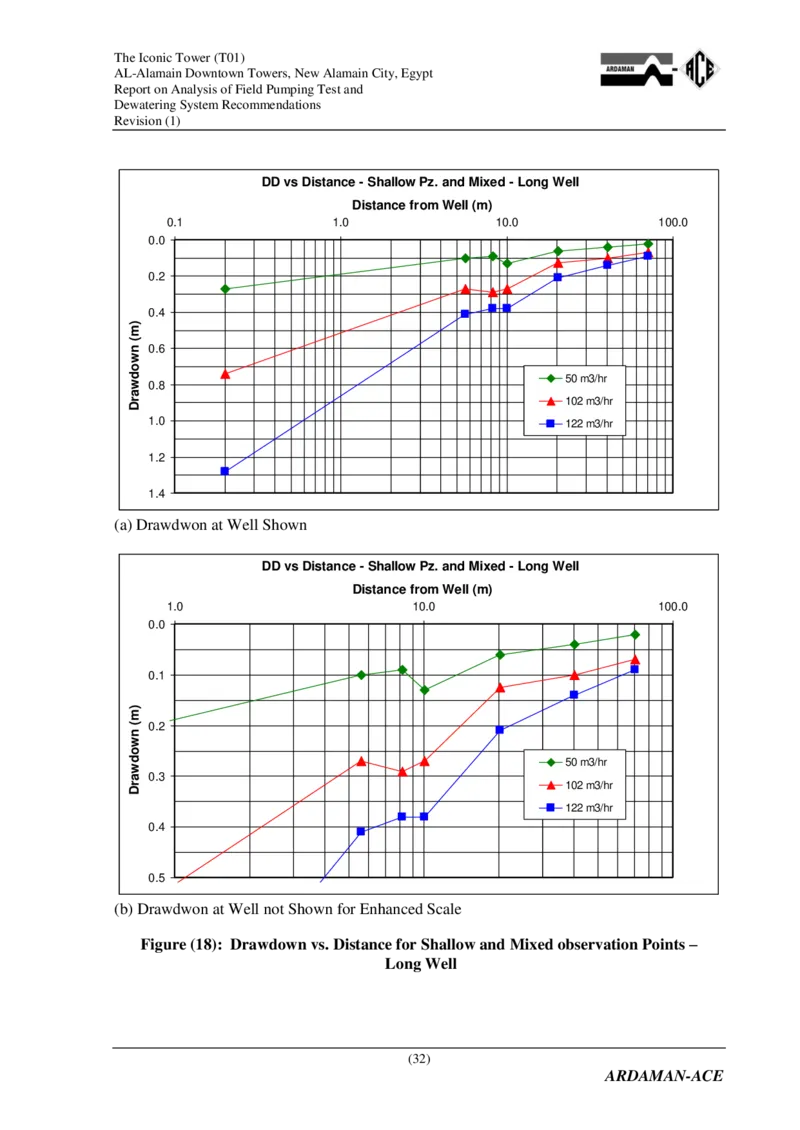
Given the above considerations, the analysis would concentrate on the observations
in shallow piezometers taking into account that the required drawdown is mainly
within the upper layers. The observations of the shallow piezometers and the mixed
conditions are integrated and averaged as given in Table (9).
Table (9): Average Drawdown of Shallow and Mixed Observations – Long Well
Average Average Drawdown (m)
Distance to
ID Q = 50 Q = 100 Q = 122
Pumping
m3/hour m3/hour m3/hour
Well (m)
WF -- 0.27 0.74 1.28
S1 + OW2 + OW1 5.60 0.10 0.27 0.41
OS2 8.19 0.09 0.29 0.38
S2 10.06 0.13 0.27 0.38
S3 + OD5 20.29 0.06 0.13 0.21
S4 40.26 0.04 0.10 0.14
S5 70.60 0.02 0.07 0.09
Figure (18) shows the plot of drawdown versus distance for the combined
observations of shallow and mixed piezometers.
(31)
ARDAMAN-ACEThe Iconic Tower (T01)
AL-Alamain Downtown Towers, New Alamain City, Egypt
Report on Analysis of Field Pumping Test and
Dewatering System Recommendations
Revision (1)
(32)
ARDAMAN-ACE
0
0
0
0
0
1
1
1
.0
.2
.4
.6
.8
.0
.2
.4
0 .1
D D v s D is t a n
1
c
.0
e - S
D is t
h
a
a
n
llo
c e
w
f
P
r o
z
m
. a
W
n d
e
M
ll (
ix
m
e
)
d
1
- L
0 .0
o n g W e ll
1 0 0 .0
)
m
(
n
w
o
d
w
a
r
D
5
1
1
0
0
2
m 3
2 m
2 m
/h r
3 /h
3 /h
r
r
(a) Drawdwon at Well Shown
DD vs Distance - Shallow Pz. and Mixed - Long Well
Distance from Well (m)
1.0 10.0 100.0
0.0
0.1
)
m
( 0.2
n
w
o
d 50 m3/hr
w
a 0.3
r 102 m3/hr
D
122 m3/hr
0.4
0.5
(b) Drawdwon at Well not Shown for Enhanced Scale
Figure (18): Drawdown vs. Distance for Shallow and Mixed observation Points –
Long WellThe Iconic Tower (T01)
AL-Alamain Downtown Towers, New Alamain City, Egypt
Report on Analysis of Field Pumping Test and
Dewatering System Recommendations
Revision (1)
9. Execution and Results of Pumping Test Using Short Well
Following the observations of pumping test using the long well, an additional
pumping test was recommended and executed using a relatively shorter well.
The purpose of the additional pumping test with shallow well was to allow possible
optimization of the system, if the observations by pumping from the upper layers only would
indicate lower permeability. In addition the test could confirm the ability of the shorter well
to provide the required discharge.
The specifications of the short well were the same as for long well (Section 6.3 and Figure
10), except that the bottom level was at (-14.5) instead of (-23.5). The same piezometers were
used for observations. The location of the short well was close to that of the long well as
shown in Figure (13).
Table (10) shows the coordinates of the short well, the distances between
observation points and pumping well and the level of top of pipe from which depth
of water is measured is also indicated.
Table (10): As-Built Coordinates and Levels – Short Well Test
Coordinates (m) Distance to
Level
ID Description Pumping
X Y (m)
Well (m)
Pump Piezometer in Well 4.38 --
296173.246 877070.291
Well Piezometer in Filter 3.69 --
Pz-S1 New Shallow Piez. 296176.91 877073.37 4.02 4.79
Pz-D1 New Deep Piez. 296178.13 877070.51 4.12 4.89
Pz-S2 New Shallow Piez. 296182.29 877073.81 3.39 9.70
Pz-D2 New Deep Piez. 296182.96 877070.85 3.86 9.73
Pz-S3 New Shallow Piez. 296192.24 877074.39 4.30 19.43
Pz-D3 New Deep Piez. 296193.22 877071.42 4.30 20.01
Pz-S4 New Shallow Piez. 296212.48 877075.50 4.50 39.58
Pz-D4 New Deep Piez. 296211.84 877072.53 4.38 38.65
Pz-S5 New Shallow Piez. 296242.79 877077.08 4..08 69.88
Pz-D5 New Deep Piez. 296242.74 877074.29 3.90 69.60
Pz-OS2 Old Shallow Piez. 296177.60 877065.91 3.34 6.17
Pz-OD5 Old Deep Piez. 296192.34 877067.32 4.47 19.33
OW2 Old Pumping Well 296173.68 877066.86 3.39 3.45
OW1 Old Observation Well 296173.69 877065.74 3.25 4.57
(33)
ARDAMAN-ACEThe Iconic Tower (T01)
AL-Alamain Downtown Towers, New Alamain City, Egypt
Report on Analysis of Field Pumping Test and
Dewatering System Recommendations
Revision (1)
The recommended sequence of test was to carry out the test in a single stage with
target discharge of 150 m3/hour until steady state conditions for 4 hours were
achieved. A first test was executed for a short period of time (2.5 hours) and the
average discharge was 115 m3/hour. The readings were stable in the last half hour,
but steady state conditions could not be confirmed. A second test was carried out
with observations up to 7 hours. The average achievable discharge was
128 m3/hour. These conditions are summarized in Table (11)
Table (11): Sequence of Executed Tests – Short Well Test
Actual Time to
Target Total
Test Average Start End Steady
Date Discharge Time
No. Discharge Time Time State
(m3/hour) (hour)
(m3/hour) (hour)
1 8/5/2022 150 115 1:50 pm 4:10 pm 2.5 2.0
2 10/5/2022 150 128 11:00 am 6:00 pm 7.0 3.0
The records of the pumping tests using the short well are provided in
Appendix (A.2). Table (12) shows a summary of the observed steady-state
drawdown. The observations of the shallow piezometers and the mixed conditions
are integrated and averaged as given in Table (13).
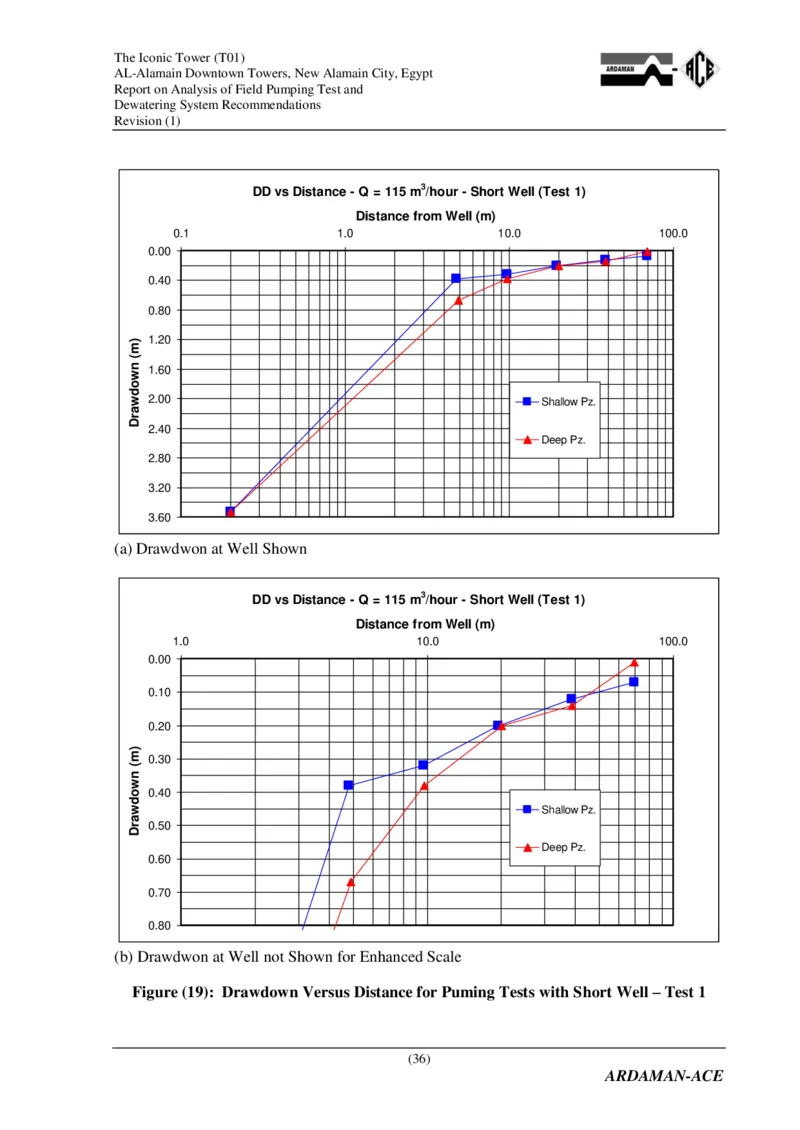
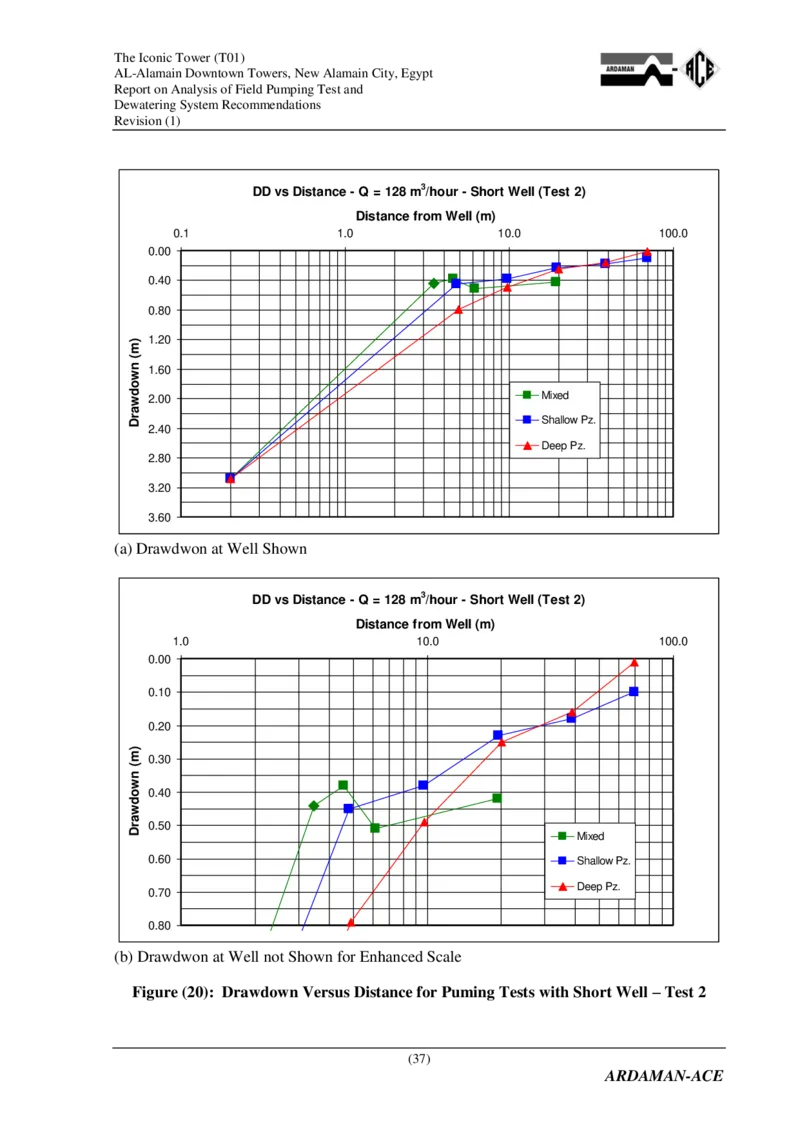
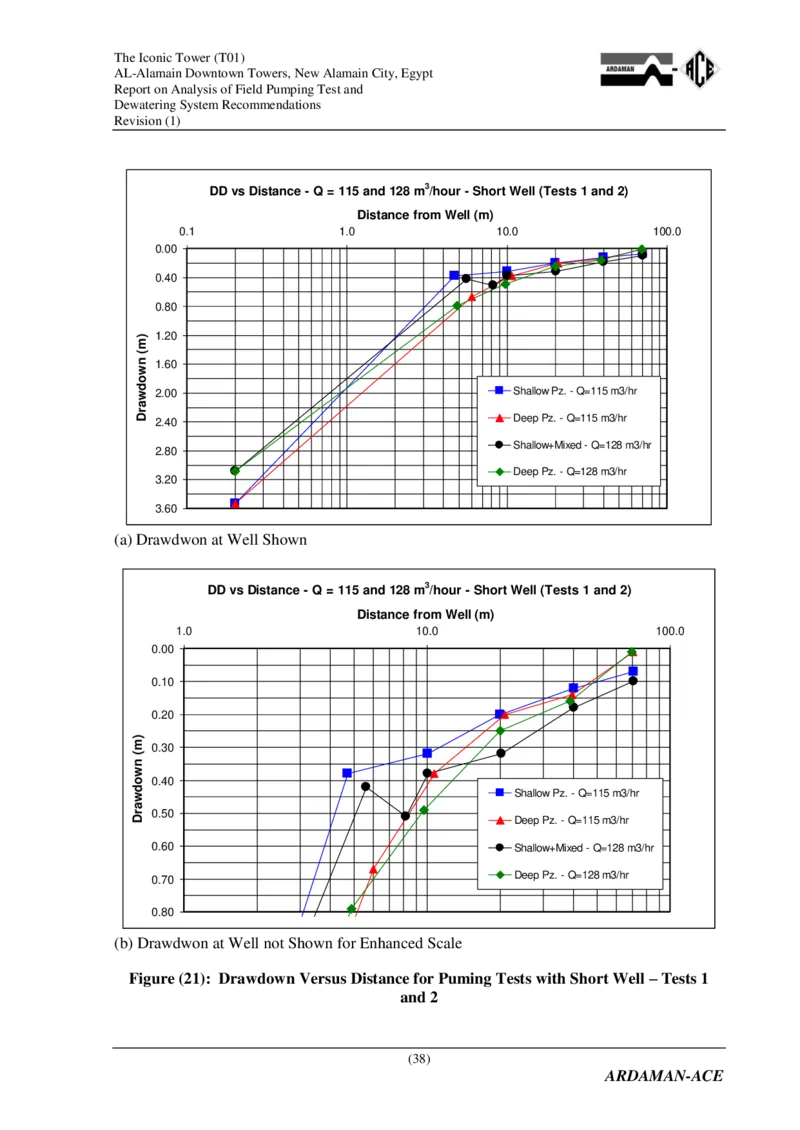
Figures (19) and (20) show plots of drawdown versus distance from well for the two tests
carried out using the short well. Figure (21) shows the combined results for the two tests.
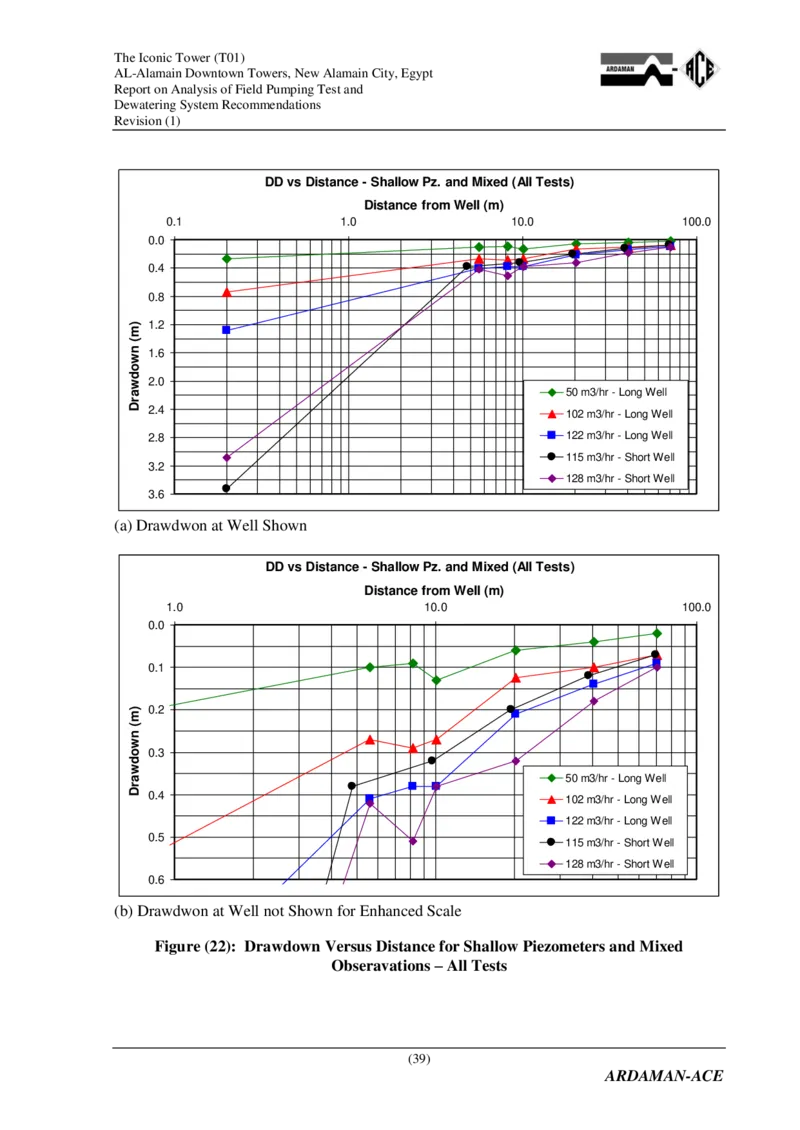
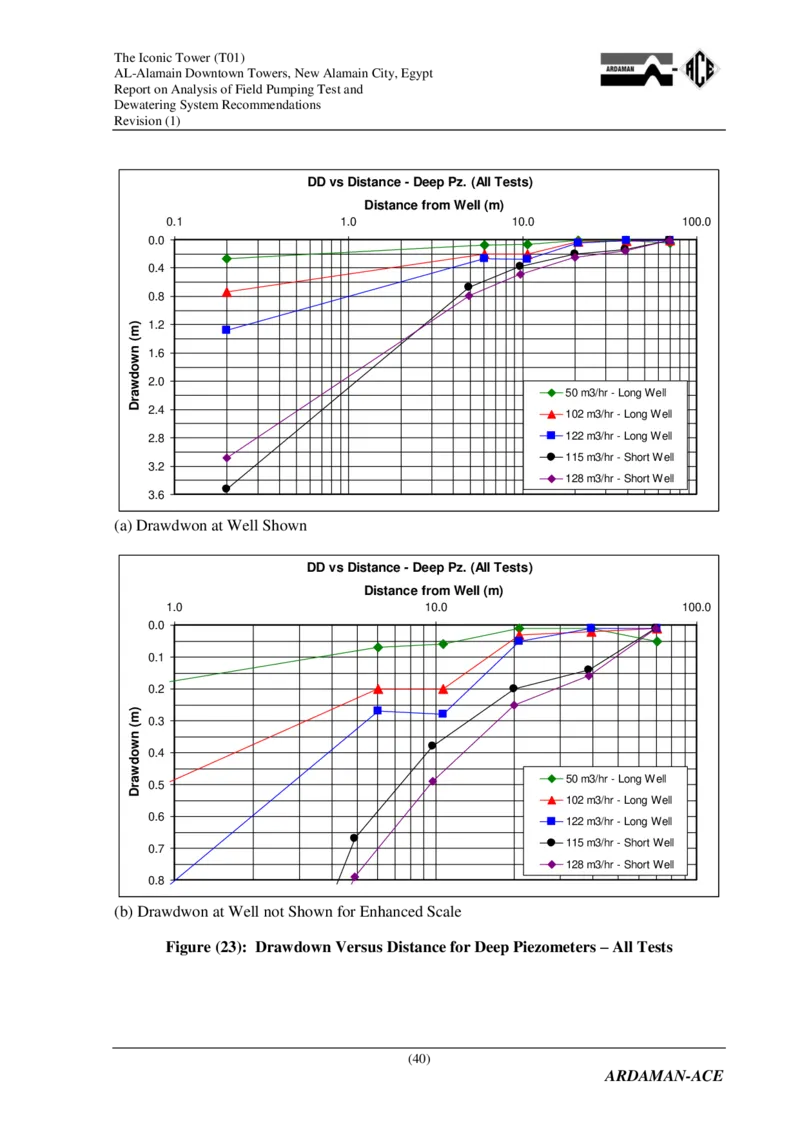
Figures (22) and (23) show the observed drawdown for the case of short well in
comparison with observations for the case of the long well, for both the shallow and
deep piezometers, respectively.
Reviewing the results of the pumping test using the short well indicated the following:
- The test confirmed that the short well could achieve drawdown similar to the long well
and at the same discharge.
- The derived overall coefficient of permeability is somewhat less than for the case of the
long well, with associated reduction in the radius of influence. The drawdown at the
well was more, probably affected by increased partial penetration effect.
- In both cases the long well and the short well, the provided pump could not achieve the
target discharge of 150 m3/hour, even with the long well.
These observations would be accounted for in the choice of design parameters of the
dewatering system.
(34)
ARDAMAN-ACEThe Iconic Tower (T01)
AL-Alamain Downtown Towers, New Alamain City, Egypt
Report on Analysis of Field Pumping Test and
Dewatering System Recommendations
Revision (1)
Table (12): Summary of Steady State Drawdown – Short Well Test
Distance to Drawdown (m)
ID Description Pumping Q = 115 Q = 128
Well (m) m3/hour m3/hour
Pumping Well –
WF(*) -- 3.53 3.08
Filter Piezometer
S1 New - Shallow 4.79 0.38 0.45
S2 New - Shallow 4.89 0.32 0.38
S3 New - Shallow 9.70 0.20 0.23
S4 New - Shallow 9.73 0.12 0.18
S5 New - Shallow 19.43 0.07 0.10
D1 New – Deep 20.01 0.67 0.79
D2 New – Deep 39.58 0.38 0.49
D3 New – Deep 38.65 0.20 0.25
D4 New – Deep 69.88 0.14 0.16
D5 New – Deep 69.60 0.01 0.01
OW2(*) Old Pumping Well 6.17 0.44
OW1(*) Old Observation Well 19.33 0.38
OS2(*) Old – Shallow 3.45 0.51
OD5(*) Old - Deep 4.57 0.42
(*) Observations are considered mixed – No distinction between shallow and deep
Table (13): Average Drawdown of Shallow and Mixed Observations – Short Well Test
Average Drawdown
Distance to (m)
ID
Pumping Q = 128
Well (m) m3/hour
WF -- 3.08
S1 + OW2 + OW1 5.60 0.42
OS2 8.19 0.51
S2 10.06 0.38
S3 + OD5 20.29 0.32
S4 40.26 0.18
S5 70.60 0.10
(35)
ARDAMAN-ACEThe Iconic Tower (T01)
AL-Alamain Downtown Towers, New Alamain City, Egypt
Report on Analysis of Field Pumping Test and
Dewatering System Recommendations
Revision (1)
(36)
ARDAMAN-ACE
0
0
0
1
1
2
2
2
3
3
.0
.4
.8
.2
.6
.0
.4
.8
.2
.6
0
0
0
0
0
0
0
0
0
0
0 .1
D D v s D is t a n c e
1
-
.0
Q
D
=
is t
1
a n
1 5 m
c e f
3 /h
r o m
o u
W
r - S h
e ll ( m
o r t
)
1
W
0 .0
e ll ( T e s t 1 )
1 0 0 .0
)
m
(
n
w
o
d
w
a
r
D
S
D
h
e
a
e
llo w
p P
P
z .
z .
(a) Drawdwon at Well Shown
0
0
0
0
0
0
0
0
0
.0
.1
.2
.3
.4
.5
.6
.7
.8
0
0
0
0
0
0
0
0
0
1 .0
D D v s D is t a n c e - Q
D
=
is t
1
a n
3 1 5 m /h
c e f r o m
1 0 .0
o u
W
r - S h
e ll ( m
o r
)
t W e ll ( T e s t 1 )
1 0 0 .0
)
m
(
n
w
o
d
w
a
r
D
S
D
h
e
a
e
llo w
p P
P
z .
z .
(b) Drawdwon at Well not Shown for Enhanced Scale
Figure (19): Drawdown Versus Distance for Puming Tests with Short Well – Test 1The Iconic Tower (T01)
AL-Alamain Downtown Towers, New Alamain City, Egypt
Report on Analysis of Field Pumping Test and
Dewatering System Recommendations
Revision (1)
(37)
ARDAMAN-ACE
0
0
0
1
1
2
2
2
3
3
.0
.4
.8
.2
.6
.0
.4
.8
.2
.6
0
0
0
0
0
0
0
0
0
0
0 .1
D D v s D is t a n c e
1
-
.0
Q
D
=
is t
1
a n
2 8 m
c e f
3 /h
r o m
o u
W
r - S h
e ll ( m
o r t
)
1
W
0 .0
e ll ( T e s t 2 )
1 0 0 .0
)
m
(
n
w
o
d w
a
r D
M
S
D
ix e d
h a llo w
e e p P
P
z .
z .
(a) Drawdwon at Well Shown
0
0
0
0
0
0
0
0
0
.0
.1
.2
.3
.4
.5
.6
.7
.8
0
0
0
0
0
0
0
0
0
1 .0
D D v s D is t a n c e - Q
D
=
is t
1
a n
3 2 8 m /h
c e f r o m
1 0 .0
o u
W
r - S h
e ll ( m
o r
)
t W e ll ( T e s t 2 )
1 0 0 .0
)
m
(
n
w
o
d
w
a
r
D
M
S
D
ix e d
h a llo w
e e p P
P
z .
z .
(b) Drawdwon at Well not Shown for Enhanced Scale
Figure (20): Drawdown Versus Distance for Puming Tests with Short Well – Test 2The Iconic Tower (T01)
AL-Alamain Downtown Towers, New Alamain City, Egypt
Report on Analysis of Field Pumping Test and
Dewatering System Recommendations
Revision (1)
(38)
ARDAMAN-ACE
0
0
0
1
1
2
2
2
3
3
.0
.4
.8
.2
.6
.0
.4
.8
.2
.6
0
0
0
0
0
0
0
0
0
0
0 .1
D D v s D is t a n c e - Q = 1
1
1 5
.0
a n
D is
d
t a
1
n
2
c
8
e
m
f r
3
o
/h
m
o u
W
r - S
e ll (
h
m
o
)
r
1
t W
0 .0
e ll ( T e s t s 1 a n d 2 )
1 0 0 .0
)
m
(
n
w
o
d w
a
r
D
S
D
S
D
h
e
h
e
a
e
a
e
llo w
p P
llo w
p P
P z . - Q = 1
z . - Q = 1 1 5
+ M ix e d - Q
z . - Q = 1 2 8
1 5 m 3 /h
m 3 /h r
= 1 2 8 m
m 3 /h r
r
3 /h r
(a) Drawdwon at Well Shown
DD vs Distance - Q = 115 and 128 m3/hour - Short Well (Tests 1 and 2)
Distance from Well (m)
1.0 10.0 100.0
0.00
0.10
0.20
)
m 0.30
(
n
w
o 0.40
d Shallow Pz. - Q=115 m3/hr
w
a
r 0.50
D Deep Pz. - Q=115 m3/hr
0.60 Shallow+Mixed - Q=128 m3/hr
Deep Pz. - Q=128 m3/hr
0.70
0.80
(b) Drawdwon at Well not Shown for Enhanced Scale
Figure (21): Drawdown Versus Distance for Puming Tests with Short Well – Tests 1
and 2The Iconic Tower (T01)
AL-Alamain Downtown Towers, New Alamain City, Egypt
Report on Analysis of Field Pumping Test and
Dewatering System Recommendations
Revision (1)
(39)
ARDAMAN-ACE
0
0
0
1
1
2
2
2
3
3
.0
.4
.8
.2
.6
.0
.4
.8
.2
.6
0 .1
D D v s D is t a n c e
1 .0
- S h
D is
a
t a
llo
n c
w
e
P
f r
z
o
. a
m
n
W
d M ix
e ll ( m
e d
)
(
1
A
0
ll T
.0
e s t s )
1 0 0 .0
)
m
(
n
w
o
d
w
a
r
D
5
1
1
1
1
0
0
2
1
2
m 3
2 m
2 m
5 m
8 m
/h r - L o
3 /h r - L
3 /h r - L
3 /h r - S
3 /h r - S
n
o
o
h
h
g
n
n
o
o
W e
g W
g W
rt W
rt W
ll
e ll
e ll
e ll
e ll
(a) Drawdwon at Well Shown
DD vs Distance - Shallow Pz. and Mixed (All Tests)
Distance from Well (m)
1.0 10.0 100.0
0.0
0.1
) 0.2
m
(
n
w
o 0.3
d
w
a 50 m3/hr - Long Well
r
D 0.4
102 m3/hr - Long Well
122 m3/hr - Long Well
0.5
115 m3/hr - Short Well
128 m3/hr - Short Well
0.6
(b) Drawdwon at Well not Shown for Enhanced Scale
Figure (22): Drawdown Versus Distance for Shallow Piezometers and Mixed
Obseravations – All TestsThe Iconic Tower (T01)
AL-Alamain Downtown Towers, New Alamain City, Egypt
Report on Analysis of Field Pumping Test and
Dewatering System Recommendations
Revision (1)
(40)
ARDAMAN-ACE
0
0
0
1
1
2
2
2
3
3
.0
.4
.8
.2
.6
.0
.4
.8
.2
.6
0 .1
D D v s D
1 .0
is t
D
a n
is
c
t a
e
n
-
c
D
e
e e
f r o
p
m
P z
W
. ( A ll T
e ll ( m
e
)
s
1
t s )
0 .0 1 0 0 .0
)
m
(
n
w
o
d
w
a
r
D
5
1
1
1
1
0
0
2
1
2
m 3
2 m
2 m
5 m
8 m
/h r - L o
3 /h r - L
3 /h r - L
3 /h r - S
3 /h r - S
n
o
o
h
h
g
n
n
o
o
W e
g W
g W
rt W
rt W
ll
e ll
e ll
e ll
e ll
(a) Drawdwon at Well Shown
0
0
0
0
0
0
0
0
0
.0
.1
.2
.3
.4
.5
.6
.7
.8
1 .0
D D v s D is t
D
a n
is
c
t a
e
n
-
c
D
e
e e
f r o
1 0
p P z
m W
.0
. ( A ll T
e ll ( m
e
)
s t s )
1 0 0 .0
)
m
(
n
w
o
d
w
a
r
D
5
1
1
1
1
0
0
2
1
2
m 3
2 m
2 m
5 m
8 m
/h r - L o
3 /h r - L
3 /h r - L
3 /h r - S
3 /h r - S
n
o
o
h
h
g
n
n
o
o
W e
g W
g W
rt W
rt W
ll
e ll
e ll
e ll
e ll
(b) Drawdwon at Well not Shown for Enhanced Scale
Figure (23): Drawdown Versus Distance for Deep Piezometers – All TestsThe Iconic Tower (T01)
AL-Alamain Downtown Towers, New Alamain City, Egypt
Report on Analysis of Field Pumping Test and
Dewatering System Recommendations
Revision (1)
10. Design Parameters Based on Pumping Test Results
10.1 Type of Aquifer and Governing Equations
For further analysis of the results of the pumping test, the type of aquifer(s) has to be specified
in order to apply the relevant equations. The choice between unconfined (gravity) aquifer and
confined (artesian) aquifer is based on examination of the soil stratification in the depth of the
water baring layers.
Referring to Section 3 and Figure (3) for soil conditions in the tower region, it is noted that the
clay layer is not continuous throughout the site in a way to form a complete impervious barrier
between two aquifers. The description of soil conditions in the region of the pumping test
(Section 7.3) indicates that there is no distinct clay layer detected in the recovered samples,
with clay appearing in thin layers within the limestone and the cemented sand.
Based on the above, the condition of unconfined aquifer would be applied to the analysis of
the pumping test and the design of the dewatering system.
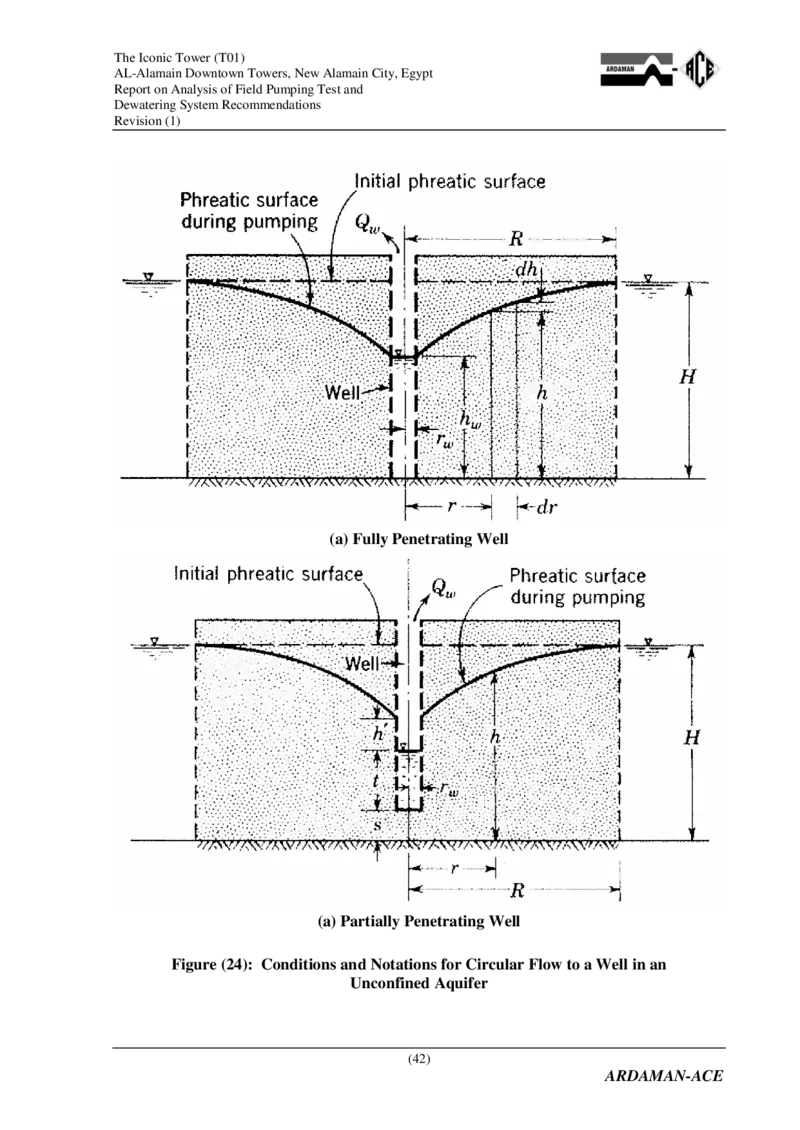
Figure (24) shows the conditions and notations for flow from a circular source to a well in an
unconfined aquifer for the cases of fully penetrating well and partially penetrating well
(reference: Mansour and Kaufman, in Foundation Engineering, G. A, Leonards editor).
The relevant equations for calculating the drawdown at a distance (r) from the pumping well
are as follows.
Q R
H2 h2 w ln .................................................................................................... (1)
π k r
This equation is applicable to a fully penetrating well and to a partially penetrating well at a
distance ratio r/H > 1.5. For distance ratio 0.3 < r/H < 1.5, the following equations apply.
Q Pln(10R/H)
Hh w ........................................................................................ (2)
π k H [1 -0.8(s/H)1.5]
(41)
ARDAMAN-ACE
P 0 . 1 3 l n
R
r
.............................................................................................................. (3)
For estimating permeability (k) from the observations of pumping test at two points located at
distances r and r from the well with corresponding heads h and h , the following is used.
1 2 1 2
Q r
k w ln 2 ................................................................................................... (4)
π (h2 h2) r
2 1 1
This equation is applicable to the far field such that the effect of partial penetration is not
pronounced.The Iconic Tower (T01)
AL-Alamain Downtown Towers, New Alamain City, Egypt
Report on Analysis of Field Pumping Test and
Dewatering System Recommendations
Revision (1)
(a) Fully Penetrating Well
(a) Partially Penetrating Well
Figure (24): Conditions and Notations for Circular Flow to a Well in an
Unconfined Aquifer
(42)
ARDAMAN-ACEThe Iconic Tower (T01)
AL-Alamain Downtown Towers, New Alamain City, Egypt
Report on Analysis of Field Pumping Test and
Dewatering System Recommendations
Revision (1)
The parameters required for the design of the dewatering system are:
- The effective aquifer thickness (H)
- The coefficient of permeability (k)
- The radius of influence (R)
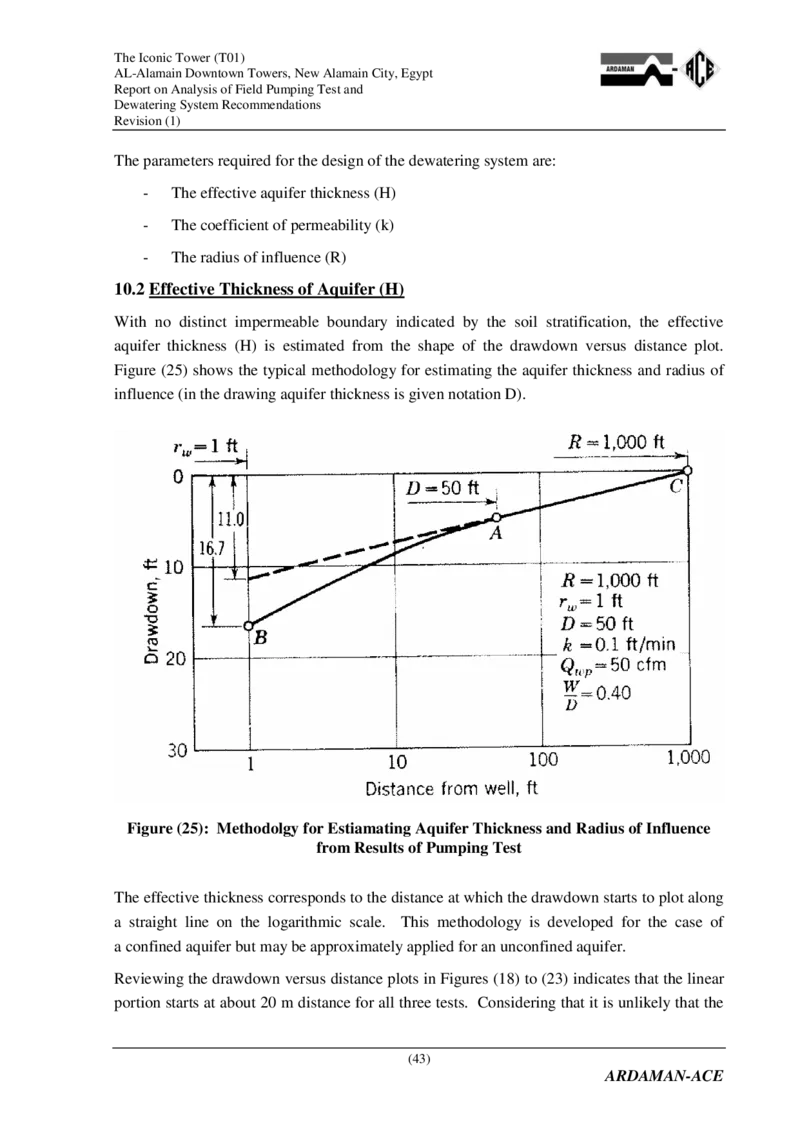
10.2 Effective Thickness of Aquifer (H)
With no distinct impermeable boundary indicated by the soil stratification, the effective
aquifer thickness (H) is estimated from the shape of the drawdown versus distance plot.
Figure (25) shows the typical methodology for estimating the aquifer thickness and radius of
influence (in the drawing aquifer thickness is given notation D).
Figure (25): Methodolgy for Estiamating Aquifer Thickness and Radius of Influence
from Results of Pumping Test
The effective thickness corresponds to the distance at which the drawdown starts to plot along
a straight line on the logarithmic scale. This methodology is developed for the case of
a confined aquifer but may be approximately applied for an unconfined aquifer.
Reviewing the drawdown versus distance plots in Figures (18) to (23) indicates that the linear
portion starts at about 20 m distance for all three tests. Considering that it is unlikely that the
(43)
ARDAMAN-ACEThe Iconic Tower (T01)
AL-Alamain Downtown Towers, New Alamain City, Egypt
Report on Analysis of Field Pumping Test and
Dewatering System Recommendations
Revision (1)
aquifer thickness would be less than the length of the well below water level (24 m for the
case of long well), a conservative value of the aquifer thickness H = 30 m is adopted.
10.3 Coefficient of Permeability (k)
The coefficient of permeability is estimated by applying Equation (4) to the observations in
the far field between points at distances 40 m and 70 m, considering that the aquifer thickness
is 30 m. The results are listed in Table (14) and (15) for the long and short well tests,
respectively. The permeability is provided in units of microns/s (/s) with 1 (/s) =
1x10⁻⁶ m/s,
Table (14): Coefficient of Permeability (k) Estimated from Pumping Test – Long Well
Average Discharge (m3/hour) 50 102 122 Average
Coefficient of Permeability, k (/s) 2071 2882 2027 2330
Table (15): Coefficient of Permeability (k) Estimated from Pumping Test – Short Well
Average Discharge (m3/hour) 115 128 Average
Coefficient of Permeability, k (/s) 1933 1347 1640
This value of derived permeability is relatively high and corresponds to that of coarse gravel
or a mixture of gravel and coarse sand. The permeability value may be influenced by the
presence of porous limestone layers.
However, it is noted that the permeability derived from test with short well is lower,
indicating that the long well is possibly influenced by higher permeability deep layers.
10.4 Radius of Influence (R)
Referring to Figure (25) the radius of influence for a specific pumping test may be estimated
by extrapolation of the straight line portion of the drawdown versus log distance plot to the
point of zero drawdown. Tables (16) and (17) provide the estimates of radius of influence by
extrapolating for the different for the long and short well tests, respectively..
Table (16): Estimates of Radius of Influence (R) – Long Well Tests
Average Discharge (m3/hour) 50 102 122
R (m) as estimated by extrapolation 124 262 194
(44)
ARDAMAN-ACEThe Iconic Tower (T01)
AL-Alamain Downtown Towers, New Alamain City, Egypt
Report on Analysis of Field Pumping Test and
Dewatering System Recommendations
Revision (1)
Table (17): Estimates of Radius of Influence (R) – Short Well Tests
Average Discharge (m3/hour) 115 128
R (m) as estimated by extrapolation 155 143
The radius of influence typically increases with the increase of drawdown. The following
empirical equation is listed in the Egyptian Code and other references for estimating the radius
of influence from the drawdown and the coefficient of permeability.
(45)
ARDAMAN-ACE
R 3 ( D D ) k ( / s ) ..................................................................................................... (5)
where DD is the drawdown, with R given units as applied to the drawdown. For the case of
pumping test the applied drawdown would be that observed at the well. For a dewatering
system with several wells, the drawdown would be the overall reduction of water level in the
dewatered area.
Considering that the required drawdown for dewatering of the lower raft is 4.8 m and that the
permeability ranges between 1400 and 2400 /s, the radius of influence during dewatering of
the lower raft according to Equation (5) would be in range: R = 530 to 705 m
10.5 Recommended Design Parameters
The recommendations for the dewatering system shall be the use of short wells.
Based on the above analysis the parameters recommended for design of the dewatering system
and checking of drawdown are as follows.
- The effective aquifer thickness (H) = 30 m
- The coefficient of permeability (k) = 1600 /s
- The radius of influence (R) = 220 m
11. Dewatering System Components
11.1 System Components
The recommended dewatering system to achieve the required drawdown consists of a set of
deep wells comprising the following:
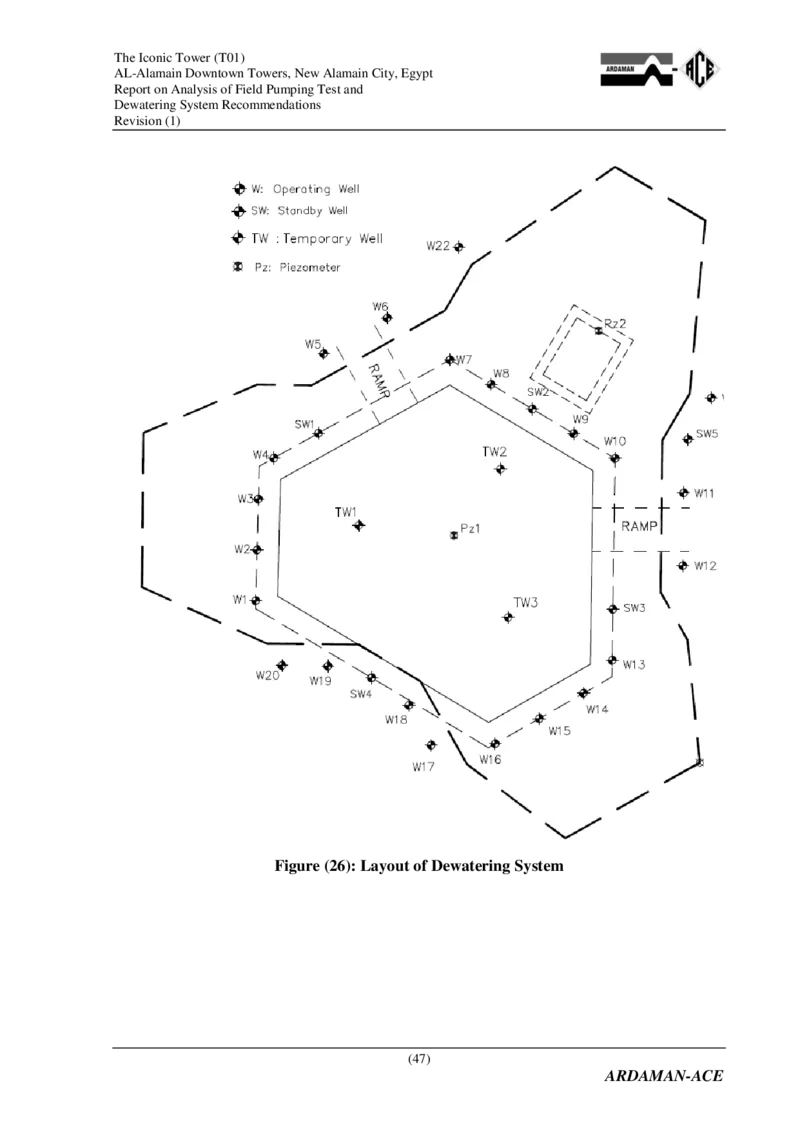
- 22 operating wells denoted “W”
- 5 stand-by wells denoted “SW”
- 3 Temporary wells denoted “TW”
- 2 observation piezometers denoted “Pz”The Iconic Tower (T01)
AL-Alamain Downtown Towers, New Alamain City, Egypt
Report on Analysis of Field Pumping Test and
Dewatering System Recommendations
Revision (1)
11.2 Layout of Dewatering System
Figure (26) shows the recommended distribution of wells in the project area.
Table (18) provides the tentative coordinates of wells and piezometers. The well locations
may be moved up to 2 m in any direction to satisfy site conditions.
The coordinates of wells within the upper and lower rafts are to be adjusted to accommodate
the executed piles layout. The well location should be at mid-distance between the piles as
much as possible.
11.3 Standby Wells and Temporary Wells
The purpose of the standby wells is to act as a quick replacement if any of the operating wells
malfunctions due to pump problems or clogging or pumping excessive fine materials. The
availability of the standby wells allows for quick replacement. The standby wells should be
executed with the operating wells.
Given the limited capacity of the available pumps and the non-homogeneous conditions of the
soil, the standby wells may also be used as backup wells to be operated if the observations
indicate that the required drawdown has not been achieved using the operational wells.
Three temporary wells are indicated within the lower raft area. These wells may be operated
temporarily to accelerate drawdown and start of excavation. They may also be used as
observation wells to confirm that the required drawdown has been achieved prior to full
excavation.
The employment of the temporary wells is optional. It is up to the Contractor (CSCEC) to
decide on the benefit and feasibility of installing and operating these wells.
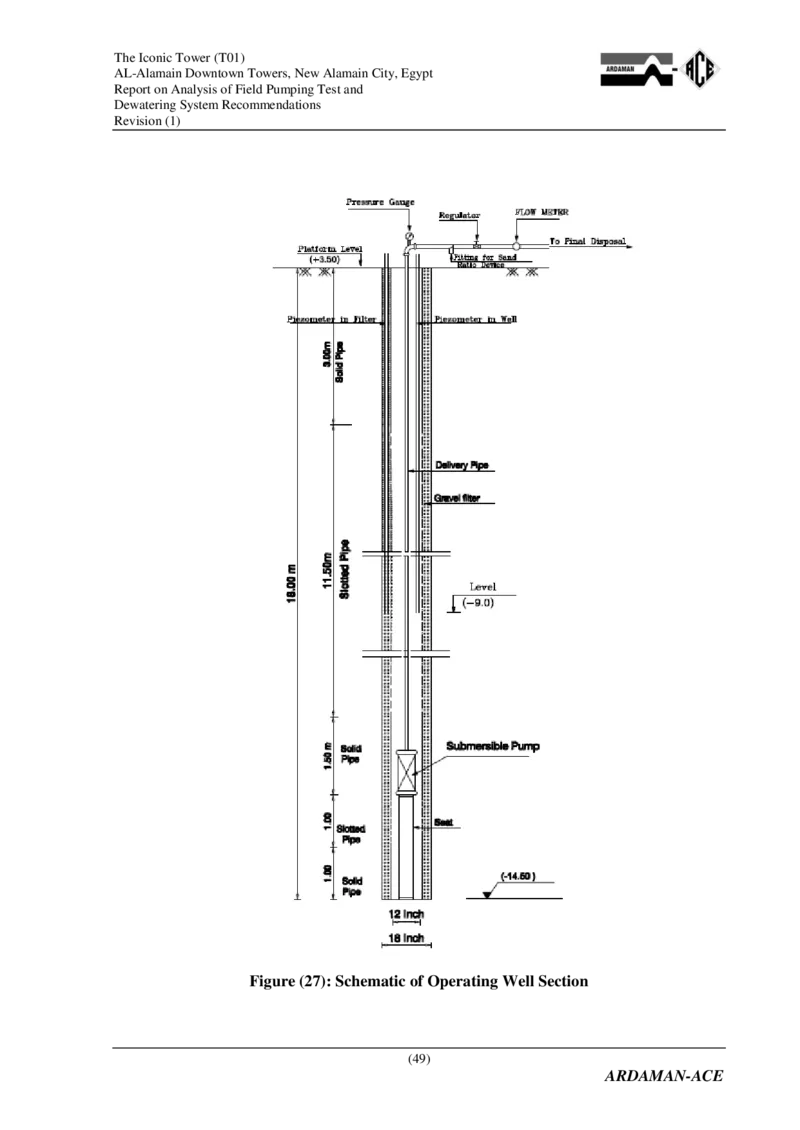
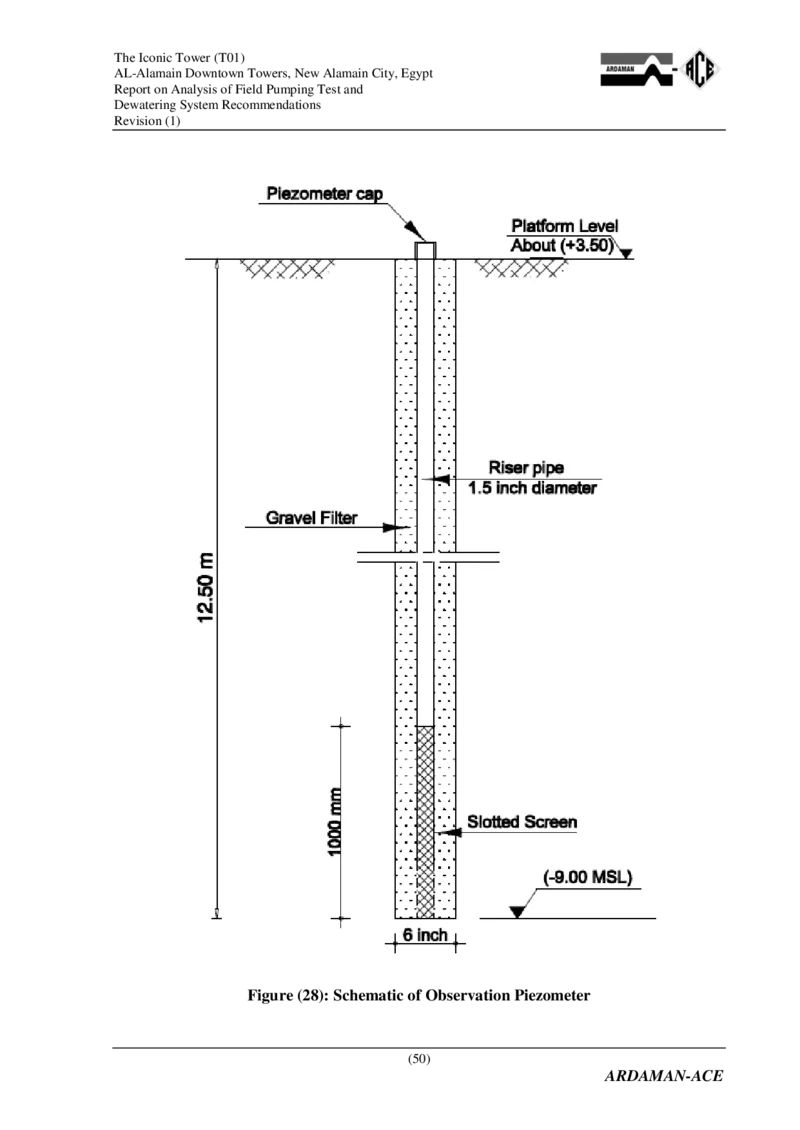
11.4 Specifications of Wells and Piezometers
Figures (27) and (28) show schematic sections of the recommended wells and observation
piezometers. The specifications and requirements are similar to those given on Sections 6.3
and 6.4, with difference in length and bottom level as shown in the figures.
Each well should be supplied with a submersible pump capable of delivering steady state
discharge not less than 120 m3/hour under site conditions.
(46)
ARDAMAN-ACEThe Iconic Tower (T01)
AL-Alamain Downtown Towers, New Alamain City, Egypt
Report on Analysis of Field Pumping Test and
Dewatering System Recommendations
Revision (1)
Figure (26): Layout of Dewatering System
(47)
ARDAMAN-ACEThe Iconic Tower (T01)
AL-Alamain Downtown Towers, New Alamain City, Egypt
Report on Analysis of Field Pumping Test and
Dewatering System Recommendations
Revision (1)
Table (18): Tentative Coordinates of Wells
Coordinate (m)
Well No.
X Y
W1 296166.3 876997.9
W2 296173.2 876998.1
W3 296180.2 876998.3
W4 296185.9 877000.4
W5 296200.2 877007.3
W6 296205.1 877016.0
W7 296199.4 877024.6
W8 296196.0 877030.3
W9 296189.2 877041.6
W10 296185.8 877047.3
W11 296181.1 877056.7
W12 296171.1 877056.6
W13 296158.1 877046.9
W14 296153.5 877043.0
W15 296150.1 877036.9
W16 296146.6 877030.8
W17 296146.4 877022.0
W18 296151.9 877018.9
W19 296157.3 877007.8
W20 296157.4 877001.5
W21 296194.1 877060.5
W222 296214.9 877025.8
SW1 296189.3 877006.5
SW2 296192.6 877035.9
SW3 296165.1 877047.0
SW4 296155.7 877013.8
SW5 296188.5 877057.3
TW1 296176.6 877012.1
TW2 296184.3 877031.5
TW3 296164.0 877032.6
Pz1 296175.2 877025.2
Pz2 296203.4 877045.1
(W: Operating Well; SW: Standby Well; TW: Temporary Well)
(48)
ARDAMAN-ACEThe Iconic Tower (T01)
AL-Alamain Downtown Towers, New Alamain City, Egypt
Report on Analysis of Field Pumping Test and
Dewatering System Recommendations
Revision (1)
Figure (27): Schematic of Operating Well Section
(49)
ARDAMAN-ACEThe Iconic Tower (T01)
AL-Alamain Downtown Towers, New Alamain City, Egypt
Report on Analysis of Field Pumping Test and
Dewatering System Recommendations
Revision (1)
Figure (28): Schematic of Observation Piezometer
(50)
ARDAMAN-ACEThe Iconic Tower (T01)
AL-Alamain Downtown Towers, New Alamain City, Egypt
Report on Analysis of Field Pumping Test and
Dewatering System Recommendations
Revision (1)
11.5 Calculations for Check of Drawdown
The calculation notes for check of drawdown at critical points during operation of the 22 wells
W1 to W22 are provided in Appendix (B).
The calculations are based on applying Equations (1) to (3) together with the recommended
design parameters listed in Section 10.5.
As per the observations in the pumping test, the available pumps could not deliver a discharge
more than 120 m3/hour for a single operating well under current site conditions. This is
considered the nominal discharge that should be supplied by the dewatering subcontractor.
The typical calculations consider the actual average well discharge in a group of wells as
80 m3/hour. This is to account for several factors including the reduction of head on top of
well, the possible effect of presence of clay layers and non-homogeneous layers, as well as the
possible drop in well efficiency with time. If the indicated average discharge of 120 m3/hour
is achieved, this would represent a factor of safety.
The calculations indicated achieving the required drawdown at the critical points.
11.6 Possible Effect of Presence of Clay Layer
Referring to Figure (3), it is noted that the clay layers encountered below the foundation level
are not continuous throughout the site and appear at variable levels and with variable
thickness. The distribution of the clay layers shown in Figure (3) is based on interpretation of
borehole logs available in the factual geotechnical reports. It is possible that variations in the
boundaries of clay layer, both laterally and vertically, be encountered. If the clay layer had
been continuous throughout the site and with appreciable thickness, then other dewatering
systems such as well-points may have been considered.
The design is based on the consideration that the reduction in water head in the areas
surrounding the region of the clay layer would force the water above the clay layer to migrate
to the surrounding edges so as to achieve the required drawdown. This process may take
some time, depending on the actual lateral and vertical distribution of impervious clay across
the site.
If the reduction of groundwater level is taking a long time or if water is locally trapped above
the clay layer, the following remedial measures may be employed:
- Employ surface dewatering using trenches and sumps fitted with surface pumps to
discharge water locally trapped above the clay layer.
(51)
ARDAMAN-ACEThe Iconic Tower (T01)
AL-Alamain Downtown Towers, New Alamain City, Egypt
Report on Analysis of Field Pumping Test and
Dewatering System Recommendations
Revision (1)
- Install vertical drains to transfer the trapped water into the lower aquifer. The vertical
drains shall consist of 12 inch holes drilled to a depth of 4 m below the bottom of the
clay layer and filled with gravel filter material.
The effect of clay layer and the need for the above additional measures would depend on the
initial observations after operation of the dewatering system.
11.7 Sequence of System Operation
One scenario for execution of the foundations could have been to install and operate the wells
and execute the lower deep raft first, followed by decommissioning of most of the wells
before execution of the upper raft.
CSCEC has indicated that the project time schedule does not allow for such scenario and that
both the lower and upper rafts would be executed simultaneously.
In addition, the project time schedule would not allow for sequential operation of wells with
monitoring to allow fine tuning of the design.
Based on the above considerations, the following steps are recommended:
- Operate all 22 wells W1 to W22.
- The water levels in Pz1, Pz2 and all operating shall be observed until steady state
conditions have been reached. The discharge rate from each well shall be recorded.
- If the required drawdown has not been reached, operate the 5 standby wells and
recheck water levels.
11.8 General Recommendations and Notes
- It is important that each well be supplied with its own flow-meter as specified in this
report in order to monitor the actual discharge from each well.
- It is important that the well specifications in terms of percentage of openings be applied to
avoid a reduction in well capacity.
- The quality of the output water from each well should be periodically monitored to ensure
that the well is not withdrawing fine soil materials to avoid soil disturbance.
- The discharge point of the output water from the system operation should be chosen so as
to avoid water recharge in the area of the project.
(52)
ARDAMAN-ACEThe Iconic Tower (T01)
AL-Alamain Downtown Towers, New Alamain City, Egypt
Report on Analysis of Field Pumping Test and
Dewatering System Recommendations
Revision (1)
12. Closing Ream arks
The recommendations given in this report are based on observations recorded during field
pumping tests and on the available information on soil conditions in the geotechnical reports
provided to us.
The specifications and recommendations of the dewatering system provided in this report
should be strictly followed.
The soil conditions are considered non-homogenous both in the lateral and vertical extents. If
significant deviations from the interpreted model are observed during execution we should be
consulted for adjustment and/or modifications..
ARDAMAN -ACE
Dr. Mohamed Sheta
Consulting Engineer, P. Eng.
General Manager
(53)
ARDAMAN-ACEThe Iconic Tower (T01)
AL-Alamain Downtown Towers, New Alamain City, Egypt
Report on Analysis of Field Pumping Test and
Dewatering System Recommendations
Appendix (A)
Records of Field Pumping Test
ARDAMAN-ACEThe Iconic Tower (T01)
AL-Alamain Downtown Towers, New Alamain City, Egypt
Report on Analysis of Field Pumping Test and
Dewatering System Recommendations
A.1 Tests with Long Well
ARDAMAN-ACETower T01
Alamein Downtown Towers
Record of Pumping Test
Well Bottom Level at (-23.5)
Target Discharge 50 m3/hour
Reading Time Pz-W-I Pz-W-F
Inside Well Well Filter
Flow
Time
Meter Discharge
Date Incr.
hr min
am /
(min)
Reading (m3/hr) Top
4.47
Top
4.28
pm (m3) Level Level
Depth Depth
Level Level
(m) (m)
1 50 P.M. 30.3 4.34 0.13 3.93 0.35
2 5 P.M. 15 42.9 50.40 4.37 0.10 4.08 0.20
2 20 P.M. 15 55.5 50.40 4.39 0.08 4.10 0.18
2 35 P.M. 15 68.3 51.20 4.45 0.02 4.15 0.13
2 50 P.M. 15 80.4 48.40 4.45 0.02 4.15 0.13
2 3 20 P.M. 30 105.5 50.20 4.49 -0.02 4.20 0.08
2
0
2 3 50 P.M. 30 130.5 50.00 4.49 -0.02 4.20 0.08
4/
2/
4 20 P.M. 30 155.5 50.00 4.49 -0.02 4.20 0.08
2
4 50 P.M. 30 176.0 41.00 4.49 -0.02 4.20 0.08
5 20 P.M. 30 206.0 60.00 4.49 -0.02 4.20 0.08
5 50 P.M. 30 231.0 50.00 4.49 -0.02 4.20 0.08
6 50 P.M. 60 280.0 49.00 4.49 -0.02 4.20 0.08
7 50 P.M. 60 330.0 50.00 4.49 -0.02 4.20 0.08
Average
50.05
Discharge
Final Drawdown (m) 0.15 0.15 0.27 0.27
page 1 of 4Tower T01
Alamein Downtown Towers
Record of Pumping Test
Well Bottom Level at (-23.5)
Target Discharge 50
Reading Time Pz-S1 Pz-D1 Pz-S2 Pz-D2
New Shallow New Deep New Shallow New Deep
Time Dist. = 4.70 m Dist. = 6.01 m Dist. = 10.06 m Dist. = 10.69 m
Date Incr.
am / Top Top Top Top
hr min (min) 4.06 4.11 3.97 3.86
pm Level Level Level Level
Depth Depth Depth Depth
Level Level Level Level
(m) (m) (m) (m)
1 50 P.M. 3.68 0.38 3.74 0.37 3.62 0.35 3.49 0.37
2 5 P.M. 15 3.75 0.31 3.79 0.32 3.70 0.27 3.52 0.34
2 20 P.M. 15 3.76 0.30 3.79 0.32 3.70 0.27 3.52 0.34
2 35 P.M. 15 3.77 0.29 3.80 0.31 3.71 0.26 3.54 0.32
2 50 P.M. 15 3.78 0.28 3.80 0.31 3.71 0.26 3.54 0.32
2 3 20 P.M. 30 3.78 0.28 3.81 0.30 3.75 0.22 3.55 0.31
2
0
2 3 50 P.M. 30 3.78 0.28 3.81 0.30 3.75 0.22 3.55 0.31
4/
2/
4 20 P.M. 30 3.78 0.28 3.81 0.30 3.75 0.22 3.55 0.31
2
4 50 P.M. 30 3.78 0.28 3.81 0.30 3.75 0.22 3.55 0.31
5 20 P.M. 30 3.78 0.28 3.81 0.30 3.75 0.22 3.55 0.31
5 50 P.M. 30 3.78 0.28 3.81 0.30 3.75 0.22 3.55 0.31
6 50 P.M. 60 3.78 0.28 3.81 0.30 3.75 0.22 3.55 0.31
7 50 P.M. 60 3.78 0.28 3.81 0.30 3.75 0.22 3.55 0.31
Final Drawdown (m) 0.10 0.10 0.07 0.07 0.13 0.13 0.06 0.06
page 2 of 4Tower T01
Alamein Downtown Towers
Record of Pumping Test
Well Bottom Level at (-23.5)
Target Discharge 50
Reading Time Pz-S3 Pz-D3 Pz-S4 Pz-D4
New Shallow New Deep New Shallow New Deep
Time Dist. = 20.0 m Dist. = 20.88 m Dist. = 40.26 m Dist. = 39.48 m
Date Incr.
am / Top Top Top Top
hr min (min) 4.30 4.31 4.50 4.37
pm Level Level Level Level
Depth Depth Depth Depth
Level Level Level Level
(m) (m) (m) (m)
1 50 P.M. 4.30 0.00 3.97 0.34 4.13 0.37 4.15 0.22
2 5 P.M. 15 4.33 -0.03 3.97 0.34 4.15 0.35 4.15 0.22
2 20 P.M. 15 4.37 -0.07 3.97 0.34 4.16 0.34 4.15 0.22
2 35 P.M. 15 4.37 -0.07 3.98 0.33 4.16 0.34 4.15 0.22
2 50 P.M. 15 4.37 -0.07 3.98 0.33 4.16 0.34 4.15 0.22
2 3 20 P.M. 30 4.37 -0.07 3.98 0.33 4.17 0.33 4.16 0.21
2
0
2 3 50 P.M. 30 4.37 -0.07 3.98 0.33 4.17 0.33 4.16 0.21
4/
2/
4 20 P.M. 30 4.37 -0.07 3.98 0.33 4.17 0.33 4.16 0.21
2
4 50 P.M. 30 4.37 -0.07 3.98 0.33 4.17 0.33 4.16 0.21
5 20 P.M. 30 4.37 -0.07 3.98 0.33 4.17 0.33 4.16 0.21
5 50 P.M. 30 4.37 -0.07 3.98 0.33 4.17 0.33 4.16 0.21
6 50 P.M. 60 4.37 -0.07 3.98 0.33 4.17 0.33 4.16 0.21
7 50 P.M. 60 4.37 -0.07 3.98 0.33 4.17 0.33 4.16 0.21
Final Drawdown (m) 0.07 0.07 0.01 0.01 0.04 0.04 0.01 0.01
page 3 of 4Tower T01
Alamein Downtown Towers
Record of Pumping Test
Well Bottom Level at (-23.5)
Target Discharge 50
Reading Time Pz-S5 Pz-D5 Pz-OS2 Pz-OD5
New Shallow New Deep Old Shallow Old Deep
Time Dist. = 70.6 m Dist. = 70.41 m Dist. = 8.19 m Dist. = 20.57 m
Date Incr.
am / Top Top Top Top
hr min (min) 4.09 3.90 3.34 4.47
pm Level Level Level Level
Depth Depth Depth Depth
Level Level Level Level
(m) (m) (m) (m)
1 50 P.M. 3.76 0.33 3.54 0.36 3.01 0.33 4.11 0.36
2 5 P.M. 15 3.77 0.32 3.59 0.31 3.08 0.26 4.15 0.32
2 20 P.M. 15 3.78 0.31 3.59 0.31 3.08 0.26 4.15 0.32
2 35 P.M. 15 3.78 0.31 3.59 0.31 3.08 0.26 4.15 0.32
2 50 P.M. 15 3.78 0.31 3.59 0.31 3.10 0.24 4.17 0.30
2 3 20 P.M. 30 3.78 0.31 3.59 0.31 3.10 0.24 4.17 0.30
2
0
2 3 50 P.M. 30 3.78 0.31 3.59 0.31 3.10 0.24 4.17 0.30
4/
2/
4 20 P.M. 30 3.78 0.31 3.59 0.31 3.10 0.24 4.17 0.30
2
4 50 P.M. 30 3.78 0.31 3.59 0.31 3.10 0.24 4.17 0.30
5 20 P.M. 30 3.78 0.31 3.59 0.31 3.10 0.24 4.17 0.30
5 50 P.M. 30 3.78 0.31 3.59 0.31 3.10 0.24 4.17 0.30
6 50 P.M. 60 3.78 0.31 3.59 0.31 3.10 0.24 4.17 0.30
7 50 P.M. 60 3.78 0.31 3.59 0.31 3.10 0.24 4.17 0.30
Final Drawdown (m) 0.02 0.02 0.05 0.05 0.09 0.09 0.06 0.06
page 4 of 4Tower T01
Alamein Downtown Towers
Record of Pumping Test
Well Bottom Level at (-23.5)
Target Discharge 100 m3/hour
Reading Time Pz-W-I Pz-W-F
Inside Well Well Filter
Flow
Time
Meter Discharge
Date Incr.
hr min
am /
(min)
Reading (m3/hr) Top
4.47
Top
4.28
pm (m3) Level Level
Depth Depth
Level Level
(m) (m)
8 20 A.M. 333.0 4.21 0.26 3.92 0.36
8 35 A.M. 15 358.0 100.00 4.92 -0.45 4.65 -0.37
8 50 A.M. 15 385.0 108.00 4.99 -0.52 4.71 -0.43
9 5 A.M. 15 408.0 92.00 5.01 -0.54 4.72 -0.44
9 20 A.M. 15 433.0 100.00 5.01 -0.54 4.73 -0.45
2 9 50 A.M. 30 485.0 104.00 5.01 -0.54 4.73 -0.45
2
0
2 10 20 A.M. 30 538.0 106.00 5.01 -0.54 4.73 -0.45
4/
3/
10 50 A.M. 30 590.0 104.00 5.01 -0.54 4.73 -0.45
2
11 20 A.M. 30 641.0 102.00 4.93 -0.46 4.66 -0.38
11 50 A.M. 30 692.0 102.00 4.93 -0.46 4.66 -0.38
12 20 P.M. 30 743.0 102.00 4.93 -0.46 4.66 -0.38
1 20 P.M. 60 843.0 100.00 4.93 -0.46 4.66 -0.38
2 20 P.M. 60 943.0 100.00 4.93 -0.46 4.66 -0.38
Average
101.67
Discharge
Final Drawdown (m) 0.72 0.72 0.74 0.74
page 1 of 5Tower T01
Alamein Downtown Towers
Record of Pumping Test
Well Bottom Level at (-23.5)
Target Discharge 100
Reading Time Pz-S1 Pz-D1 Pz-S2 Pz-D2
New Shallow New Deep New Shallow New Deep
Time Dist. = 4.70 m Dist. = 6.01 m Dist. = 10.06 m Dist. = 10.69 m
Date Incr.
am / Top Top Top Top
hr min (min) 4.06 4.11 3.97 3.86
pm Level Level Level Level
Depth Depth Depth Depth
Level Level Level Level
(m) (m) (m) (m)
8 20 A.M. 3.67 0.39 3.73 0.38 3.62 0.35 3.47 0.39
8 35 A.M. 15 3.88 0.18 3.77 0.34 3.82 0.15 3.61 0.25
8 50 A.M. 15 3.92 0.14 3.91 0.20 3.88 0.09 3.64 0.22
9 5 A.M. 15 3.94 0.12 3.92 0.19 3.88 0.09 3.66 0.20
9 20 A.M. 15 3.95 0.11 3.92 0.19 3.88 0.09 3.66 0.20
2 9 50 A.M. 30 3.95 0.11 3.93 0.18 3.89 0.08 3.67 0.19
2
0
2 10 20 A.M. 30 3.95 0.11 3.93 0.18 3.89 0.08 3.67 0.19
4/
3/
10 50 A.M. 30 3.95 0.11 3.93 0.18 3.89 0.08 3.67 0.19
2
11 20 A.M. 30 3.95 0.11 3.93 0.18 3.89 0.08 3.67 0.19
11 50 A.M. 30 3.95 0.11 3.93 0.18 3.89 0.08 3.67 0.19
12 20 P.M. 30 3.95 0.11 3.93 0.18 3.89 0.08 3.67 0.19
1 20 P.M. 60 3.95 0.11 3.93 0.18 3.89 0.08 3.67 0.19
2 20 P.M. 60 3.95 0.11 3.93 0.18 3.89 0.08 3.67 0.19
Final Drawdown (m) 0.28 0.28 0.20 0.20 0.27 0.27 0.20 0.20
page 2 of 5Tower T01
Alamein Downtown Towers
Record of Pumping Test
Well Bottom Level at (-23.5)
Target Discharge 100
Reading Time Pz-S3 Pz-D3 Pz-S4 Pz-D4
New Shallow New Deep New Shallow New Deep
Time Dist. = 20.0 m Dist. = 20.88 m Dist. = 40.26 m Dist. = 39.48 m
Date Incr.
am / Top Top Top Top
hr min (min) 4.30 4.31 4.50 4.37
pm Level Level Level Level
Depth Depth Depth Depth
Level Level Level Level
(m) (m) (m) (m)
8 20 A.M. 4.33 -0.03 3.96 0.35 4.13 0.37 4.13 0.24
8 35 A.M. 15 4.42 -0.12 3.98 0.33 4.17 0.33 4.14 0.23
8 50 A.M. 15 4.43 -0.13 3.98 0.33 4.18 0.32 4.15 0.22
9 5 A.M. 15 4.43 -0.13 3.98 0.33 4.21 0.29 4.15 0.22
9 20 A.M. 15 4.43 -0.13 3.98 0.33 4.22 0.28 4.15 0.22
2 9 50 A.M. 30 4.43 -0.13 3.98 0.33 4.22 0.28 4.15 0.22
2
0
2 10 20 A.M. 30 4.43 -0.13 3.98 0.33 4.23 0.27 4.15 0.22
4/
3/
10 50 A.M. 30 4.43 -0.13 3.99 0.32 4.23 0.27 4.15 0.22
2
11 20 A.M. 30 4.43 -0.13 4.02 0.29 4.23 0.27 4.15 0.22
11 50 A.M. 30 4.43 -0.13 4.02 0.29 4.23 0.27 4.15 0.22
12 20 P.M. 30 4.43 -0.13 4.02 0.29 4.23 0.27 4.15 0.22
1 20 P.M. 60 4.43 -0.13 4.02 0.29 4.23 0.27 4.15 0.22
2 20 P.M. 60 4.43 -0.13 4.02 0.29 4.23 0.27 4.15 0.22
Final Drawdown (m) 0.10 0.10 0.06 0.06 0.10 0.10 0.02 0.02
page 3 of 5Tower T01
Alamein Downtown Towers
Record of Pumping Test
Well Bottom Level at (-23.5)
Target Discharge 100
Reading Time Pz-S5 Pz-D5 Pz-OS2 Pz-OD5
New Shallow New Deep Old Shallow Old Deep
Time Dist. = 70.6 m Dist. = 70.41 m Dist. = 8.19 m Dist. = 20.57 m
Date Incr.
am / Top Top Top Top
hr min (min) 3.90 4.09 3.34 4.47
pm Level Level Level Level
Depth Depth Depth Depth
Level Level Level Level
(m) (m) (m) (m)
8 20 A.M. 3.75 0.15 3.57 0.52 2.98 0.36 4.10 0.37
8 35 A.M. 15 3.79 0.11 3.57 0.52 3.20 0.14 4.20 0.27
8 50 A.M. 15 3.80 0.10 3.58 0.51 3.23 0.11 4.23 0.24
9 5 A.M. 15 3.81 0.09 3.58 0.51 3.25 0.09 4.25 0.22
9 20 A.M. 15 3.81 0.09 3.58 0.51 3.26 0.08 4.25 0.22
2 9 50 A.M. 30 3.81 0.09 3.58 0.51 3.27 0.07 4.25 0.22
2
0
2 10 20 A.M. 30 3.82 0.08 3.58 0.51 3.27 0.07 4.25 0.22
4/
3/
10 50 A.M. 30 3.82 0.08 3.58 0.51 3.27 0.07 4.25 0.22
2
11 20 A.M. 30 3.82 0.08 3.58 0.51 3.27 0.07 4.25 0.22
11 50 A.M. 30 3.82 0.08 3.58 0.51 3.27 0.07 4.25 0.22
12 20 P.M. 30 3.82 0.08 3.58 0.51 3.27 0.07 4.25 0.22
1 20 P.M. 60 3.82 0.08 3.58 0.51 3.27 0.07 4.25 0.22
2 20 P.M. 60 3.82 0.08 3.58 0.51 3.27 0.07 4.25 0.22
Final Drawdown (m) 0.07 0.07 0.01 0.01 0.29 0.29 0.15 0.15
page 4 of 5Tower T01
Alamein Downtown Towers
Record of Pumping Test
Well Bottom Level at (-23.5)
Target Discharge 100
Reading Time Old W2 Old W1
Old Test Well Old adj. Well
Time Dist. = 5.50 m Dist. = 6.60 m
Date Incr.
am / Top Top
hr min (min) 3.39 3.25
pm Level Level
Depth Depth
Level Level
(m) (m)
8 20 A.M. 2.88 0.51 2.82 0.43
8 35 A.M. 15 3.00 0.39 3.05 0.20
8 50 A.M. 15 3.06 0.33 3.10 0.15
9 5 A.M. 15 3.08 0.31 3.10 0.15
9 20 A.M. 15 3.08 0.31 3.13 0.12
2 9 50 A.M. 30 3.08 0.31 3.14 0.11
2
0
2 10 20 A.M. 30 3.08 0.31 3.14 0.11
4/
3/
10 50 A.M. 30 3.08 0.31 3.14 0.11
2
11 20 A.M. 30 3.08 0.31 3.14 0.11
11 50 A.M. 30 3.08 0.31 3.14 0.11
12 20 P.M. 30 3.08 0.31 3.14 0.11
1 20 P.M. 60 3.08 0.31 3.14 0.11
2 20 P.M. 60 3.08 0.31 3.14 0.11
Final Drawdown (m) 0.20 0.20 0.32 0.32
page 5 of 5Tower T01
Alamein Downtown Towers
Record of Pumping Test
Well Bottom Level at (-23.5)
Target Discharge 150 m3/hour
Reading Time Pz-W-I Pz-W-F
Inside Well Well Filter
Flow
Time
Meter Discharge
Date Incr.
hr min
am /
(min)
Reading (m3/hr) Top
4.47
Top
4.28
pm (m3) Level Level
Depth Depth
Level Level
(m) (m)
9 23 A.M. 930.0 4.17 0.30 3.92 0.36
9 38 A.M. 15 961.0 124.00 5.02 -0.55 4.77 -0.49
9 53 A.M. 15 992.0 124.00 5.26 -0.79 5.02 -0.74
10 8 A.M. 15 1024.0 128.00 5.34 -0.87 5.10 -0.82
10 23 A.M. 15 1055.0 124.00 5.39 -0.92 5.12 -0.84
2 10 53 A.M. 30 1115.0 120.00 5.42 -0.95 5.17 -0.89
2
0
2 11 23 A.M. 30 1178.0 126.00 5.42 -0.95 5.17 -0.89
4/
4/
11 53 A.M. 30 1235.0 114.00 5.42 -0.95 5.17 -0.89
2
12 23 A.M. 30 1296.0 122.00 5.43 -0.96 5.17 -0.89
12 53 A.M. 30 1359.0 126.00 5.44 -0.97 5.20 -0.92
1 23 P.M. 30 1413.0 108.00 5.47 -1.00 5.20 -0.92
2 23 P.M. 60 1540.0 127.00 5.47 -1.00 5.20 -0.92
3 23 P.M. 60 1663.0 123.00 5.47 -1.00 5.20 -0.92
Average
122.17
Discharge
Final Drawdown (m) 1.30 1.30 1.28 1.28
page 1 of 5Tower T01
Alamein Downtown Towers
Record of Pumping Test
Well Bottom Level at (-23.5)
Target Discharge 150
Reading Time Pz-S1 Pz-D1 Pz-S2 Pz-D2
New Shallow New Deep New Shallow New Deep
Time Dist. = 4.70 m Dist. = 6.01 m Dist. = 10.06 m Dist. = 10.69 m
Date Incr.
am / Top Top Top Top
hr min (min) 4.06 4.11 3.97 3.86
pm Level Level Level Level
Depth Depth Depth Depth
Level Level Level Level
(m) (m) (m) (m)
9 23 A.M. 3.67 0.39 3.74 0.37 3.63 0.34 3.48 0.38
9 38 A.M. 15 3.95 0.11 3.90 0.21 3.85 0.12 3.60 0.26
9 53 A.M. 15 3.98 0.08 3.95 0.16 3.90 0.07 3.66 0.20
10 8 A.M. 15 4.00 0.06 3.97 0.14 3.93 0.04 3.69 0.17
10 23 A.M. 15 4.02 0.04 3.98 0.13 3.95 0.02 3.70 0.16
2 10 53 A.M. 30 4.05 0.01 3.99 0.12 3.97 0.00 3.72 0.14
2
0
2 11 23 A.M. 30 4.05 0.01 3.99 0.12 3.98 -0.01 3.74 0.12
4/
4/
11 53 A.M. 30 4.06 0.00 4.00 0.11 4.00 -0.03 3.75 0.11
2
12 23 A.M. 30 4.07 -0.01 4.01 0.10 4.01 -0.04 3.75 0.11
12 53 A.M. 30 4.07 -0.01 4.01 0.10 4.01 -0.04 3.76 0.10
1 23 P.M. 30 4.08 -0.02 4.01 0.10 4.01 -0.04 3.76 0.10
2 23 P.M. 60 4.08 -0.02 4.01 0.10 4.01 -0.04 3.76 0.10
3 23 P.M. 60 4.08 -0.02 4.01 0.10 4.01 -0.04 3.76 0.10
Final Drawdown (m) 0.41 0.41 0.27 0.27 0.38 0.38 0.28 0.28
page 2 of 5Tower T01
Alamein Downtown Towers
Record of Pumping Test
Well Bottom Level at (-23.5)
Target Discharge 150
Reading Time Pz-S3 Pz-D3 Pz-S4 Pz-D4
New Shallow New Deep New Shallow New Deep
Time Dist. = 20.0 m Dist. = 20.88 m Dist. = 40.26 m Dist. = 39.48 m
Date Incr.
am / Top Top Top Top
hr min (min) 4.30 4.31 4.50 4.37
pm Level Level Level Level
Depth Depth Depth Depth
Level Level Level Level
(m) (m) (m) (m)
9 23 A.M. 4.27 0.03 3.99 0.32 4.13 0.37 4.13 0.24
9 38 A.M. 15 4.38 -0.08 3.99 0.32 4.16 0.34 4.13 0.24
9 53 A.M. 15 4.43 -0.13 3.99 0.32 4.19 0.31 4.13 0.24
10 8 A.M. 15 4.44 -0.14 3.99 0.32 4.22 0.28 4.13 0.24
10 23 A.M. 15 4.45 -0.15 3.99 0.32 4.23 0.27 4.13 0.24
2 10 53 A.M. 30 4.45 -0.15 4.00 0.31 4.24 0.26 4.13 0.24
2
0
2 11 23 A.M. 30 4.47 -0.17 4.00 0.31 4.25 0.25 4.13 0.24
4/
4/
11 53 A.M. 30 4.49 -0.19 4.00 0.31 4.26 0.24 4.14 0.23
2
12 23 A.M. 30 4.50 -0.20 4.00 0.31 4.27 0.23 4.14 0.23
12 53 A.M. 30 4.50 -0.20 4.00 0.31 4.27 0.23 4.14 0.23
1 23 P.M. 30 4.50 -0.20 4.00 0.31 4.27 0.23 4.14 0.23
2 23 P.M. 60 4.50 -0.20 4.00 0.31 4.27 0.23 4.14 0.23
3 23 P.M. 60 4.50 -0.20 4.00 0.31 4.27 0.23 4.14 0.23
Final Drawdown (m) 0.23 0.23 0.01 0.01 0.14 0.14 0.01 0.01
page 3 of 5Tower T01
Alamein Downtown Towers
Record of Pumping Test
Well Bottom Level at (-23.5)
Target Discharge 150
Reading Time Pz-S5 Pz-D5 Pz-OS2 Pz-OD5
New Shallow New Deep Old Shallow Old Deep
Time Dist. = 70.6 m Dist. = 70.41 m Dist. = 8.19 m Dist. = 20.57 m
Date Incr.
am / Top Top Top Top
hr min (min) 3.90 4.09 3.34 4.47
pm Level Level Level Level
Depth Depth Depth Depth
Level Level Level Level
(m) (m) (m) (m)
9 23 A.M. 3.76 0.14 3.57 0.52 3.00 0.34 4.11 0.36
9 38 A.M. 15 3.79 0.11 3.57 0.52 3.22 0.12 4.23 0.24
9 53 A.M. 15 3.81 0.09 3.58 0.51 3.27 0.07 4.25 0.22
10 8 A.M. 15 3.81 0.09 3.57 0.52 3.32 0.02 4.28 0.19
10 23 A.M. 15 3.82 0.08 3.58 0.51 3.34 0.00 4.29 0.18
2 10 53 A.M. 30 3.83 0.07 3.58 0.51 3.36 -0.02 4.30 0.17
2
0
2 11 23 A.M. 30 3.83 0.07 3.58 0.51 3.36 -0.02 4.31 0.16
4/
4/
11 53 A.M. 30 3.84 0.06 3.58 0.51 3.37 -0.03 4.32 0.15
2
12 23 A.M. 30 3.85 0.05 3.58 0.51 3.38 -0.04 4.32 0.15
12 53 A.M. 30 3.85 0.05 3.59 0.50 3.38 -0.04 4.32 0.15
1 23 P.M. 30 3.85 0.05 3.59 0.50 3.38 -0.04 4.32 0.15
2 23 P.M. 60 3.85 0.05 3.59 0.50 3.38 -0.04 4.32 0.15
3 23 P.M. 60 3.85 0.05 3.59 0.50 3.38 -0.04 4.32 0.15
Final Drawdown (m) 0.09 0.09 0.02 0.02 0.38 0.38 0.21 0.21
page 4 of 5Tower T01
Alamein Downtown Towers
Record of Pumping Test
Well Bottom Level at (-23.5)
Target Discharge 150
Reading Time Old W2 Old W1
Old Test Well Old adj. Well
Time Dist. = 5.50 m Dist. = 6.60 m
Date Incr.
am / Top Top
hr min (min) 3.39 3.25
pm Level Level
Depth Depth
Level Level
(m) (m)
9 23 A.M. 2.86 0.53 2.82 0.43
9 38 A.M. 15 3.10 0.29 3.05 0.20
9 53 A.M. 15 3.16 0.23 3.12 0.13
10 8 A.M. 15 3.18 0.21 3.15 0.10
10 23 A.M. 15 3.22 0.17 3.17 0.08
2 10 53 A.M. 30 3.25 0.14 3.21 0.04
2
0
2 11 23 A.M. 30 3.25 0.14 3.21 0.04
4/
4/
11 53 A.M. 30 3.26 0.13 3.21 0.04
2
12 23 A.M. 30 3.26 0.13 3.21 0.04
12 53 A.M. 30 3.27 0.12 3.22 0.03
1 23 P.M. 30 3.27 0.12 3.22 0.03
2 23 P.M. 60 3.27 0.12 3.22 0.03
3 23 P.M. 60 3.27 0.12 3.22 0.03
Final Drawdown (m) 0.41 0.41 0.40 0.40
page 5 of 5The Iconic Tower (T01)
AL-Alamain Downtown Towers, New Alamain City, Egypt
Report on Analysis of Field Pumping Test and
Dewatering System Recommendations
A.2 Tests with Short Well
ARDAMAN-ACETower T01
Alamein Downtown Towers
Record of Pumping Test
Well Bottom Level at (-14.5)
Target Discharge 150 m3/hour
Reading Time Pz-W-I Pz-W-F
Inside Well Well Filter
Flow
Time
Meter Discharge
Date Incr.
hr min
am /
(min)
Reading (m3/hr) Top
4.38
Top
3.69
pm (m3) Level Level
Depth Depth
Level Level
(m) (m)
1 50 P.M. 1960.0 4.05 0.33 3.62 0.07
2 5 P.M. 15 1990.5 122.00 7.59 -3.21 6.96 -3.27
2 20 P.M. 15 2025.3 139.20 7.74 -3.36 7.10 -3.41
2
2 2 35 P.M. 15 2052.6 109.20 7.75 -3.37 7.11 -3.42
0
2
5/ 2 50 P.M. 15 2083.1 122.00 7.78 -3.40 7.15 -3.46
8/
3 10 P.M. 30 2125.0 83.80 7.78 -3.40 7.15 -3.46
3 40 P.M. 30 2181.8 113.60 7.78 -3.40 7.15 -3.46
4 10 P.M. 30 2241.0 118.40 7.78 -3.40 7.15 -3.46
Average
115.46
Discharge
Final Drawdown (m) 3.73 3.73 3.53 3.53
page 1 of 4Tower T01
Alamein Downtown Towers
Record of Pumping Test
Well Bottom Level at (-14.5)
Target Discharge 150
Reading Time Pz-S1 Pz-D1 Pz-S2 Pz-D2
New Shallow New Deep New Shallow New Deep
Time Dist. = 4.79 m Dist. = 4.89 m Dist. = 9.70 m Dist. = 9.73 m
Date Incr.
am / Top Top Top Top
hr min (min) 4.02 4.12 3.39 3.86
pm Level Level Level Level
Depth Depth Depth Depth
Level Level Level Level
(m) (m) (m) (m)
1 50 P.M. 3.67 0.35 3.75 0.37 3.05 0.34 3.47 0.39
2 5 P.M. 15 3.97 0.05 4.32 -0.20 3.30 0.09 3.75 0.11
2 20 P.M. 15 4.00 0.02 4.36 -0.24 3.33 0.06 3.80 0.06
2
2 2 35 P.M. 15 4.02 0.00 4.37 -0.25 3.34 0.05 3.82 0.04
0
2
5/ 2 50 P.M. 15 4.03 -0.01 4.38 -0.26 3.35 0.04 3.84 0.02
8/
3 10 P.M. 30 4.05 -0.03 4.41 -0.29 3.37 0.02 3.85 0.01
3 40 P.M. 30 4.05 -0.03 4.42 -0.30 3.37 0.02 3.85 0.01
4 10 P.M. 30 4.05 -0.03 4.42 -0.30 3.37 0.02 3.85 0.01
Final Drawdown (m) 0.38 0.38 0.67 0.67 0.32 0.32 0.38 0.38
page 2 of 4Tower T01
Alamein Downtown Towers
Record of Pumping Test
Well Bottom Level at (-14.5)
Target Discharge 150
Reading Time Pz-S3 Pz-D3 Pz-S4 Pz-D4
New Shallow New Deep New Shallow New Deep
Time Dist. = 19.43 m Dist. = 20.01 m Dist. = 39.58 m Dist. = 38.65 m
Date Incr.
am / Top Top Top Top
hr min (min) 4.30 4.30 4.50 4.38
pm Level Level Level Level
Depth Depth Depth Depth
Level Level Level Level
(m) (m) (m) (m)
1 50 P.M. 4.25 0.05 3.96 0.34 4.14 0.36 4.04 0.34
2 5 P.M. 15 4.41 -0.11 4.09 0.21 4.20 0.30 4.13 0.25
2 20 P.M. 15 4.42 -0.12 4.11 0.19 4.22 0.28 4.16 0.22
2
2 2 35 P.M. 15 4.42 -0.12 4.12 0.18 4.23 0.27 4.18 0.20
0
2
5/ 2 50 P.M. 15 4.43 -0.13 4.13 0.17 4.24 0.26 4.18 0.20
8/
3 10 P.M. 30 4.45 -0.15 4.15 0.15 4.25 0.25 4.18 0.20
3 40 P.M. 30 4.45 -0.15 4.16 0.14 4.26 0.24 4.18 0.20
4 10 P.M. 30 4.45 -0.15 4.16 0.14 4.26 0.24 4.18 0.20
Final Drawdown (m) 0.20 0.20 0.20 0.20 0.12 0.12 0.14 0.14
page 3 of 4Tower T01
Alamein Downtown Towers
Record of Pumping Test
Well Bottom Level at (-14.5)
Target Discharge 150
Reading Time Pz-S5 Pz-D5
New Shallow New Deep
Time Dist. = 69.88 m Dist. = 69.60 m
Date Incr.
am / Top Top
hr min (min) 4.08 3.90
pm Level Level
Depth Depth
Level Level
(m) (m)
1 50 P.M. 3.76 0.32 3.53 0.37
2 5 P.M. 15 3.80 0.28 3.53 0.37
2 20 P.M. 15 3.81 0.27 3.53 0.37
2
2 2 35 P.M. 15 3.81 0.27 3.54 0.36
0
2
5/ 2 50 P.M. 15 3.82 0.26 3.54 0.36
8/
3 10 P.M. 30 3.83 0.25 3.54 0.36
3 40 P.M. 30 3.83 0.25 3.54 0.36
4 10 P.M. 30 3.83 0.25 3.54 0.36
Final Drawdown (m) 0.07 0.07 0.01 0.01
page 4 of 4Tower T01
Alamein Downtown Towers
Record of Pumping Test
Well Bottom Level at (-14.5)
Target Discharge 150 m3/hour
Reading Time Pz-W-I Pz-W-F
Inside Well Well Filter
Flow
Time
Meter Discharge
Date Incr.
hr min
am /
(min)
Reading (m3/hr) Top
4.38
Top
3.69
pm (m3) Level Level
Depth Depth
Level Level
(m) (m)
11 0 A.M. 2720.0 4.05 0.33 3.38 0.31
11 15 A.M. 15 2752.0 128.00 6.27 -1.89 5.77 -2.08
11 30 A.M. 15 2784.0 128.00 6.43 -2.05 5.91 -2.22
11 45 A.M. 15 2816.0 128.00 6.54 -2.16 6.02 -2.33
12 0 P.M. 15 2848.0 128.00 6.60 -2.22 6.09 -2.40
12 30 P.M. 30 2912.0 128.00 6.76 -2.38 6.21 -2.52
2
2
0 1 0 P.M. 30 2976.0 128.00 6.82 -2.44 6.30 -2.61
2
5/
1 30 P.M. 30 3040.0 128.00 6.90 -2.52 6.33 -2.64
0/
1 2 0 P.M. 30 3140.0 200.00 6.94 -2.56 6.38 -2.69
2 30 P.M. 30 3168.0 56.00 6.95 -2.57 6.42 -2.73
3 0 P.M. 30 3232.0 128.00 6.99 -2.61 6.46 -2.77
4 0 P.M. 60 3370.0 138.00 6.99 -2.61 6.46 -2.77
5 0 P.M. 60 3498.0 128.00 6.99 -2.61 6.46 -2.77
6 0 P.M. 60 3625.0 127.00 6.99 -2.61 6.46 -2.77
Average
128.69
Discharge
Final Drawdown (m) 2.94 2.94 3.08 3.08
page 1 of 5Tower T01
Alamein Downtown Towers
Record of Pumping Test
Well Bottom Level at (-14.5)
Target Discharge 150
Reading Time Pz-S1 Pz-D1 Pz-S2 Pz-D2
New Shallow New Deep New Shallow New Deep
Time Dist. = 4.79 m Dist. = 4.89 m Dist. = 9.70 m Dist. = 9.73 m
Date Incr.
am / Top Top Top Top
hr min (min) 4.02 4.12 3.39 3.86
pm Level Level Level Level
Depth Depth Depth Depth
Level Level Level Level
(m) (m) (m) (m)
11 0 A.M. 3.67 0.35 3.75 0.37 3.05 0.34 3.47 0.39
11 15 A.M. 15 3.96 0.06 4.39 -0.27 3.31 0.08 3.81 0.05
11 30 A.M. 15 4.02 0.00 4.40 -0.28 3.34 0.05 3.86 0.00
11 45 A.M. 15 4.04 -0.02 4.43 -0.31 3.36 0.03 3.88 -0.02
12 0 P.M. 15 4.06 -0.04 4.45 -0.33 3.38 0.01 3.90 -0.04
12 30 P.M. 30 4.08 -0.06 4.48 -0.36 3.40 -0.01 3.92 -0.06
2
2
0 1 0 P.M. 30 4.10 -0.08 4.50 -0.38 3.42 -0.03 3.94 -0.08
2
5/
1 30 P.M. 30 4.10 -0.08 4.51 -0.39 3.42 -0.03 3.94 -0.08
0/
1 2 0 P.M. 30 4.11 -0.09 4.52 -0.40 3.43 -0.04 3.95 -0.09
2 30 P.M. 30 4.11 -0.09 4.53 -0.41 3.43 -0.04 3.96 -0.10
3 0 P.M. 30 4.12 -0.10 4.54 -0.42 3.43 -0.04 3.96 -0.10
4 0 P.M. 60 4.12 -0.10 4.54 -0.42 3.43 -0.04 3.96 -0.10
5 0 P.M. 60 4.12 -0.10 4.54 -0.42 3.43 -0.04 3.96 -0.10
6 0 P.M. 60 4.12 -0.10 4.54 -0.42 3.43 -0.04 3.96 -0.10
Final Drawdown (m) 0.45 0.45 0.79 0.79 0.38 0.38 0.49 0.49
page 2 of 5Tower T01
Alamein Downtown Towers
Record of Pumping Test
Well Bottom Level at (-14.5)
Target Discharge 150
Reading Time Pz-S3 Pz-D3 Pz-S4 Pz-D4
New Shallow New Deep New Shallow New Deep
Time Dist. = 19.43 m Dist. = 20.01 m Dist. = 39.58 m Dist. = 38.65 m
Date Incr.
am / Top Top Top Top
hr min (min) 4.30 4.30 4.50 4.38
pm Level Level Level Level
Depth Depth Depth Depth
Level Level Level Level
(m) (m) (m) (m)
11 0 A.M. 4.25 0.05 3.96 0.34 4.14 0.36 4.05 0.33
11 15 A.M. 15 4.39 -0.09 4.09 0.21 4.17 0.33 4.13 0.25
11 30 A.M. 15 4.40 -0.10 4.11 0.19 4.20 0.30 4.14 0.24
11 45 A.M. 15 4.42 -0.12 4.14 0.16 4.23 0.27 4.15 0.23
12 0 P.M. 15 4.44 -0.14 4.15 0.15 4.24 0.26 4.17 0.21
12 30 P.M. 30 4.45 -0.15 4.17 0.13 4.27 0.23 4.19 0.19
2
2
0 1 0 P.M. 30 4.46 -0.16 4.19 0.11 4.29 0.21 4.19 0.19
2
5/
1 30 P.M. 30 4.47 -0.17 4.19 0.11 4.29 0.21 4.20 0.18
0/
1 2 0 P.M. 30 4.47 -0.17 4.20 0.10 4.30 0.20 4.20 0.18
2 30 P.M. 30 4.47 -0.17 4.20 0.10 4.32 0.18 4.21 0.17
3 0 P.M. 30 4.48 -0.18 4.21 0.09 4.32 0.18 4.21 0.17
4 0 P.M. 60 4.48 -0.18 4.21 0.09 4.32 0.18 4.21 0.17
5 0 P.M. 60 4.48 -0.18 4.21 0.09 4.32 0.18 4.21 0.17
6 0 P.M. 60 4.48 -0.18 4.21 0.09 4.32 0.18 4.21 0.17
Final Drawdown (m) 0.23 0.23 0.25 0.25 0.18 0.18 0.16 0.16
page 3 of 5Tower T01
Alamein Downtown Towers
Record of Pumping Test
Well Bottom Level at (-14.5)
Target Discharge 150
Reading Time Pz-S5 Pz-D5 Pz-OS2 Pz-OD5
New Shallow New Deep Old Shallow Old Deep
Time Dist. = 69.88 m Dist. = 69.60 m Dist. = 6.17 m Dist. = 19.33 m
Date Incr.
am / Top Top Top Top
hr min (min) 4.08 3.90 3.34 4.47
pm Level Level Level Level
Depth Depth Depth Depth
Level Level Level Level
(m) (m) (m) (m)
11 0 A.M. 3.76 0.32 3.53 0.37 2.90 0.44 4.03 0.44
11 15 A.M. 15 3.80 0.28 3.54 0.36 3.20 0.14 4.08 0.39
11 30 A.M. 15 3.81 0.27 3.54 0.36 3.27 0.07 4.10 0.37
11 45 A.M. 15 3.82 0.26 3.54 0.36 3.30 0.04 4.13 0.34
12 0 P.M. 15 3.83 0.25 3.54 0.36 3.33 0.01 4.18 0.29
12 30 P.M. 30 3.84 0.24 3.54 0.36 3.36 -0.02 4.24 0.23
2
2
0 1 0 P.M. 30 3.85 0.23 3.54 0.36 3.38 -0.04 4.29 0.18
2
5/
1 30 P.M. 30 3.85 0.23 3.54 0.36 3.38 -0.04 4.35 0.12
0/
1 2 0 P.M. 30 3.86 0.22 3.54 0.36 3.39 -0.05 4.39 0.08
2 30 P.M. 30 3.86 0.22 3.54 0.36 3.40 -0.06 4.42 0.05
3 0 P.M. 30 3.86 0.22 3.54 0.36 3.41 -0.07 4.45 0.02
4 0 P.M. 60 3.86 0.22 3.54 0.36 3.41 -0.07 4.45 0.02
5 0 P.M. 60 3.86 0.22 3.54 0.36 3.41 -0.07 4.45 0.02
6 0 P.M. 60 3.86 0.22 3.54 0.36 3.41 -0.07 4.45 0.02
Final Drawdown (m) 0.10 0.10 0.01 0.01 0.51 0.51 0.42 0.42
page 4 of 5Tower T01
Alamein Downtown Towers
Record of Pumping Test
Well Bottom Level at (-14.5)
Target Discharge 150
Reading Time Old W2 Old W1
Old Test Well Old adj. Well
Time Dist. = 3.45 m Dist. = 4.57 m
Date Incr.
am / Top Top
hr min (min) 3.39 3.25
pm Level Level
Depth Depth
Level Level
(m) (m)
11 0 A.M. 3.04 0.35 4.26 -1.01
11 15 A.M. 15 3.35 0.04 4.53 -1.28
11 30 A.M. 15 3.38 0.01 4.55 -1.30
11 45 A.M. 15 3.39 0.00 4.57 -1.32
12 0 P.M. 15 3.42 -0.03 4.58 -1.33
12 30 P.M. 30 3.44 -0.05 4.60 -1.35
2
2
0 1 0 P.M. 30 3.46 -0.07 4.61 -1.36
2
5/
1 30 P.M. 30 3.48 -0.09 4.62 -1.37
0/
1 2 0 P.M. 30 3.48 -0.09 4.63 -1.38
2 30 P.M. 30 3.48 -0.09 4.63 -1.38
3 0 P.M. 30 3.48 -0.09 4.64 -1.39
4 0 P.M. 60 3.48 -0.09 4.64 -1.39
5 0 P.M. 60 3.48 -0.09 4.64 -1.39
6 0 P.M. 60 3.48 -0.09 4.64 -1.39
Final Drawdown (m) 0.44 0.44 0.38 0.38
page 5 of 5The Iconic Tower (T01)
AL-Alamain Downtown Towers, New Alamain City, Egypt
Report on Analysis of Field Pumping Test and
Dewatering System Recommendations
Appendix (B)
Calculations for Check of Drawdown
ARDAMAN-ACEThe Iconic Tower (T01)
AL-Alamain Downtown Towers, New Alamain City, Egypt
Report on Analysis of Field Pumping Test and
Dewatering System Recommendations
`
Location of Points for Checking Drawdown
ARDAMAN-ACETower T01 Calculation of Drawdwon Using Deep Wells ARDAMAN-ACE
Alamein Downtown Towers
Aquifer Case: Unconfined with Partial Penetration
Aquifer parameters:
Permeabilty, k (m/s) = 1600
Aquifer Thickness, H (m) = 30
Permeability (m/hour) 5.76
Radius of Influence, Ro (m) = 220
Static Water Elevation (m) = 0.40
Radius of Well, rw (m) 0.225
Length of Well below GWL (m) 14.90 15.10
Case: General - 22 Wells Operating
Check Point CP1
Identification Lower Raft
Coordinates
X Y
Well No. Discharge Coord. of Well Oper. 296173.89 877023.70
Dist.
H2-h2
H-h
m3/hour
X Y r (for FP) (for PP)
W1 100.00 296166.25 876997.90 Y 26.91 11.61 0.30
W2 100.00 296173.25 876998.08 Y 25.63 11.88 0.31
W3 100.00 296180.25 876998.26 Y 26.22 11.75 0.31
W4 100.00 296185.86 877000.38 Y 26.22 11.76 0.31
W5 100.00 296200.23 877007.25 Y 31.06 10.82 0.28
W6 100.00 296205.13 877015.97 Y 32.18 10.62 0.28
W7 100.00 296199.37 877024.60 Y 25.50 11.91 0.31
W8 100.00 296195.99 877030.27 Y 23.05 12.47 0.32
W9 100.00 296189.22 877041.60 Y 23.57 12.34 0.32
W10 100.00 296185.81 877047.31 Y 26.45 11.71 0.31
W11 100.00 296181.08 877056.74 Y 33.81 10.35 0.27
W12 100.00 296171.08 877056.62 Y 33.04 10.48 0.27
W13 100.00 296158.08 877046.90 Y 28.07 11.38 0.30
W14 100.00 296153.55 877042.96 Y 28.01 11.39 0.30
W15 100.00 296150.07 877036.89 Y 27.22 11.55 0.30
W16 100.00 296146.59 877030.81 Y 28.20 11.35 0.30
W17 100.00 296146.41 877022.03 Y 27.53 11.49 0.30
W18 100.00 296151.90 877018.95 Y 22.49 12.60 0.33
W19 100.00 296157.28 877007.80 Y 23.00 12.48 0.33
W20 100.00 296157.35 877001.50 Y 27.69 11.45 0.30
W21 0.00 296194.14 877060.52 Y 42.02 0.00 0.00
W22 0.00 296214.87 877025.82 Y 41.03 0.00 0.00
SW1 0.00 296189.27 877006.50 N 23.08 0.00 0.00
SW2 0.00 296192.60 877035.94 N 22.36 0.00 0.00
SW3 0.00 296165.08 877047.00 N 24.91 0.00 0.00
SW4 0.00 296155.65 877013.84 N 20.73 0.00 0.00
SW5 0.00 296188.46 877057.33 N 36.65 0.00 0.00
TW1 0.00 296176.62 877012.09 N 11.93 0.00 0.00
TW2 0.00 296184.35 877031.55 N 13.07 0.00 0.00
TW3 0.00 296163.97 877032.63 N 13.34 0.00 0.00
Sum 231.39
Drawd. 4.14 6.03
Elev. -3.74 -5.63
Page 1Tower T01 Calculation of Drawdwon Using Deep Wells ARDAMAN-ACE
Alamein Downtown Towers
Aquifer Case: Unconfined with Partial Penetration
Aquifer parameters:
Permeabilty, k (m/s) = 1600
Aquifer Thickness, H (m) = 30
Permeability (m/hour) 5.76
Radius of Influence, Ro (m) = 220
Static Water Elevation (m) = 0.40
Radius of Well, rw (m) 0.225
Length of Well below GWL (m) 14.90 15.10
Case: General - 22 Wells Operating
Check Point CP2
Identification Lower Raft
Coordinates
X Y
Well No. Discharge Coord. of Well Oper. 296161.89 877015.70
Dist.
H2-h2
H-h
m3/hour
X Y r (for FP) (for PP)
W1 100.00 296166.25 876997.90 Y 18.33 13.73 0.36
W2 100.00 296173.25 876998.08 Y 20.97 12.99 0.34
W3 100.00 296180.25 876998.26 Y 25.32 11.95 0.31
W4 100.00 296185.86 877000.38 Y 28.45 11.30 0.29
W5 100.00 296200.23 877007.25 Y 39.26 9.52 0.25
W6 100.00 296205.13 877015.97 Y 43.24 8.99 0.15
W7 100.00 296199.37 877024.60 Y 38.52 9.63 0.25
W8 100.00 296195.99 877030.27 Y 37.08 9.84 0.26
W9 100.00 296189.22 877041.60 Y 37.65 9.76 0.25
W10 100.00 296185.81 877047.31 Y 39.64 9.47 0.25
W11 100.00 296181.08 877056.74 Y 45.30 8.73 0.15
W12 100.00 296171.08 877056.62 Y 41.94 9.16 0.15
W13 100.00 296158.08 877046.90 Y 31.43 10.75 0.28
W14 100.00 296153.55 877042.96 Y 28.50 11.29 0.29
W15 100.00 296150.07 877036.89 Y 24.25 12.19 0.32
W16 100.00 296146.59 877030.81 Y 21.50 12.85 0.33
W17 100.00 296146.41 877022.03 Y 16.72 14.24 0.37
W18 100.00 296151.90 877018.95 Y 10.50 16.81 0.44
W19 100.00 296157.28 877007.80 Y 9.15 17.57 0.46
W20 100.00 296157.35 877001.50 Y 14.91 14.87 0.39
W21 0.00 296194.14 877060.52 Y 55.22 0.00 0.00
W22 0.00 296214.87 877025.82 Y 53.94 0.00 0.00
SW1 0.00 296189.27 877006.50 N 28.89 0.00 0.00
SW2 0.00 296192.60 877035.94 N 36.78 0.00 0.00
SW3 0.00 296165.08 877047.00 N 31.46 0.00 0.00
SW4 0.00 296155.65 877013.84 N 6.51 0.00 0.00
SW5 0.00 296188.46 877057.33 N 49.38 0.00 0.00
TW1 0.00 296176.62 877012.09 N 15.17 0.00 0.00
TW2 0.00 296184.35 877031.55 N 27.49 0.00 0.00
TW3 0.00 296163.97 877032.63 N 17.06 0.00 0.00
Sum 235.66
Drawd. 4.23 5.89
Elev. -3.83 -5.49
Page 2Tower T01 Calculation of Drawdwon Using Deep Wells ARDAMAN-ACE
Alamein Downtown Towers
Aquifer Case: Unconfined with Partial Penetration
Aquifer parameters:
Permeabilty, k (m/s) = 1600
Aquifer Thickness, H (m) = 30
Permeability (m/hour) 5.76
Radius of Influence, Ro (m) = 220
Static Water Elevation (m) = 0.40
Radius of Well, rw (m) 0.225
Length of Well below GWL (m) 14.90 15.10
Case: General - 22 Wells Operating
Check Point CP3
Identification Lower Raft
Coordinates
X Y
Well No. Discharge Coord. of Well Oper. 296189.89 877023.70
Dist.
H2-h2
H-h
m3/hour
X Y r (for FP) (for PP)
W1 100.00 296166.25 876997.90 Y 35.00 10.16 0.26
W2 100.00 296173.25 876998.08 Y 30.55 10.91 0.28
W3 100.00 296180.25 876998.26 Y 27.21 11.55 0.30
W4 100.00 296185.86 877000.38 Y 23.67 12.32 0.32
W5 100.00 296200.23 877007.25 Y 19.43 13.41 0.35
W6 100.00 296205.13 877015.97 Y 17.09 14.12 0.37
W7 100.00 296199.37 877024.60 Y 9.53 17.35 0.45
W8 100.00 296195.99 877030.27 Y 8.96 17.69 0.46
W9 100.00 296189.22 877041.60 Y 17.91 13.86 0.36
W10 100.00 296185.81 877047.31 Y 23.96 12.25 0.32
W11 100.00 296181.08 877056.74 Y 34.19 10.29 0.27
W12 100.00 296171.08 877056.62 Y 37.91 9.72 0.25
W13 100.00 296158.08 877046.90 Y 39.37 9.51 0.25
W14 100.00 296153.55 877042.96 Y 41.13 9.27 0.24
W15 100.00 296150.07 877036.89 Y 41.94 9.16 0.15
W16 100.00 296146.59 877030.81 Y 43.87 8.91 0.15
W17 100.00 296146.41 877022.03 Y 43.51 8.96 0.15
W18 100.00 296151.90 877018.95 Y 38.28 9.66 0.25
W19 100.00 296157.28 877007.80 Y 36.28 9.96 0.26
W20 100.00 296157.35 877001.50 Y 39.39 9.51 0.25
W21 0.00 296194.14 877060.52 Y 37.07 0.00 0.00
W22 0.00 296214.87 877025.82 Y 25.07 0.00 0.00
SW1 0.00 296189.27 877006.50 N 17.22 0.00 0.00
SW2 0.00 296192.60 877035.94 N 12.53 0.00 0.00
SW3 0.00 296165.08 877047.00 N 34.03 0.00 0.00
SW4 0.00 296155.65 877013.84 N 35.63 0.00 0.00
SW5 0.00 296188.46 877057.33 N 33.66 0.00 0.00
TW1 0.00 296176.62 877012.09 N 17.64 0.00 0.00
TW2 0.00 296184.35 877031.55 N 9.60 0.00 0.00
TW3 0.00 296163.97 877032.63 N 27.41 0.00 0.00
Sum 228.56
Drawd. 4.09 5.70
Elev. -3.69 -5.30
Page 3Tower T01 Calculation of Drawdwon Using Deep Wells ARDAMAN-ACE
Alamein Downtown Towers
Aquifer Case: Unconfined with Partial Penetration
Aquifer parameters:
Permeabilty, k (m/s) = 1600
Aquifer Thickness, H (m) = 30
Permeability (m/hour) 5.76
Radius of Influence, Ro (m) = 220
Static Water Elevation (m) = 0.40
Radius of Well, rw (m) 0.225
Length of Well below GWL (m) 14.90 15.10
Case: General - 22 Wells Operating
Check Point CP4
Identification Lower Raft
Coordinates
X Y
Well No. Discharge Coord. of Well Oper. 296173.89 877039.70
Dist.
H2-h2
H-h
m3/hour
X Y r (for FP) (for PP)
W1 100.00 296166.25 876997.90 Y 42.50 9.09 0.15
W2 100.00 296173.25 876998.08 Y 41.63 9.20 0.15
W3 100.00 296180.25 876998.26 Y 41.93 9.16 0.15
W4 100.00 296185.86 877000.38 Y 41.10 9.27 0.24
W5 100.00 296200.23 877007.25 Y 41.80 9.18 0.15
W6 100.00 296205.13 877015.97 Y 39.23 9.53 0.25
W7 100.00 296199.37 877024.60 Y 29.62 11.08 0.29
W8 100.00 296195.99 877030.27 Y 24.03 12.24 0.32
W9 100.00 296189.22 877041.60 Y 15.45 14.68 0.38
W10 100.00 296185.81 877047.31 Y 14.14 15.17 0.40
W11 100.00 296181.08 877056.74 Y 18.49 13.69 0.36
W12 100.00 296171.08 877056.62 Y 17.15 14.10 0.37
W13 100.00 296158.08 877046.90 Y 17.37 14.03 0.37
W14 100.00 296153.55 877042.96 Y 20.60 13.09 0.34
W15 100.00 296150.07 877036.89 Y 23.98 12.25 0.32
W16 100.00 296146.59 877030.81 Y 28.71 11.25 0.29
W17 100.00 296146.41 877022.03 Y 32.67 10.54 0.27
W18 100.00 296151.90 877018.95 Y 30.24 10.97 0.29
W19 100.00 296157.28 877007.80 Y 35.97 10.01 0.26
W20 100.00 296157.35 877001.50 Y 41.63 9.20 0.15
W21 0.00 296194.14 877060.52 Y 29.04 0.00 0.00
W22 0.00 296214.87 877025.82 Y 43.27 0.00 0.00
SW1 0.00 296189.27 877006.50 N 36.60 0.00 0.00
SW2 0.00 296192.60 877035.94 N 19.09 0.00 0.00
SW3 0.00 296165.08 877047.00 N 11.44 0.00 0.00
SW4 0.00 296155.65 877013.84 N 31.65 0.00 0.00
SW5 0.00 296188.46 877057.33 N 22.87 0.00 0.00
TW1 0.00 296176.62 877012.09 N 27.75 0.00 0.00
TW2 0.00 296184.35 877031.55 N 13.26 0.00 0.00
TW3 0.00 296163.97 877032.63 N 12.18 0.00 0.00
Sum 227.71
Drawd. 4.07 5.50
Elev. -3.67 -5.10
Page 4Tower T01 Calculation of Drawdwon Using Deep Wells ARDAMAN-ACE
Alamein Downtown Towers
Aquifer Case: Unconfined with Partial Penetration
Aquifer parameters:
Permeabilty, k (m/s) = 1600
Aquifer Thickness, H (m) = 30
Permeability (m/hour) 5.76
Radius of Influence, Ro (m) = 220
Static Water Elevation (m) = 0.40
Radius of Well, rw (m) 0.225
Length of Well below GWL (m) 14.90 15.10
Case: General - 22 Wells Operating
Check Point CPNP
Identification Edge of North Pit
Coordinates
X Y
Well No. Discharge Coord. of Well Oper. 296204.15 877043.76
Dist.
H2-h2
H-h
m3/hour
X Y r (for FP) (for PP)
W1 100.00 296166.25 876997.90 Y 59.50 7.23 0.12
W2 100.00 296173.25 876998.08 Y 55.15 7.65 0.13
W3 100.00 296180.25 876998.26 Y 51.40 8.04 0.13
W4 100.00 296185.86 877000.38 Y 47.08 8.52 0.14
W5 100.00 296200.23 877007.25 Y 36.72 9.89 0.26
W6 100.00 296205.13 877015.97 Y 27.81 11.43 0.30
W7 100.00 296199.37 877024.60 Y 19.75 13.32 0.35
W8 100.00 296195.99 877030.27 Y 15.77 14.56 0.38
W9 100.00 296189.22 877041.60 Y 15.09 14.81 0.39
W10 100.00 296185.81 877047.31 Y 18.68 13.63 0.36
W11 100.00 296181.08 877056.74 Y 26.47 11.70 0.30
W12 100.00 296171.08 877056.62 Y 35.48 10.08 0.26
W13 100.00 296158.08 877046.90 Y 46.18 8.63 0.14
W14 100.00 296153.55 877042.96 Y 50.61 8.12 0.14
W15 100.00 296150.07 877036.89 Y 54.51 7.71 0.13
W16 100.00 296146.59 877030.81 Y 59.00 7.27 0.12
W17 100.00 296146.41 877022.03 Y 61.69 7.03 0.12
W18 100.00 296151.90 877018.95 Y 57.84 7.38 0.12
W19 100.00 296157.28 877007.80 Y 59.08 7.27 0.12
W20 100.00 296157.35 877001.50 Y 63.06 6.91 0.12
W21 0.00 296194.14 877060.52 Y 19.52 0.00 0.00
W22 0.00 296214.87 877025.82 Y 20.90 0.00 0.00
SW1 0.00 296189.27 877006.50 N 40.13 0.00 0.00
SW2 0.00 296192.60 877035.94 N 13.95 0.00 0.00
SW3 0.00 296165.08 877047.00 N 39.20 0.00 0.00
SW4 0.00 296155.65 877013.84 N 56.99 0.00 0.00
SW5 0.00 296188.46 877057.33 N 20.75 0.00 0.00
TW1 0.00 296176.62 877012.09 N 41.97 0.00 0.00
TW2 0.00 296184.35 877031.55 N 23.27 0.00 0.00
TW3 0.00 296163.97 877032.63 N 41.69 0.00 0.00
Sum 191.17
Drawd. 3.38 4.12
Elev. -2.98 -3.72
Page 5Tower T01 Calculation of Drawdwon Using Deep Wells ARDAMAN-ACE
Alamein Downtown Towers
Aquifer Case: Unconfined with Partial Penetration
Aquifer parameters:
Permeabilty, k (m/s) = 1600
Aquifer Thickness, H (m) = 30
Permeability (m/hour) 5.76
Radius of Influence, Ro (m) = 220
Static Water Elevation (m) = 0.40
Radius of Well, rw (m) 0.225
Length of Well below GWL (m) 14.90 15.10
Case: General - 22 Wells Operating
Check Point CP5
Identification Upper Raft - 8m from Lower
Coordinates
X Y
Well No. Discharge Coord. of Well Oper. 296163.36 876992.82
Dist.
H2-h2
H-h
m3/hour
X Y r (for FP) (for PP)
W1 100.00 296166.25 876997.90 Y 5.84 20.05 0.52
W2 100.00 296173.25 876998.08 Y 11.20 16.45 0.43
W3 100.00 296180.25 876998.26 Y 17.74 13.91 0.36
W4 100.00 296185.86 877000.38 Y 23.74 12.30 0.32
W5 100.00 296200.23 877007.25 Y 39.60 9.48 0.25
W6 100.00 296205.13 877015.97 Y 47.76 8.44 0.14
W7 100.00 296199.37 877024.60 Y 48.03 8.41 0.14
W8 100.00 296195.99 877030.27 Y 49.67 8.22 0.14
W9 100.00 296189.22 877041.60 Y 55.21 7.64 0.13
W10 100.00 296185.81 877047.31 Y 58.93 7.28 0.12
W11 100.00 296181.08 877056.74 Y 66.33 6.63 0.11
W12 100.00 296171.08 877056.62 Y 64.27 6.80 0.11
W13 100.00 296158.08 877046.90 Y 54.33 7.73 0.13
W14 100.00 296153.55 877042.96 Y 51.09 8.07 0.13
W15 100.00 296150.07 877036.89 Y 46.02 8.65 0.14
W16 100.00 296146.59 877030.81 Y 41.52 9.21 0.15
W17 100.00 296146.41 877022.03 Y 33.77 10.36 0.27
W18 100.00 296151.90 877018.95 Y 28.53 11.29 0.29
W19 100.00 296157.28 877007.80 Y 16.16 14.43 0.38
W20 100.00 296157.35 877001.50 Y 10.55 16.79 0.44
W21 0.00 296194.14 877060.52 Y 74.37 0.00 0.00
W22 0.00 296214.87 877025.82 Y 61.17 0.00 0.00
SW1 0.00 296189.27 877006.50 N 29.30 0.00 0.00
SW2 0.00 296192.60 877035.94 N 52.10 0.00 0.00
SW3 0.00 296165.08 877047.00 N 54.21 0.00 0.00
SW4 0.00 296155.65 877013.84 N 22.39 0.00 0.00
SW5 0.00 296188.46 877057.33 N 69.22 0.00 0.00
TW1 0.00 296176.62 877012.09 N 23.39 0.00 0.00
TW2 0.00 296184.35 877031.55 N 44.05 0.00 0.00
TW3 0.00 296163.97 877032.63 N 39.82 0.00 0.00
Sum 212.13
Drawd. 3.77 4.71
Elev. -3.37 -4.31
Page 6Tower T01 Calculation of Drawdwon Using Deep Wells ARDAMAN-ACE
Alamein Downtown Towers
Aquifer Case: Unconfined with Partial Penetration
Aquifer parameters:
Permeabilty, k (m/s) = 1600
Aquifer Thickness, H (m) = 30
Permeability (m/hour) 5.76
Radius of Influence, Ro (m) = 220
Static Water Elevation (m) = 0.40
Radius of Well, rw (m) 0.225
Length of Well below GWL (m) 14.90 15.10
Case: General - 22 Wells Operating
Check Point CP6
Identification Upper Raft - 8m from Lower
Coordinates
X Y
Well No. Discharge Coord. of Well Oper. 296187.72 876993.45
Dist.
H2-h2
H-h
m3/hour
X Y r (for FP) (for PP)
W1 100.00 296166.25 876997.90 Y 21.93 12.74 0.33
W2 100.00 296173.25 876998.08 Y 15.20 14.77 0.38
W3 100.00 296180.25 876998.26 Y 8.89 17.73 0.46
W4 100.00 296185.86 877000.38 Y 7.17 18.92 0.49
W5 100.00 296200.23 877007.25 Y 18.63 13.64 0.36
W6 100.00 296205.13 877015.97 Y 28.46 11.30 0.29
W7 100.00 296199.37 877024.60 Y 33.26 10.44 0.27
W8 100.00 296195.99 877030.27 Y 37.73 9.74 0.25
W9 100.00 296189.22 877041.60 Y 48.17 8.39 0.14
W10 100.00 296185.81 877047.31 Y 53.89 7.77 0.13
W11 100.00 296181.08 877056.74 Y 63.63 6.86 0.11
W12 100.00 296171.08 877056.62 Y 65.32 6.71 0.11
W13 100.00 296158.08 877046.90 Y 61.12 7.08 0.12
W14 100.00 296153.55 877042.96 Y 60.16 7.17 0.12
W15 100.00 296150.07 877036.89 Y 57.48 7.42 0.12
W16 100.00 296146.59 877030.81 Y 55.56 7.60 0.13
W17 100.00 296146.41 877022.03 Y 50.23 8.16 0.14
W18 100.00 296151.90 877018.95 Y 43.97 8.90 0.15
W19 100.00 296157.28 877007.80 Y 33.65 10.38 0.27
W20 100.00 296157.35 877001.50 Y 31.42 10.76 0.28
W21 0.00 296194.14 877060.52 Y 67.38 0.00 0.00
W22 0.00 296214.87 877025.82 Y 42.24 0.00 0.00
SW1 0.00 296189.27 877006.50 N 13.13 0.00 0.00
SW2 0.00 296192.60 877035.94 N 42.76 0.00 0.00
SW3 0.00 296165.08 877047.00 N 58.14 0.00 0.00
SW4 0.00 296155.65 877013.84 N 38.00 0.00 0.00
SW5 0.00 296188.46 877057.33 N 63.88 0.00 0.00
TW1 0.00 296176.62 877012.09 N 21.69 0.00 0.00
TW2 0.00 296184.35 877031.55 N 38.24 0.00 0.00
TW3 0.00 296163.97 877032.63 N 45.82 0.00 0.00
Sum 206.48
Drawd. 3.67 4.67
Elev. -3.27 -4.27
Page 7Tower T01 Calculation of Drawdwon Using Deep Wells ARDAMAN-ACE
Alamein Downtown Towers
Aquifer Case: Unconfined with Partial Penetration
Aquifer parameters:
Permeabilty, k (m/s) = 1600
Aquifer Thickness, H (m) = 30
Permeability (m/hour) 5.76
Radius of Influence, Ro (m) = 220
Static Water Elevation (m) = 0.40
Radius of Well, rw (m) 0.225
Length of Well below GWL (m) 14.90 15.10
Case: General - 22 Wells Operating
Check Point CP7
Identification Upper Raft - 8m from Lower
Coordinates
X Y
Well No. Discharge Coord. of Well Oper. 296205.14 877024.69
Dist.
H2-h2
H-h
m3/hour
X Y r (for FP) (for PP)
W1 100.00 296166.25 876997.90 Y 47.23 8.50 0.14
W2 100.00 296173.25 876998.08 Y 41.54 9.21 0.15
W3 100.00 296180.25 876998.26 Y 36.31 9.96 0.26
W4 100.00 296185.86 877000.38 Y 31.02 10.83 0.28
W5 100.00 296200.23 877007.25 Y 18.11 13.80 0.36
W6 100.00 296205.13 877015.97 Y 8.71 17.84 0.46
W7 100.00 296199.37 877024.60 Y 5.77 20.12 0.52
W8 100.00 296195.99 877030.27 Y 10.72 16.70 0.44
W9 100.00 296189.22 877041.60 Y 23.23 12.42 0.32
W10 100.00 296185.81 877047.31 Y 29.76 11.06 0.29
W11 100.00 296181.08 877056.74 Y 40.08 9.41 0.25
W12 100.00 296171.08 877056.62 Y 46.69 8.57 0.14
W13 100.00 296158.08 877046.90 Y 52.04 7.97 0.13
W14 100.00 296153.55 877042.96 Y 54.74 7.69 0.13
W15 100.00 296150.07 877036.89 Y 56.41 7.52 0.13
W16 100.00 296146.59 877030.81 Y 58.87 7.29 0.12
W17 100.00 296146.41 877022.03 Y 58.79 7.29 0.12
W18 100.00 296151.90 877018.95 Y 53.55 7.81 0.13
W19 100.00 296157.28 877007.80 Y 50.76 8.10 0.14
W20 100.00 296157.35 877001.50 Y 53.12 7.85 0.13
W21 0.00 296194.14 877060.52 Y 37.49 0.00 0.00
W22 0.00 296214.87 877025.82 Y 9.79 0.00 0.00
SW1 0.00 296189.27 877006.50 N 24.14 0.00 0.00
SW2 0.00 296192.60 877035.94 N 16.85 0.00 0.00
SW3 0.00 296165.08 877047.00 N 45.86 0.00 0.00
SW4 0.00 296155.65 877013.84 N 50.67 0.00 0.00
SW5 0.00 296188.46 877057.33 N 36.66 0.00 0.00
TW1 0.00 296176.62 877012.09 N 31.19 0.00 0.00
TW2 0.00 296184.35 877031.55 N 21.90 0.00 0.00
TW3 0.00 296163.97 877032.63 N 41.93 0.00 0.00
Sum 209.92
Drawd. 3.73 4.65
Elev. -3.33 -4.25
Page 8Tower T01 Calculation of Drawdwon Using Deep Wells ARDAMAN-ACE
Alamein Downtown Towers
Aquifer Case: Unconfined with Partial Penetration
Aquifer parameters:
Permeabilty, k (m/s) = 1600
Aquifer Thickness, H (m) = 30
Permeability (m/hour) 5.76
Radius of Influence, Ro (m) = 220
Static Water Elevation (m) = 0.40
Radius of Well, rw (m) 0.225
Length of Well below GWL (m) 14.90 15.10
Case: General - 22 Wells Operating
Check Point CP8
Identification Upper Raft - 8m from Lower
Coordinates
X Y
Well No. Discharge Coord. of Well Oper. 296188.62 877052.35
Dist.
H2-h2
H-h
m3/hour
X Y r (for FP) (for PP)
W1 100.00 296166.25 876997.90 Y 58.87 7.29 0.12
W2 100.00 296173.25 876998.08 Y 56.41 7.52 0.13
W3 100.00 296180.25 876998.26 Y 54.74 7.69 0.13
W4 100.00 296185.86 877000.38 Y 52.04 7.97 0.13
W5 100.00 296200.23 877007.25 Y 46.57 8.58 0.14
W6 100.00 296205.13 877015.97 Y 39.95 9.43 0.25
W7 100.00 296199.37 877024.60 Y 29.76 11.06 0.29
W8 100.00 296195.99 877030.27 Y 23.28 12.41 0.32
W9 100.00 296189.22 877041.60 Y 10.77 16.67 0.43
W10 100.00 296185.81 877047.31 Y 5.77 20.12 0.52
W11 100.00 296181.08 877056.74 Y 8.73 17.83 0.46
W12 100.00 296171.08 877056.62 Y 18.06 13.82 0.36
W13 100.00 296158.08 877046.90 Y 31.02 10.83 0.28
W14 100.00 296153.55 877042.96 Y 36.31 9.96 0.26
W15 100.00 296150.07 877036.89 Y 41.54 9.21 0.15
W16 100.00 296146.59 877030.81 Y 47.23 8.50 0.14
W17 100.00 296146.41 877022.03 Y 51.97 7.97 0.13
W18 100.00 296151.90 877018.95 Y 49.64 8.23 0.14
W19 100.00 296157.28 877007.80 Y 54.47 7.71 0.13
W20 100.00 296157.35 877001.50 Y 59.70 7.21 0.12
W21 0.00 296194.14 877060.52 Y 9.86 0.00 0.00
W22 0.00 296214.87 877025.82 Y 37.32 0.00 0.00
SW1 0.00 296189.27 877006.50 N 45.86 0.00 0.00
SW2 0.00 296192.60 877035.94 N 16.89 0.00 0.00
SW3 0.00 296165.08 877047.00 N 24.14 0.00 0.00
SW4 0.00 296155.65 877013.84 N 50.70 0.00 0.00
SW5 0.00 296188.46 877057.33 N 4.98 0.00 0.00
TW1 0.00 296176.62 877012.09 N 42.02 0.00 0.00
TW2 0.00 296184.35 877031.55 N 21.24 0.00 0.00
TW3 0.00 296163.97 877032.63 N 31.57 0.00 0.00
Sum 210.00
Drawd. 3.73 4.65
Elev. -3.33 -4.25
Page 9Tower T01 Calculation of Drawdwon Using Deep Wells ARDAMAN-ACE
Alamein Downtown Towers
Aquifer Case: Unconfined with Partial Penetration
Aquifer parameters:
Permeabilty, k (m/s) = 1600
Aquifer Thickness, H (m) = 30
Permeability (m/hour) 5.76
Radius of Influence, Ro (m) = 220
Static Water Elevation (m) = 0.40
Radius of Well, rw (m) 0.225
Length of Well below GWL (m) 14.90 15.10
Case: General - 22 Wells Operating
Check Point CP9
Identification Upper Raft - 8m from Lower
Coordinates
X Y
Well No. Discharge Coord. of Well Oper. 296152.86 877051.82
Dist.
H2-h2
H-h
m3/hour
X Y r (for FP) (for PP)
W1 100.00 296166.25 876997.90 Y 55.56 7.60 0.13
W2 100.00 296173.25 876998.08 Y 57.48 7.42 0.12
W3 100.00 296180.25 876998.26 Y 60.16 7.17 0.12
W4 100.00 296185.86 877000.38 Y 61.12 7.08 0.12
W5 100.00 296200.23 877007.25 Y 65.04 6.73 0.11
W6 100.00 296205.13 877015.97 Y 63.38 6.88 0.11
W7 100.00 296199.37 877024.60 Y 53.89 7.77 0.13
W8 100.00 296195.99 877030.27 Y 48.21 8.39 0.14
W9 100.00 296189.22 877041.60 Y 37.77 9.74 0.25
W10 100.00 296185.81 877047.31 Y 33.26 10.44 0.27
W11 100.00 296181.08 877056.74 Y 28.64 11.27 0.29
W12 100.00 296171.08 877056.62 Y 18.84 13.58 0.35
W13 100.00 296158.08 877046.90 Y 7.17 18.92 0.49
W14 100.00 296153.55 877042.96 Y 8.89 17.73 0.46
W15 100.00 296150.07 877036.89 Y 15.20 14.77 0.38
W16 100.00 296146.59 877030.81 Y 21.93 12.74 0.33
W17 100.00 296146.41 877022.03 Y 30.48 10.92 0.28
W18 100.00 296151.90 877018.95 Y 32.89 10.50 0.27
W19 100.00 296157.28 877007.80 Y 44.25 8.86 0.15
W20 100.00 296157.35 877001.50 Y 50.52 8.13 0.14
W21 0.00 296194.14 877060.52 Y 42.18 0.00 0.00
W22 0.00 296214.87 877025.82 Y 67.24 0.00 0.00
SW1 0.00 296189.27 877006.50 N 58.14 0.00 0.00
SW2 0.00 296192.60 877035.94 N 42.80 0.00 0.00
SW3 0.00 296165.08 877047.00 N 13.13 0.00 0.00
SW4 0.00 296155.65 877013.84 N 38.09 0.00 0.00
SW5 0.00 296188.46 877057.33 N 36.02 0.00 0.00
TW1 0.00 296176.62 877012.09 N 46.30 0.00 0.00
TW2 0.00 296184.35 877031.55 N 37.45 0.00 0.00
TW3 0.00 296163.97 877032.63 N 22.17 0.00 0.00
Sum 206.65
Drawd. 3.67 4.67
Elev. -3.27 -4.27
Page 10Tower T01 Calculation of Drawdwon Using Deep Wells ARDAMAN-ACE
Alamein Downtown Towers
Aquifer Case: Unconfined with Partial Penetration
Aquifer parameters:
Permeabilty, k (m/s) = 1600
Aquifer Thickness, H (m) = 30
Permeability (m/hour) 5.76
Radius of Influence, Ro (m) = 220
Static Water Elevation (m) = 0.40
Radius of Well, rw (m) 0.225
Length of Well below GWL (m) 14.90 15.10
Case: General - 22 Wells Operating
Check Point CP10
Identification Upper Raft - 8m from Lower
Coordinates
X Y
Well No. Discharge Coord. of Well Oper. 296146.57 877040.83
Dist.
H2-h2
H-h
m3/hour
X Y r (for FP) (for PP)
W1 100.00 296166.25 876997.90 Y 47.23 8.50 0.14
W2 100.00 296173.25 876998.08 Y 50.39 8.14 0.14
W3 100.00 296180.25 876998.26 Y 54.28 7.73 0.13
W4 100.00 296185.86 877000.38 Y 56.39 7.52 0.13
W5 100.00 296200.23 877007.25 Y 63.30 6.88 0.11
W6 100.00 296205.13 877015.97 Y 63.62 6.86 0.11
W7 100.00 296199.37 877024.60 Y 55.24 7.64 0.13
W8 100.00 296195.99 877030.27 Y 50.54 8.13 0.14
W9 100.00 296189.22 877041.60 Y 42.66 9.07 0.15
W10 100.00 296185.81 877047.31 Y 39.77 9.45 0.25
W11 100.00 296181.08 877056.74 Y 38.00 9.70 0.25
W12 100.00 296171.08 877056.62 Y 29.16 11.17 0.29
W13 100.00 296158.08 877046.90 Y 13.01 15.63 0.41
W14 100.00 296153.55 877042.96 Y 7.30 18.82 0.49
W15 100.00 296150.07 877036.89 Y 5.28 20.62 0.54
W16 100.00 296146.59 877030.81 Y 10.02 17.07 0.44
W17 100.00 296146.41 877022.03 Y 18.80 13.59 0.35
W18 100.00 296151.90 877018.95 Y 22.52 12.59 0.33
W19 100.00 296157.28 877007.80 Y 34.72 10.20 0.27
W20 100.00 296157.35 877001.50 Y 40.78 9.31 0.24
W21 0.00 296194.14 877060.52 Y 51.49 0.00 0.00
W22 0.00 296214.87 877025.82 Y 69.93 0.00 0.00
SW1 0.00 296189.27 877006.50 N 54.79 0.00 0.00
SW2 0.00 296192.60 877035.94 N 46.29 0.00 0.00
SW3 0.00 296165.08 877047.00 N 19.51 0.00 0.00
SW4 0.00 296155.65 877013.84 N 28.48 0.00 0.00
SW5 0.00 296188.46 877057.33 N 45.02 0.00 0.00
TW1 0.00 296176.62 877012.09 N 41.58 0.00 0.00
TW2 0.00 296184.35 877031.55 N 38.90 0.00 0.00
TW3 0.00 296163.97 877032.63 N 19.24 0.00 0.00
Sum 218.64
Drawd. 3.90 5.04
Elev. -3.50 -4.64
Page 11Tower T01 Calculation of Drawdwon Using Deep Wells ARDAMAN-ACE
Alamein Downtown Towers
Aquifer Case: Unconfined with Partial Penetration
Aquifer parameters:
Permeabilty, k (m/s) = 1600
Aquifer Thickness, H (m) = 30
Permeability (m/hour) 5.76
Radius of Influence, Ro (m) = 220
Static Water Elevation (m) = 0.40
Radius of Well, rw (m) 0.225
Length of Well below GWL (m) 14.90 15.10
Case: General - 22 Wells Operating
Check Point CP11
Identification Upper Raft - Edge
Coordinates
X Y
Well No. Discharge Coord. of Well Oper. 296144.00 877058.95
Dist.
H2-h2
H-h
m3/hour
X Y r (for FP) (for PP)
W1 100.00 296166.25 876997.90 Y 64.98 6.74 0.11
W2 100.00 296173.25 876998.08 Y 67.53 6.53 0.11
W3 100.00 296180.25 876998.26 Y 70.69 6.27 0.10
W4 100.00 296185.86 877000.38 Y 71.99 6.17 0.10
W5 100.00 296200.23 877007.25 Y 76.38 5.85 0.10
W6 100.00 296205.13 877015.97 Y 74.72 5.97 0.10
W7 100.00 296199.37 877024.60 Y 65.16 6.72 0.11
W8 100.00 296195.99 877030.27 Y 59.37 7.24 0.12
W9 100.00 296189.22 877041.60 Y 48.43 8.36 0.14
W10 100.00 296185.81 877047.31 Y 43.40 8.97 0.15
W11 100.00 296181.08 877056.74 Y 37.14 9.83 0.26
W12 100.00 296171.08 877056.62 Y 27.18 11.56 0.30
W13 100.00 296158.08 877046.90 Y 18.53 13.67 0.36
W14 100.00 296153.55 877042.96 Y 18.62 13.65 0.36
W15 100.00 296150.07 877036.89 Y 22.88 12.51 0.33
W16 100.00 296146.59 877030.81 Y 28.26 11.34 0.30
W17 100.00 296146.41 877022.03 Y 36.99 9.85 0.26
W18 100.00 296151.90 877018.95 Y 40.78 9.31 0.24
W19 100.00 296157.28 877007.80 Y 52.85 7.88 0.13
W20 100.00 296157.35 877001.50 Y 58.98 7.27 0.12
W21 0.00 296194.14 877060.52 Y 50.16 0.00 0.00
W22 0.00 296214.87 877025.82 Y 78.23 0.00 0.00
SW1 0.00 296189.27 877006.50 N 69.29 0.00 0.00
SW2 0.00 296192.60 877035.94 N 53.78 0.00 0.00
SW3 0.00 296165.08 877047.00 N 24.23 0.00 0.00
SW4 0.00 296155.65 877013.84 N 46.59 0.00 0.00
SW5 0.00 296188.46 877057.33 N 44.49 0.00 0.00
TW1 0.00 296176.62 877012.09 N 57.10 0.00 0.00
TW2 0.00 296184.35 877031.55 N 48.77 0.00 0.00
TW3 0.00 296163.97 877032.63 N 33.04 0.00 0.00
Sum 175.70
Drawd. 3.09 3.79
Elev. -2.69 -3.39
Page 12Tower T01 Calculation of Drawdwon Using Deep Wells ARDAMAN-ACE
Alamein Downtown Towers
Aquifer Case: Unconfined with Partial Penetration
Aquifer parameters:
Permeabilty, k (m/s) = 1600
Aquifer Thickness, H (m) = 30
Permeability (m/hour) 5.76
Radius of Influence, Ro (m) = 220
Static Water Elevation (m) = 0.40
Radius of Well, rw (m) 0.225
Length of Well below GWL (m) 14.90 15.10
Case: General - 22 Wells Operating
Check Point CP12
Identification Upper Raft - Edge
Coordinates
X Y
Well No. Discharge Coord. of Well Oper. 296189.34 876982.48
Dist.
H2-h2
H-h
m3/hour
X Y r (for FP) (for PP)
W1 100.00 296166.25 876997.90 Y 27.76 11.44 0.30
W2 100.00 296173.25 876998.08 Y 22.41 12.62 0.33
W3 100.00 296180.25 876998.26 Y 18.21 13.77 0.36
W4 100.00 296185.86 877000.38 Y 18.24 13.76 0.36
W5 100.00 296200.23 877007.25 Y 27.06 11.58 0.30
W6 100.00 296205.13 877015.97 Y 37.03 9.85 0.26
W7 100.00 296199.37 877024.60 Y 43.30 8.98 0.15
W8 100.00 296195.99 877030.27 Y 48.25 8.38 0.14
W9 100.00 296189.22 877041.60 Y 59.12 7.26 0.12
W10 100.00 296185.81 877047.31 Y 64.93 6.74 0.11
W11 100.00 296181.08 877056.74 Y 74.72 5.97 0.10
W12 100.00 296171.08 877056.62 Y 76.36 5.85 0.10
W13 100.00 296158.08 877046.90 Y 71.60 6.20 0.10
W14 100.00 296153.55 877042.96 Y 70.28 6.31 0.11
W15 100.00 296150.07 877036.89 Y 67.10 6.56 0.11
W16 100.00 296146.59 877030.81 Y 64.52 6.78 0.11
W17 100.00 296146.41 877022.03 Y 58.37 7.33 0.12
W18 100.00 296151.90 877018.95 Y 52.26 7.94 0.13
W19 100.00 296157.28 877007.80 Y 40.85 9.30 0.24
W20 100.00 296157.35 877001.50 Y 37.21 9.82 0.26
W21 0.00 296194.14 877060.52 Y 78.19 0.00 0.00
W22 0.00 296214.87 877025.82 Y 50.30 0.00 0.00
SW1 0.00 296189.27 877006.50 N 24.02 0.00 0.00
SW2 0.00 296192.60 877035.94 N 53.55 0.00 0.00
SW3 0.00 296165.08 877047.00 N 68.93 0.00 0.00
SW4 0.00 296155.65 877013.84 N 46.02 0.00 0.00
SW5 0.00 296188.46 877057.33 N 74.86 0.00 0.00
TW1 0.00 296176.62 877012.09 N 32.22 0.00 0.00
TW2 0.00 296184.35 877031.55 N 49.32 0.00 0.00
TW3 0.00 296163.97 877032.63 N 56.20 0.00 0.00
Sum 176.46
Drawd. 3.10 3.81
Elev. -2.70 -3.41
Page 13Tower T01 Calculation of Drawdwon Using Deep Wells ARDAMAN-ACE
Alamein Downtown Towers
Aquifer Case: Unconfined with Partial Penetration
Aquifer parameters:
Permeabilty, k (m/s) = 1600
Aquifer Thickness, H (m) = 30
Permeability (m/hour) 5.76
Radius of Influence, Ro (m) = 220
Static Water Elevation (m) = 0.40
Radius of Well, rw (m) 0.225
Length of Well below GWL (m) 14.90 15.10
Case: General - 22 Wells Operating
Check Point CP13
Identification Upper Raft - Edge
Coordinates
X Y
Well No. Discharge Coord. of Well Oper. 296225.89 877047.32
Dist.
H2-h2
H-h
m3/hour
X Y r (for FP) (for PP)
W1 100.00 296166.25 876997.90 Y 77.45 5.77 0.10
W2 100.00 296173.25 876998.08 Y 72.08 6.17 0.10
W3 100.00 296180.25 876998.26 Y 67.01 6.57 0.11
W4 100.00 296185.86 877000.38 Y 61.68 7.03 0.12
W5 100.00 296200.23 877007.25 Y 47.58 8.46 0.14
W6 100.00 296205.13 877015.97 Y 37.60 9.76 0.25
W7 100.00 296199.37 877024.60 Y 34.92 10.17 0.27
W8 100.00 296195.99 877030.27 Y 34.42 10.25 0.27
W9 100.00 296189.22 877041.60 Y 37.11 9.83 0.26
W10 100.00 296185.81 877047.31 Y 40.08 9.41 0.25
W11 100.00 296181.08 877056.74 Y 45.79 8.67 0.14
W12 100.00 296171.08 877056.62 Y 55.59 7.60 0.13
W13 100.00 296158.08 877046.90 Y 67.81 6.50 0.11
W14 100.00 296153.55 877042.96 Y 72.47 6.14 0.10
W15 100.00 296150.07 877036.89 Y 76.53 5.84 0.10
W16 100.00 296146.59 877030.81 Y 80.99 5.52 0.09
W17 100.00 296146.41 877022.03 Y 83.40 5.36 0.09
W18 100.00 296151.90 877018.95 Y 79.24 5.64 0.09
W19 100.00 296157.28 877007.80 Y 79.18 5.65 0.09
W20 100.00 296157.35 877001.50 Y 82.44 5.42 0.09
W21 0.00 296194.14 877060.52 Y 34.39 0.00 0.00
W22 0.00 296214.87 877025.82 Y 24.16 0.00 0.00
SW1 0.00 296189.27 877006.50 N 54.84 0.00 0.00
SW2 0.00 296192.60 877035.94 N 35.18 0.00 0.00
SW3 0.00 296165.08 877047.00 N 60.81 0.00 0.00
SW4 0.00 296155.65 877013.84 N 77.81 0.00 0.00
SW5 0.00 296188.46 877057.33 N 38.75 0.00 0.00
TW1 0.00 296176.62 877012.09 N 60.57 0.00 0.00
TW2 0.00 296184.35 877031.55 N 44.43 0.00 0.00
TW3 0.00 296163.97 877032.63 N 63.64 0.00 0.00
Sum 145.77
Drawd. 2.54 2.90
Elev. -2.14 -2.50
Page 14

