
文档内容
Numerical Test 1
Solutions Booklet
Instructions
This is a warm-up test comprising just 12 questions. You will have 15 minutes to answer them.
Calculators are permitted for this test, and it is recommended you have some rough paper to
work on.
You will have to work quickly and accurately to perform well in this test. If you don’t know the
answer to a question, leave it and come back to it if you have time.
Each question will have four possible answers, one of which is correct. You may click Back and
Next during the test to review or skip questions.
Try to find a time and place where you will not be interrupted during the test. When you are
ready, turn to the next page and begin.
AssessmentDay
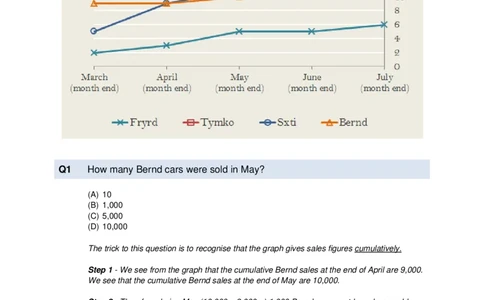
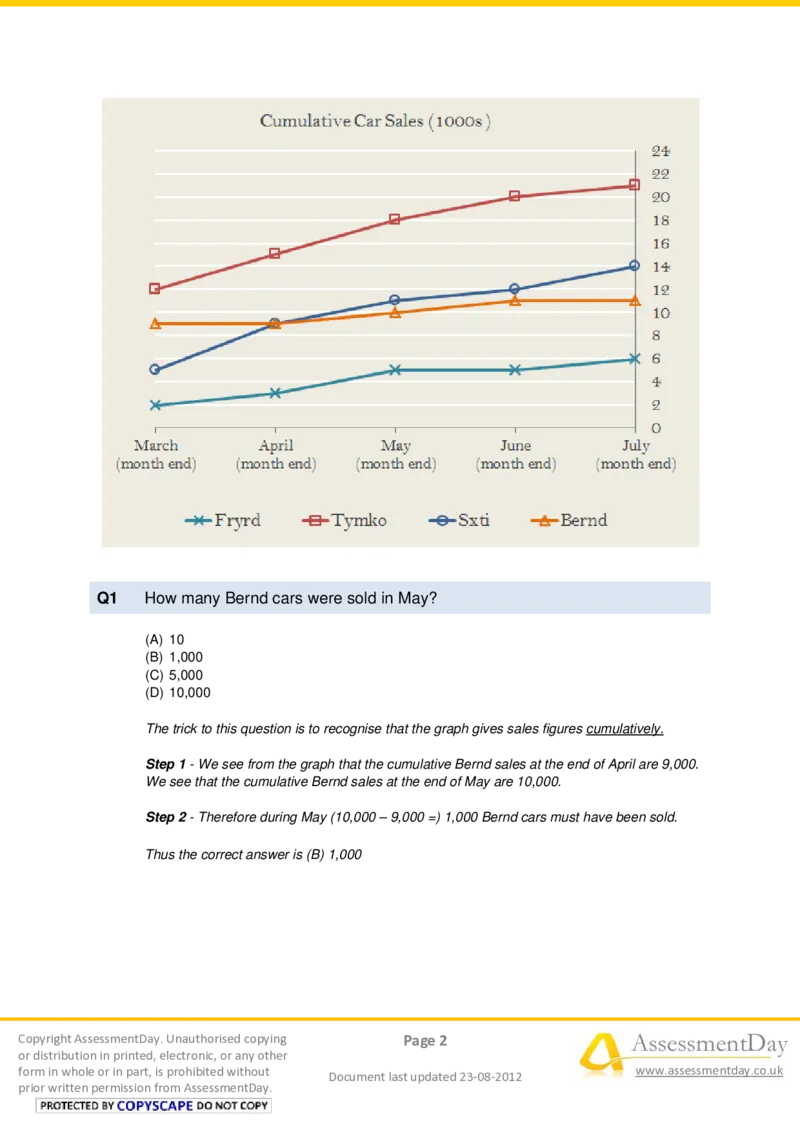
Practice Aptitude TestsQ1 How many Bernd cars were sold in May?
(A) 10
(B) 1,000
(C) 5,000
(D) 10,000
The trick to this question is to recognise that the graph gives sales figures cumulatively.
Step 1 - We see from the graph that the cumulative Bernd sales at the end of April are 9,000.
We see that the cumulative Bernd sales at the end of May are 10,000.
Step 2 - Therefore during May (10,000 – 9,000 =) 1,000 Bernd cars must have been sold.
Thus the correct answer is (B) 1,000
Copyright AssessmentDay. Unauthorised copying Page 2 AssessmentDay
or distribution in printed, electronic, or any other
form in whole or in part, is prohibited without www.assessmentday.co.uk
Document last updated 23-08-2012
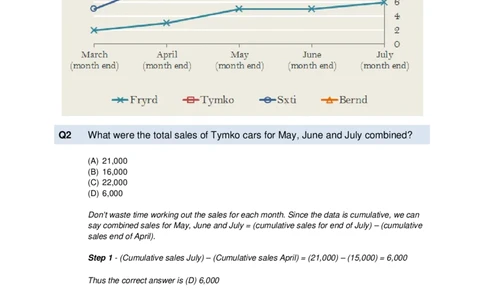
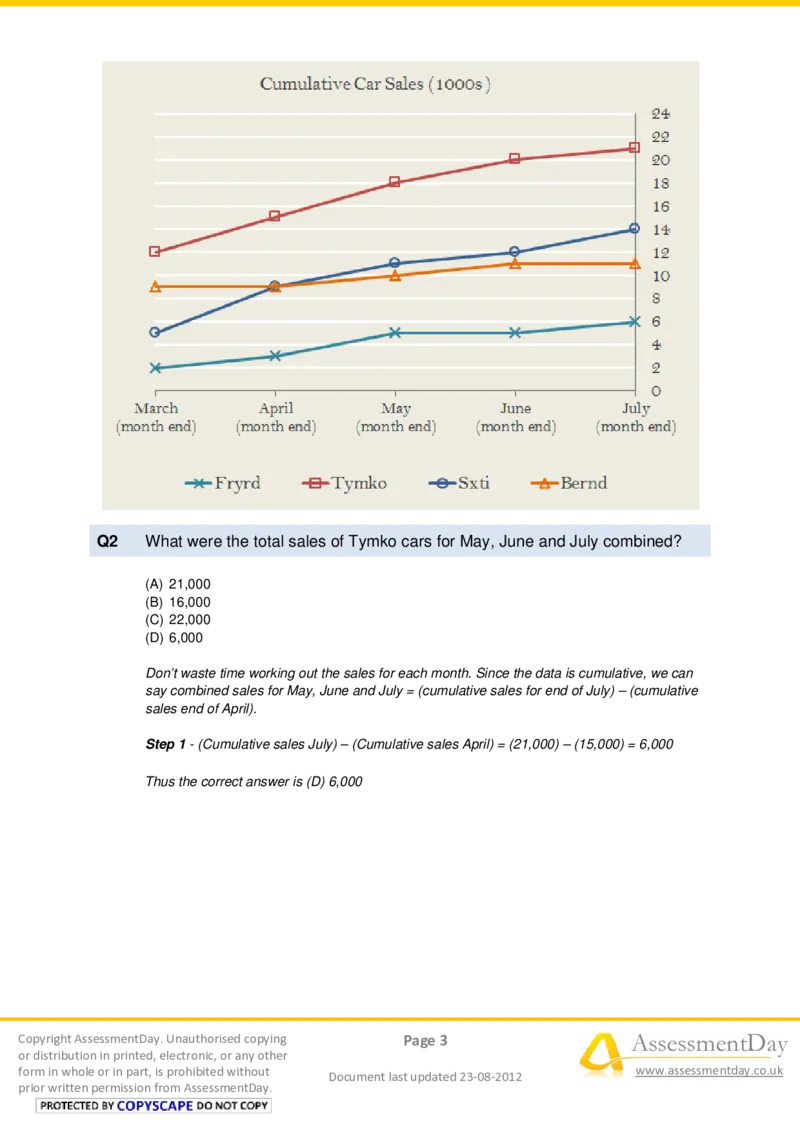
prior written permission from AssessmentDay.Q2 What were the total sales of Tymko cars for May, June and July combined?
(A) 21,000
(B) 16,000
(C) 22,000
(D) 6,000
Don’t waste time working out the sales for each month. Since the data is cumulative, we can
say combined sales for May, June and July = (cumulative sales for end of July) – (cumulative
sales end of April).
Step 1 - (Cumulative sales July) – (Cumulative sales April) = (21,000) – (15,000) = 6,000
Thus the correct answer is (D) 6,000
Copyright AssessmentDay. Unauthorised copying Page 3 AssessmentDay
or distribution in printed, electronic, or any other
form in whole or in part, is prohibited without www.assessmentday.co.uk
Document last updated 23-08-2012
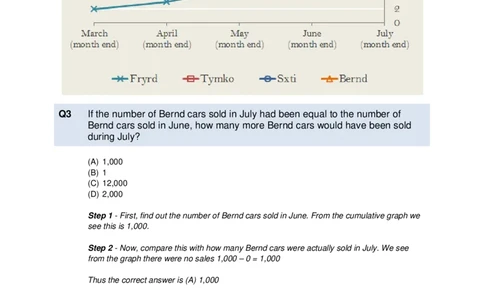
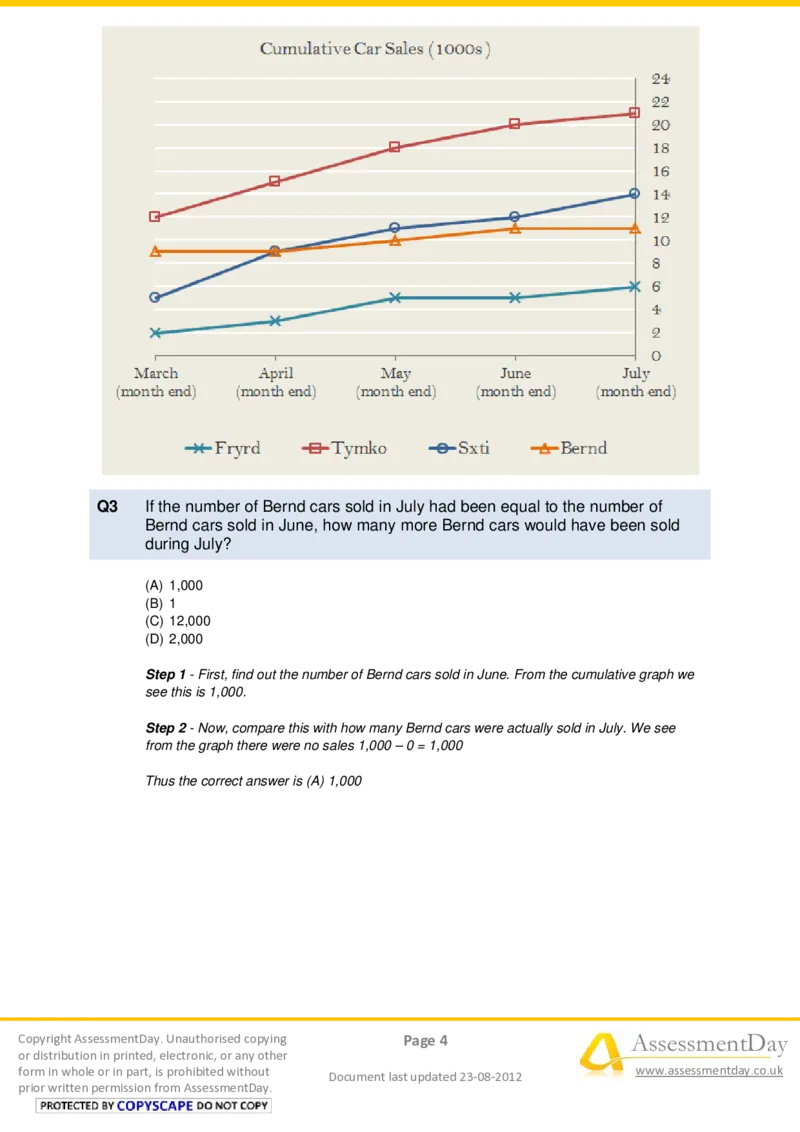
prior written permission from AssessmentDay.Q3 If the number of Bernd cars sold in July had been equal to the number of
Bernd cars sold in June, how many more Bernd cars would have been sold
during July?
(A) 1,000
(B) 1
(C) 12,000
(D) 2,000
Step 1 - First, find out the number of Bernd cars sold in June. From the cumulative graph we
see this is 1,000.
Step 2 - Now, compare this with how many Bernd cars were actually sold in July. We see
from the graph there were no sales 1,000 – 0 = 1,000
Thus the correct answer is (A) 1,000
Copyright AssessmentDay. Unauthorised copying Page 4 AssessmentDay
or distribution in printed, electronic, or any other
form in whole or in part, is prohibited without www.assessmentday.co.uk
Document last updated 23-08-2012
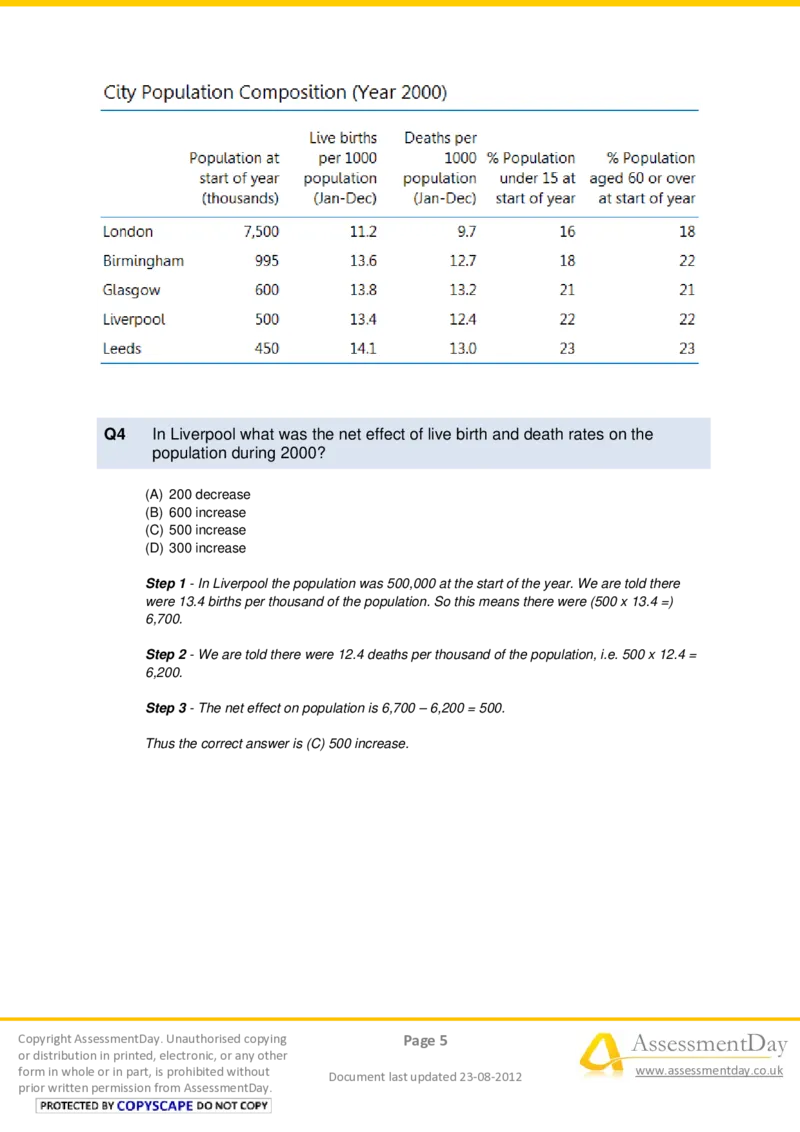
prior written permission from AssessmentDay.Q4 In Liverpool what was the net effect of live birth and death rates on the
population during 2000?
(A) 200 decrease
(B) 600 increase
(C) 500 increase
(D) 300 increase
Step 1 - In Liverpool the population was 500,000 at the start of the year. We are told there
were 13.4 births per thousand of the population. So this means there were (500 x 13.4 =)
6,700.
Step 2 - We are told there were 12.4 deaths per thousand of the population, i.e. 500 x 12.4 =
6,200.
Step 3 - The net effect on population is 6,700 – 6,200 = 500.
Thus the correct answer is (C) 500 increase.
Copyright AssessmentDay. Unauthorised copying Page 5 AssessmentDay
or distribution in printed, electronic, or any other
form in whole or in part, is prohibited without www.assessmentday.co.uk
Document last updated 23-08-2012
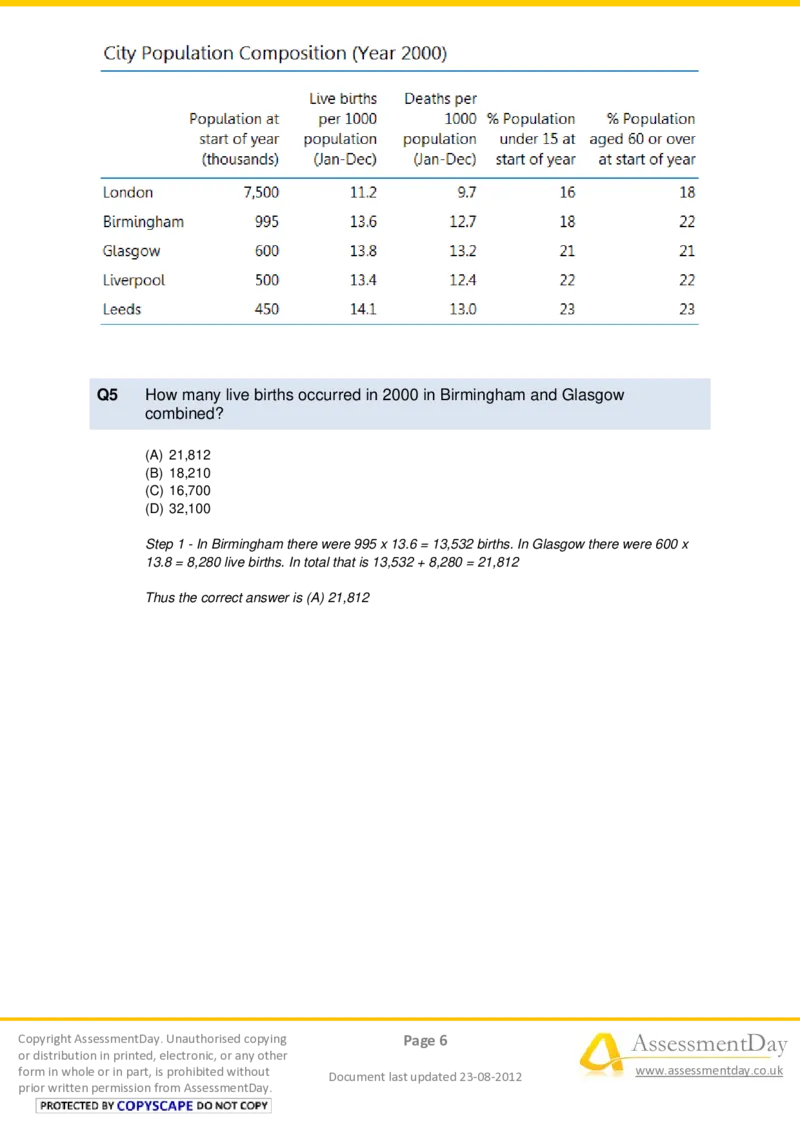
prior written permission from AssessmentDay.Q5 How many live births occurred in 2000 in Birmingham and Glasgow
combined?
(A) 21,812
(B) 18,210
(C) 16,700
(D) 32,100
Step 1 - In Birmingham there were 995 x 13.6 = 13,532 births. In Glasgow there were 600 x
13.8 = 8,280 live births. In total that is 13,532 + 8,280 = 21,812
Thus the correct answer is (A) 21,812
Copyright AssessmentDay. Unauthorised copying Page 6 AssessmentDay
or distribution in printed, electronic, or any other
form in whole or in part, is prohibited without www.assessmentday.co.uk
Document last updated 23-08-2012
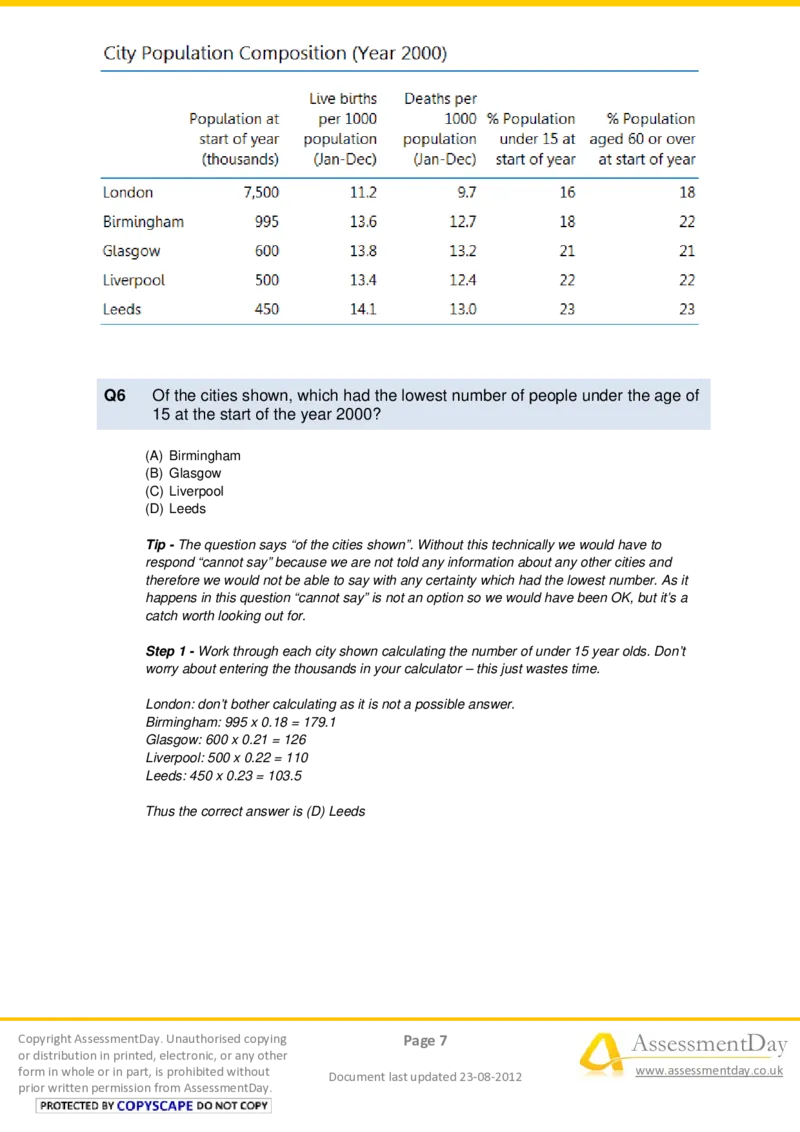
prior written permission from AssessmentDay.Q6 Of the cities shown, which had the lowest number of people under the age of
15 at the start of the year 2000?
(A) Birmingham
(B) Glasgow
(C) Liverpool
(D) Leeds
Tip - The question says “of the cities shown”. Without this technically we would have to
respond “cannot say” because we are not told any information about any other cities and
therefore we would not be able to say with any certainty which had the lowest number. As it
happens in this question “cannot say” is not an option so we would have been OK, but it’s a
catch worth looking out for.
Step 1 - Work through each city shown calculating the number of under 15 year olds. Don’t
worry about entering the thousands in your calculator – this just wastes time.
London: don’t bother calculating as it is not a possible answer.
Birmingham: 995 x 0.18 = 179.1
Glasgow: 600 x 0.21 = 126
Liverpool: 500 x 0.22 = 110
Leeds: 450 x 0.23 = 103.5
Thus the correct answer is (D) Leeds
Copyright AssessmentDay. Unauthorised copying Page 7 AssessmentDay
or distribution in printed, electronic, or any other
form in whole or in part, is prohibited without www.assessmentday.co.uk
Document last updated 23-08-2012
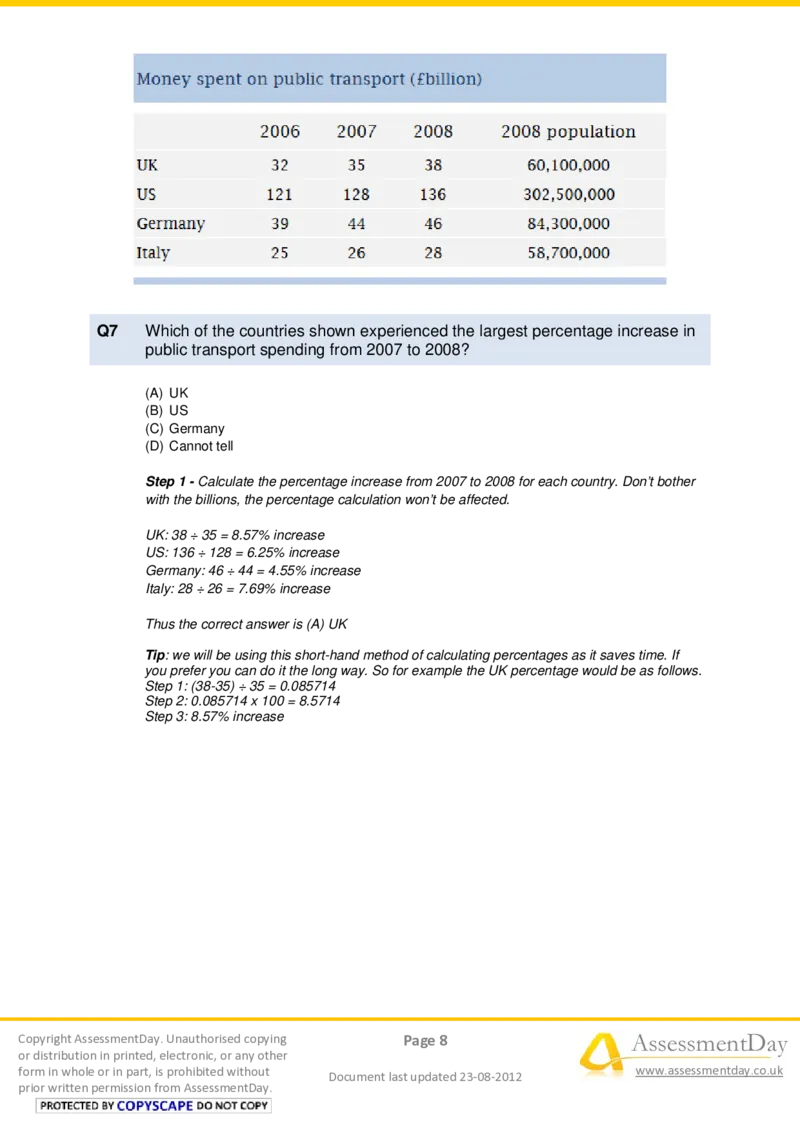
prior written permission from AssessmentDay.Q7 Which of the countries shown experienced the largest percentage increase in
public transport spending from 2007 to 2008?
(A) UK
(B) US
(C) Germany
(D) Cannot tell
Step 1 - Calculate the percentage increase from 2007 to 2008 for each country. Don’t bother
with the billions, the percentage calculation won’t be affected.
UK: 38 ÷ 35 = 8.57% increase
US: 136 ÷ 128 = 6.25% increase
Germany: 46 ÷ 44 = 4.55% increase
Italy: 28 ÷ 26 = 7.69% increase
Thus the correct answer is (A) UK
Tip: we will be using this short-hand method of calculating percentages as it saves time. If
you prefer you can do it the long way. So for example the UK percentage would be as follows.
Step 1: (38-35) ÷ 35 = 0.085714
Step 2: 0.085714 x 100 = 8.5714
Step 3: 8.57% increase
Copyright AssessmentDay. Unauthorised copying Page 8 AssessmentDay
or distribution in printed, electronic, or any other
form in whole or in part, is prohibited without www.assessmentday.co.uk
Document last updated 23-08-2012
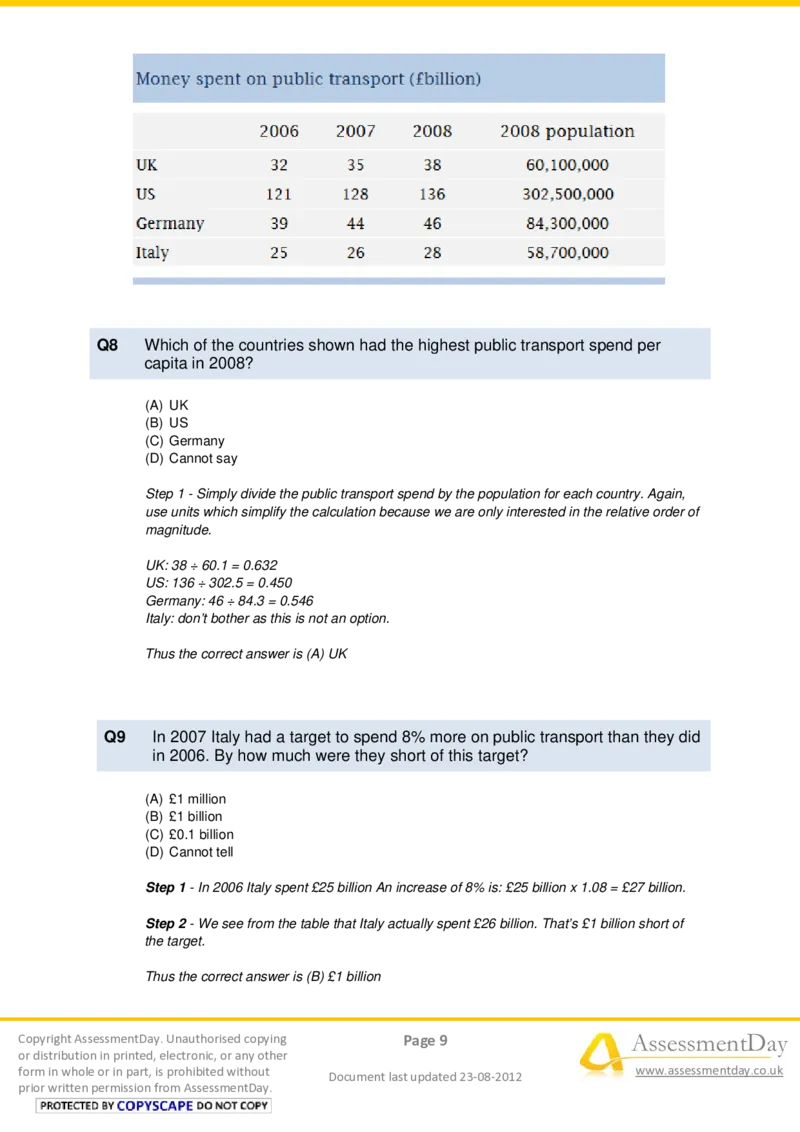
prior written permission from AssessmentDay.Q8 Which of the countries shown had the highest public transport spend per
capita in 2008?
(A) UK
(B) US
(C) Germany
(D) Cannot say
Step 1 - Simply divide the public transport spend by the population for each country. Again,
use units which simplify the calculation because we are only interested in the relative order of
magnitude.
UK: 38 ÷ 60.1 = 0.632
US: 136 ÷ 302.5 = 0.450
Germany: 46 ÷ 84.3 = 0.546
Italy: don’t bother as this is not an option.
Thus the correct answer is (A) UK
Q9 In 2007 Italy had a target to spend 8% more on public transport than they did
in 2006. By how much were they short of this target?
(A) £1 million
(B) £1 billion
(C) £0.1 billion
(D) Cannot tell
Step 1 - In 2006 Italy spent £25 billion An increase of 8% is: £25 billion x 1.08 = £27 billion.
Step 2 - We see from the table that Italy actually spent £26 billion. That’s £1 billion short of
the target.
Thus the correct answer is (B) £1 billion
Copyright AssessmentDay. Unauthorised copying Page 9 AssessmentDay
or distribution in printed, electronic, or any other
form in whole or in part, is prohibited without www.assessmentday.co.uk
Document last updated 23-08-2012
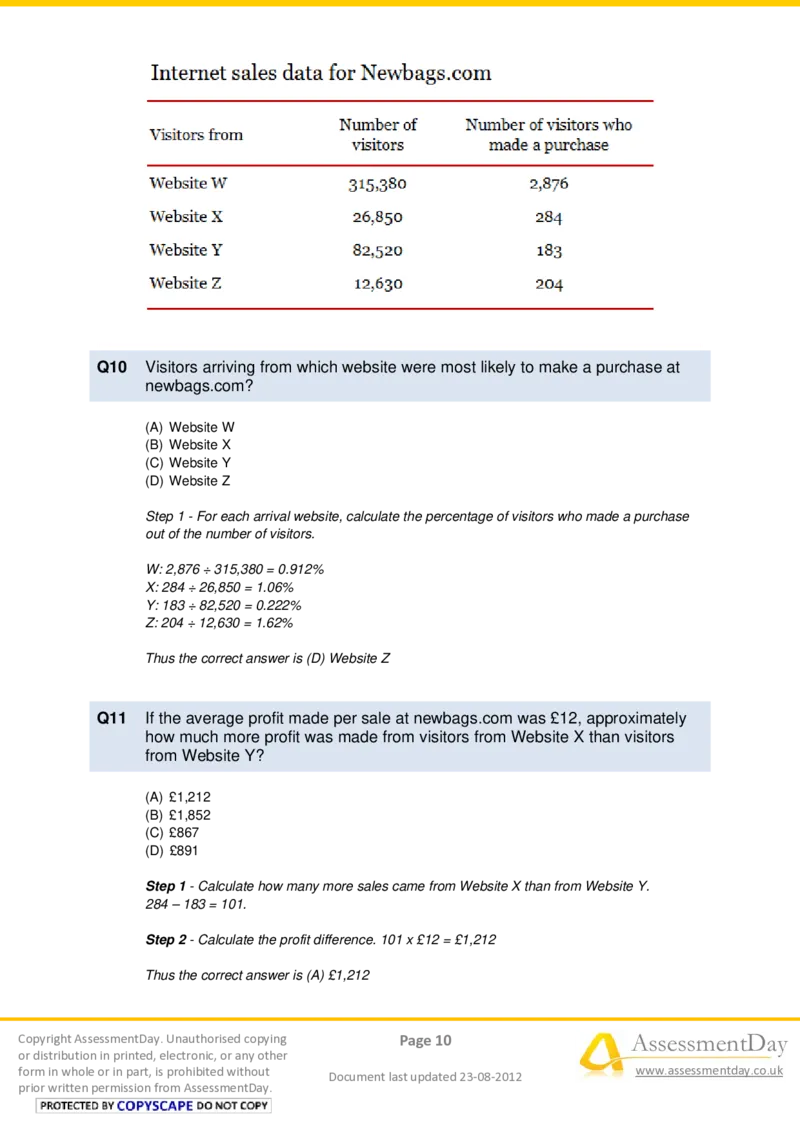
prior written permission from AssessmentDay.Q10 Visitors arriving from which website were most likely to make a purchase at
newbags.com?
(A) Website W
(B) Website X
(C) Website Y
(D) Website Z
Step 1 - For each arrival website, calculate the percentage of visitors who made a purchase
out of the number of visitors.
W: 2,876 ÷ 315,380 = 0.912%
X: 284 ÷ 26,850 = 1.06%
Y: 183 ÷ 82,520 = 0.222%
Z: 204 ÷ 12,630 = 1.62%
Thus the correct answer is (D) Website Z
Q11 If the average profit made per sale at newbags.com was £12, approximately
how much more profit was made from visitors from Website X than visitors
from Website Y?
(A) £1,212
(B) £1,852
(C) £867
(D) £891
Step 1 - Calculate how many more sales came from Website X than from Website Y.
284 – 183 = 101.
Step 2 - Calculate the profit difference. 101 x £12 = £1,212
Thus the correct answer is (A) £1,212
Copyright AssessmentDay. Unauthorised copying Page 10 AssessmentDay
or distribution in printed, electronic, or any other
form in whole or in part, is prohibited without www.assessmentday.co.uk
Document last updated 23-08-2012
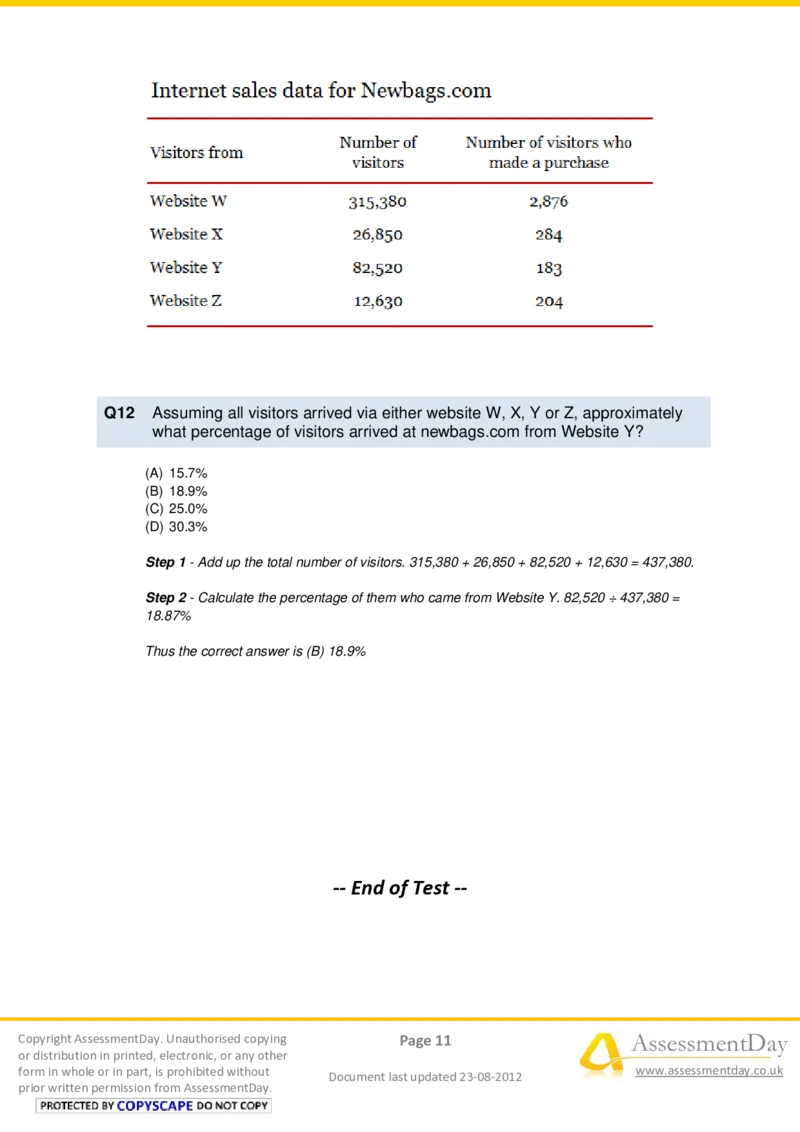
prior written permission from AssessmentDay.Q12 Assuming all visitors arrived via either website W, X, Y or Z, approximately
what percentage of visitors arrived at newbags.com from Website Y?
(A) 15.7%
(B) 18.9%
(C) 25.0%
(D) 30.3%
Step 1 - Add up the total number of visitors. 315,380 + 26,850 + 82,520 + 12,630 = 437,380.
Step 2 - Calculate the percentage of them who came from Website Y. 82,520 ÷ 437,380 =
18.87%
Thus the correct answer is (B) 18.9%
-- End of Test --
Copyright AssessmentDay. Unauthorised copying Page 11 AssessmentDay
or distribution in printed, electronic, or any other
form in whole or in part, is prohibited without www.assessmentday.co.uk
Document last updated 23-08-2012
prior written permission from AssessmentDay.

