


文档内容
Numerical Test 2
Solutions Booklet
Instructions
This numerical reasoning test comprises 30 questions, and you will have 30 minutes in
which to correctly answer as many as you can. Calculators are permitted for this test, and it is
recommended you have some rough paper to work on.
You will have to work quickly and accurately to perform well in this test. If you don't know the
answer to a question, leave it and come back to it if you have time. Each question will have
five possible answers, one of which is correct. You may click Back and Next during the test to
review or skip questions.
You can submit your test at any time. If the time limit is up before you click submit the test will
automatically be submitted with the answers you have selected. It is recommended to keep
working until the time limit is up.
Try to find a time and place where you will not be interrupted during the test. The test will
begin on the next page.
AssessmentDay
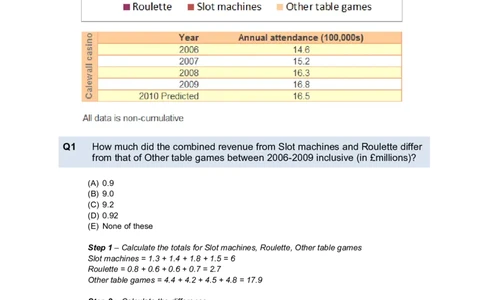
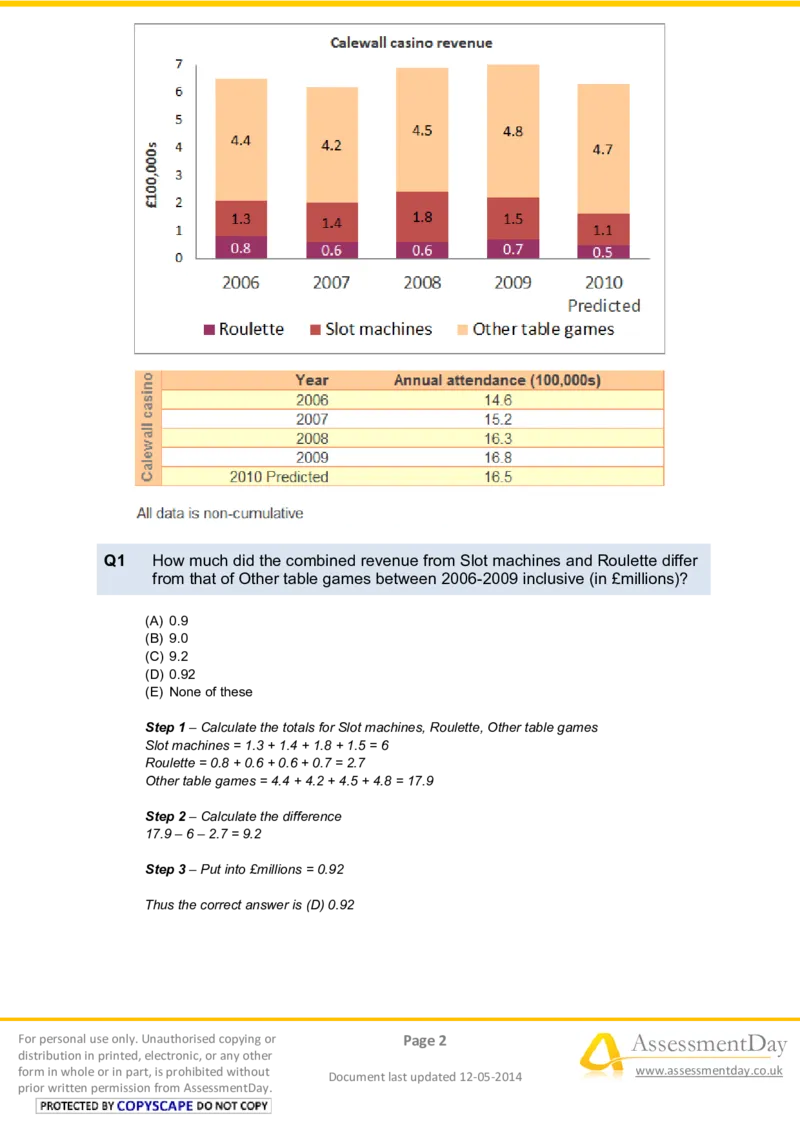
Practice Aptitude TestsQ1 How much did the combined revenue from Slot machines and Roulette differ
from that of Other table games between 2006-2009 inclusive (in £millions)?
(A) 0.9
(B) 9.0
(C) 9.2
(D) 0.92
(E) None of these
Step 1 – Calculate the totals for Slot machines, Roulette, Other table games
Slot machines = 1.3 + 1.4 + 1.8 + 1.5 = 6
Roulette = 0.8 + 0.6 + 0.6 + 0.7 = 2.7
Other table games = 4.4 + 4.2 + 4.5 + 4.8 = 17.9
Step 2 – Calculate the difference
17.9 – 6 – 2.7 = 9.2
Step 3 – Put into £millions = 0.92
Thus the correct answer is (D) 0.92
For personal use only. Unauthorised copying or Page 2 AssessmentDay
distribution in printed, electronic, or any other
form in whole or in part, is prohibited without
Document last updated 12-05-2014
www.assessmentday.co.uk
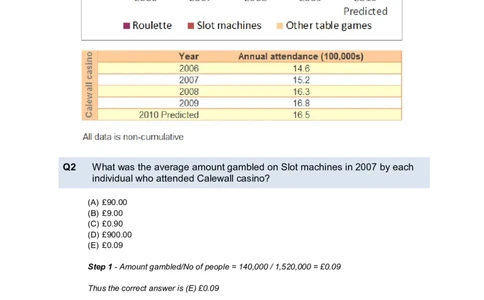
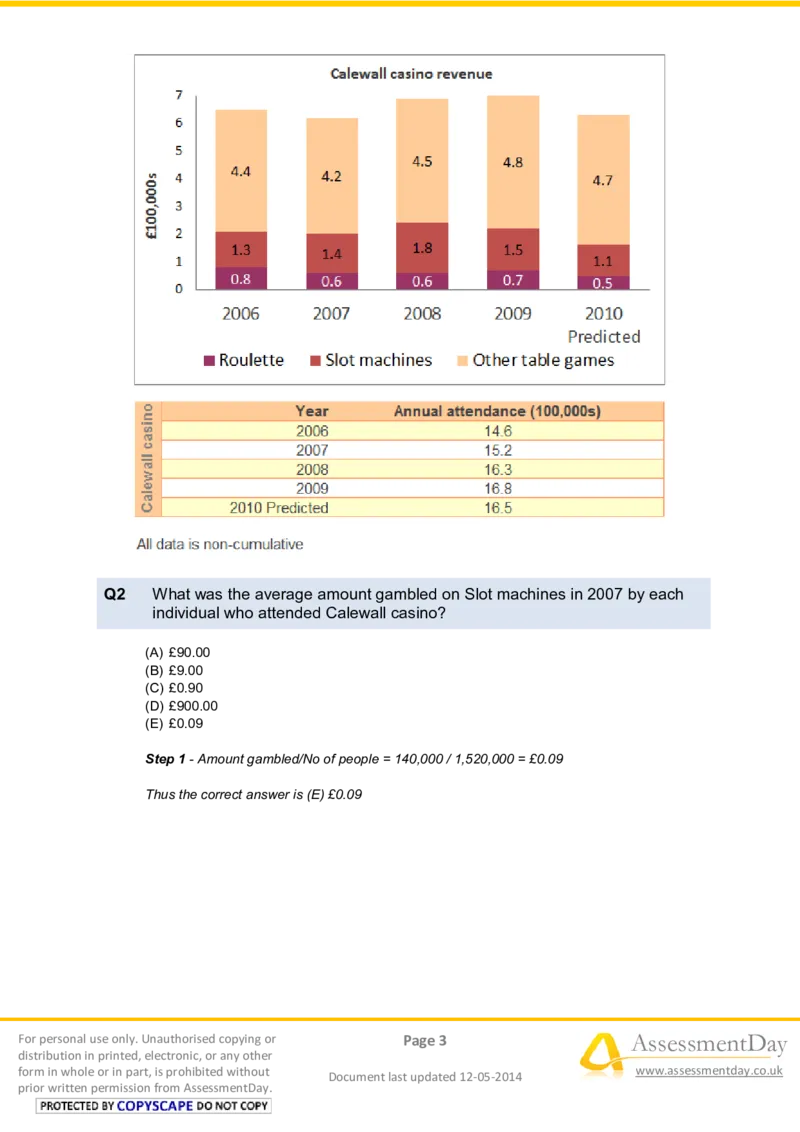
prior written permission from AssessmentDay.Q2 What was the average amount gambled on Slot machines in 2007 by each
individual who attended Calewall casino?
(A) £90.00
(B) £9.00
(C) £0.90
(D) £900.00
(E) £0.09
Step 1 - Amount gambled/No of people = 140,000 / 1,520,000 = £0.09
Thus the correct answer is (E) £0.09
For personal use only. Unauthorised copying or Page 3 AssessmentDay
distribution in printed, electronic, or any other
form in whole or in part, is prohibited without
Document last updated 12-05-2014
www.assessmentday.co.uk
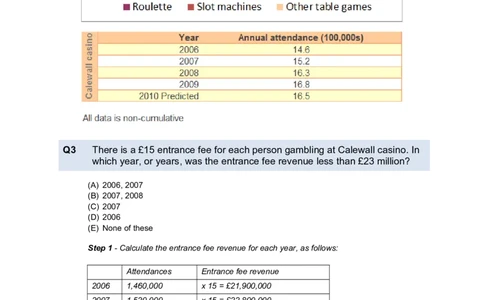
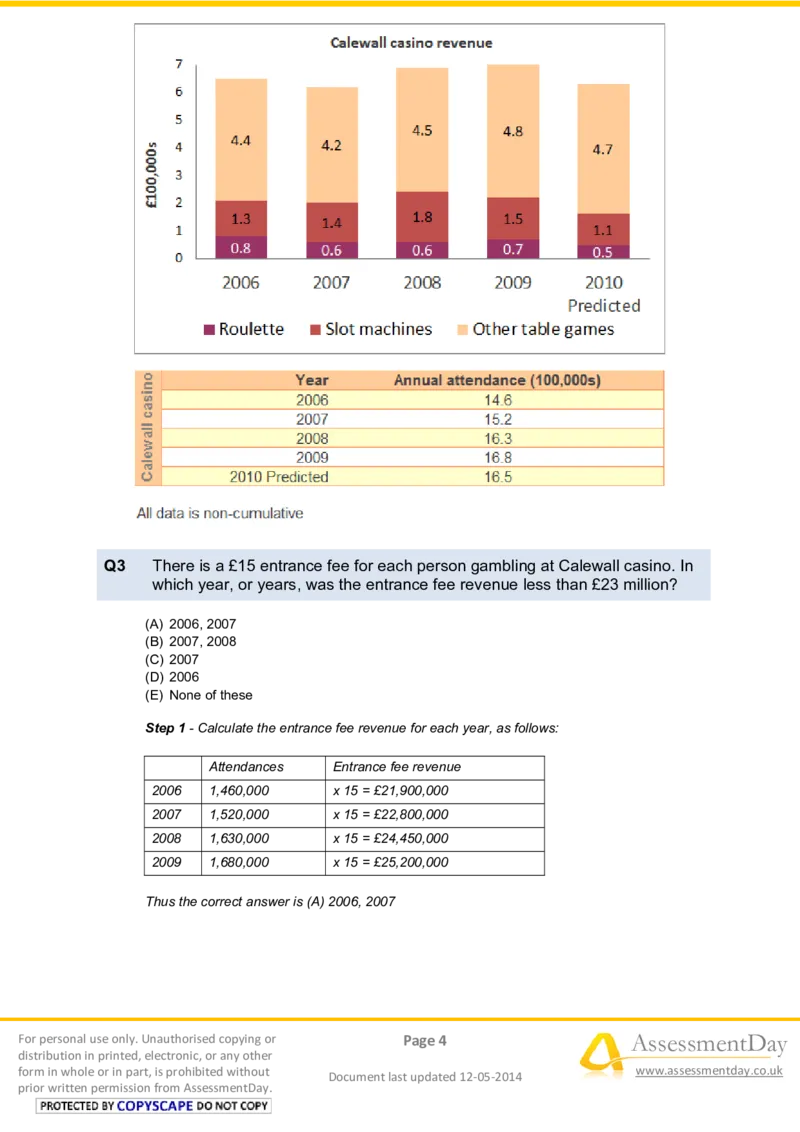
prior written permission from AssessmentDay.Q3 There is a £15 entrance fee for each person gambling at Calewall casino. In
which year, or years, was the entrance fee revenue less than £23 million?
(A) 2006, 2007
(B) 2007, 2008
(C) 2007
(D) 2006
(E) None of these
Step 1 - Calculate the entrance fee revenue for each year, as follows:
Attendances Entrance fee revenue
2006 1,460,000 x 15 = £21,900,000
2007 1,520,000 x 15 = £22,800,000
2008 1,630,000 x 15 = £24,450,000
2009 1,680,000 x 15 = £25,200,000
Thus the correct answer is (A) 2006, 2007
For personal use only. Unauthorised copying or Page 4 AssessmentDay
distribution in printed, electronic, or any other
form in whole or in part, is prohibited without
Document last updated 12-05-2014
www.assessmentday.co.uk
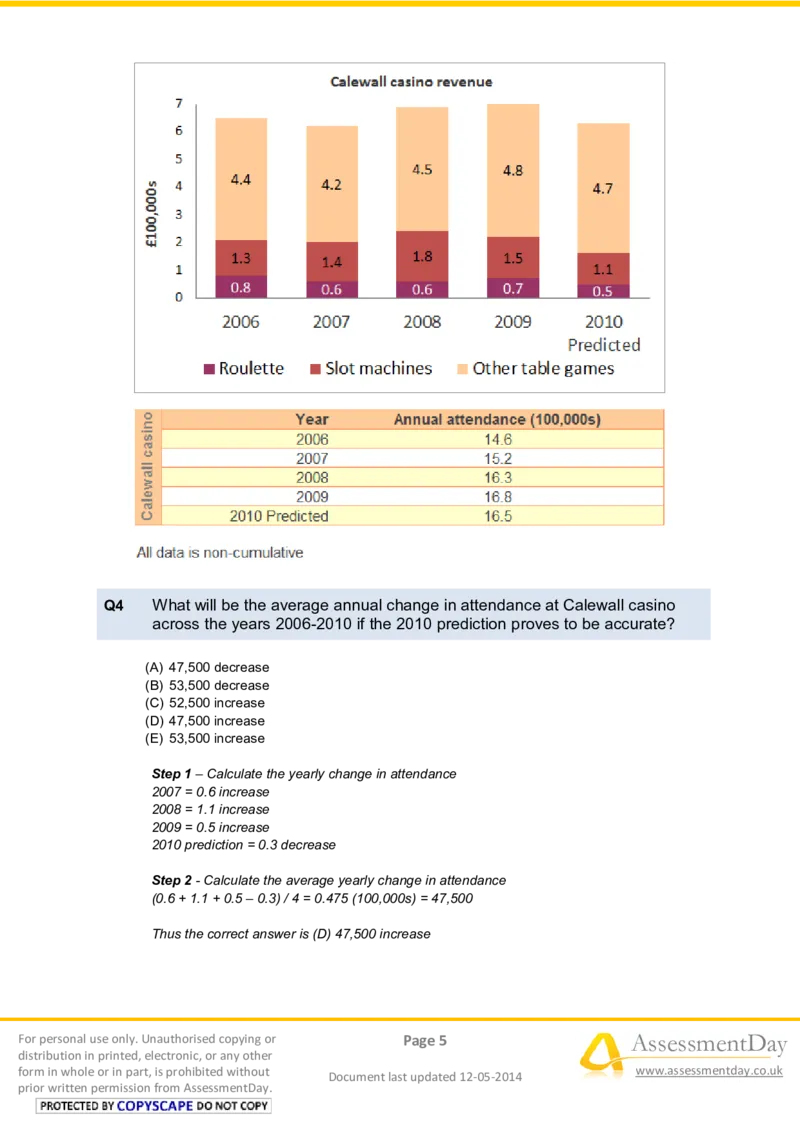
prior written permission from AssessmentDay.Q4 What will be the average annual change in attendance at Calewall casino
across the years 2006-2010 if the 2010 prediction proves to be accurate?
(A) 47,500 decrease
(B) 53,500 decrease
(C) 52,500 increase
(D) 47,500 increase
(E) 53,500 increase
Step 1 – Calculate the yearly change in attendance
2007 = 0.6 increase
2008 = 1.1 increase
2009 = 0.5 increase
2010 prediction = 0.3 decrease
Step 2 - Calculate the average yearly change in attendance
(0.6 + 1.1 + 0.5 – 0.3) / 4 = 0.475 (100,000s) = 47,500
Thus the correct answer is (D) 47,500 increase
For personal use only. Unauthorised copying or Page 5 AssessmentDay
distribution in printed, electronic, or any other
form in whole or in part, is prohibited without
Document last updated 12-05-2014
www.assessmentday.co.uk
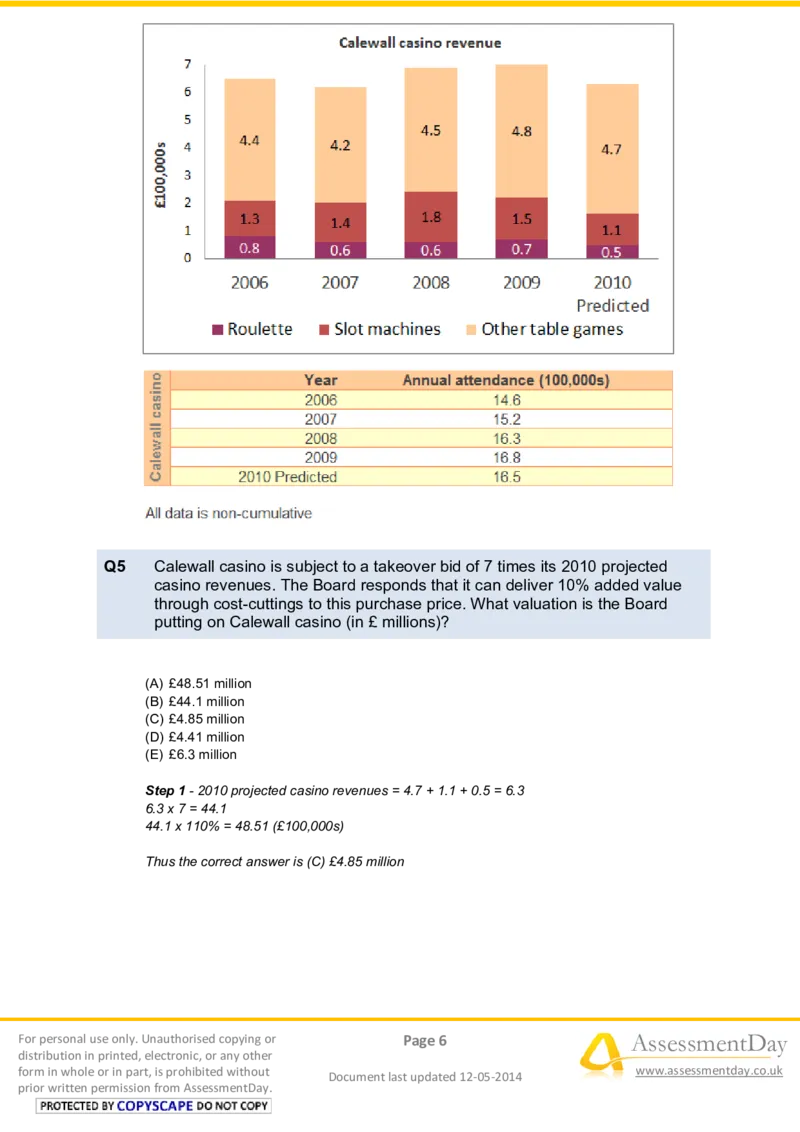
prior written permission from AssessmentDay.Q5 Calewall casino is subject to a takeover bid of 7 times its 2010 projected
casino revenues. The Board responds that it can deliver 10% added value
through cost-cuttings to this purchase price. What valuation is the Board
putting on Calewall casino (in £ millions)?
(A) £48.51 million
(B) £44.1 million
(C) £4.85 million
(D) £4.41 million
(E) £6.3 million
Step 1 - 2010 projected casino revenues = 4.7 + 1.1 + 0.5 = 6.3
6.3 x 7 = 44.1
44.1 x 110% = 48.51 (£100,000s)
Thus the correct answer is (C) £4.85 million
For personal use only. Unauthorised copying or Page 6 AssessmentDay
distribution in printed, electronic, or any other
form in whole or in part, is prohibited without
Document last updated 12-05-2014
www.assessmentday.co.uk
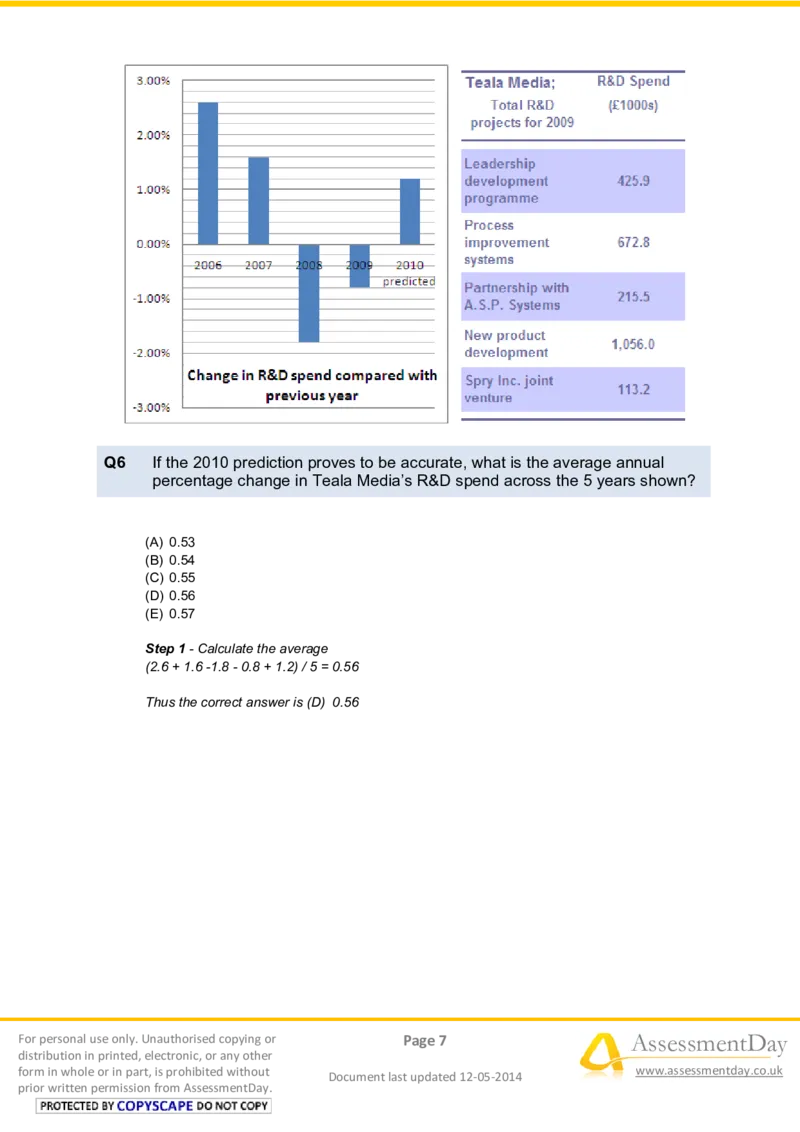
prior written permission from AssessmentDay.Q6 If the 2010 prediction proves to be accurate, what is the average annual
percentage change in Teala Media’s R&D spend across the 5 years shown?
(A) 0.53
(B) 0.54
(C) 0.55
(D) 0.56
(E) 0.57
Step 1 - Calculate the average
(2.6 + 1.6 -1.8 - 0.8 + 1.2) / 5 = 0.56
Thus the correct answer is (D) 0.56
For personal use only. Unauthorised copying or Page 7 AssessmentDay
distribution in printed, electronic, or any other
form in whole or in part, is prohibited without
Document last updated 12-05-2014
www.assessmentday.co.uk
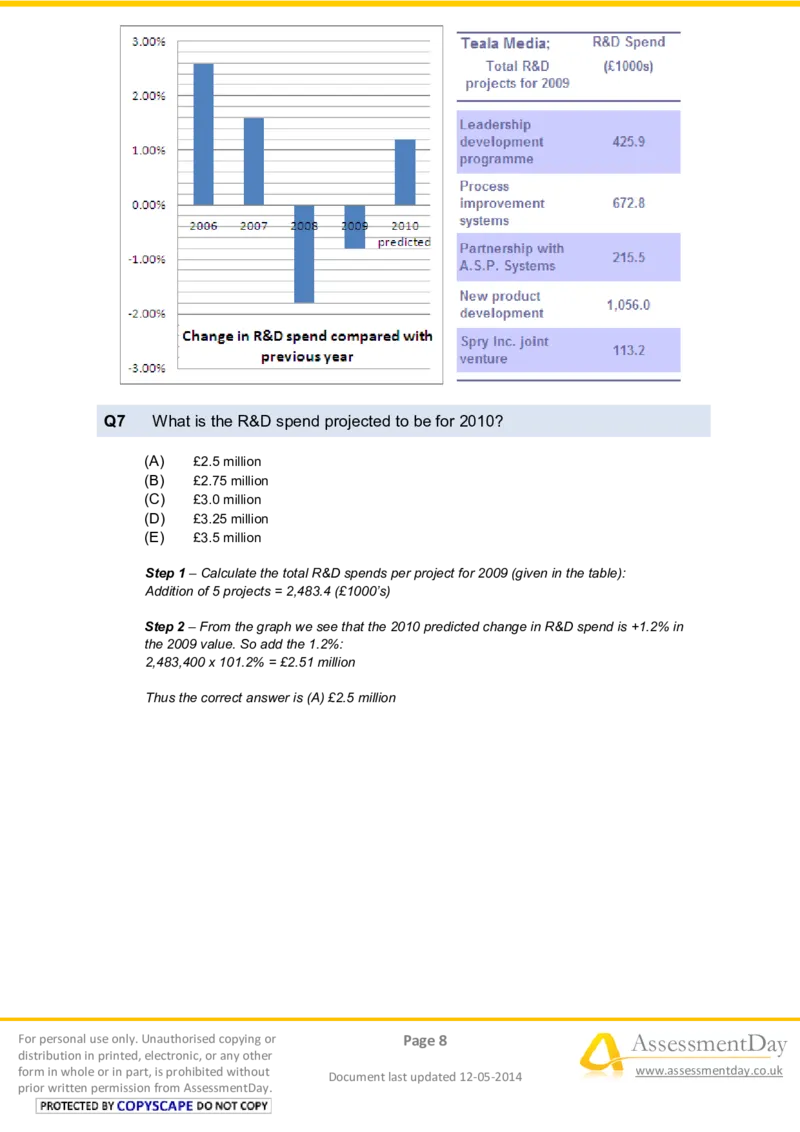
prior written permission from AssessmentDay.Q7 What is the R&D spend projected to be for 2010?
(A) £2.5 million
(B) £2.75 million
(C) £3.0 million
(D) £3.25 million
(E) £3.5 million
Step 1 – Calculate the total R&D spends per project for 2009 (given in the table):
Addition of 5 projects = 2,483.4 (£1000’s)
Step 2 – From the graph we see that the 2010 predicted change in R&D spend is +1.2% in
the 2009 value. So add the 1.2%:
2,483,400 x 101.2% = £2.51 million
Thus the correct answer is (A) £2.5 million
For personal use only. Unauthorised copying or Page 8 AssessmentDay
distribution in printed, electronic, or any other
form in whole or in part, is prohibited without
Document last updated 12-05-2014
www.assessmentday.co.uk
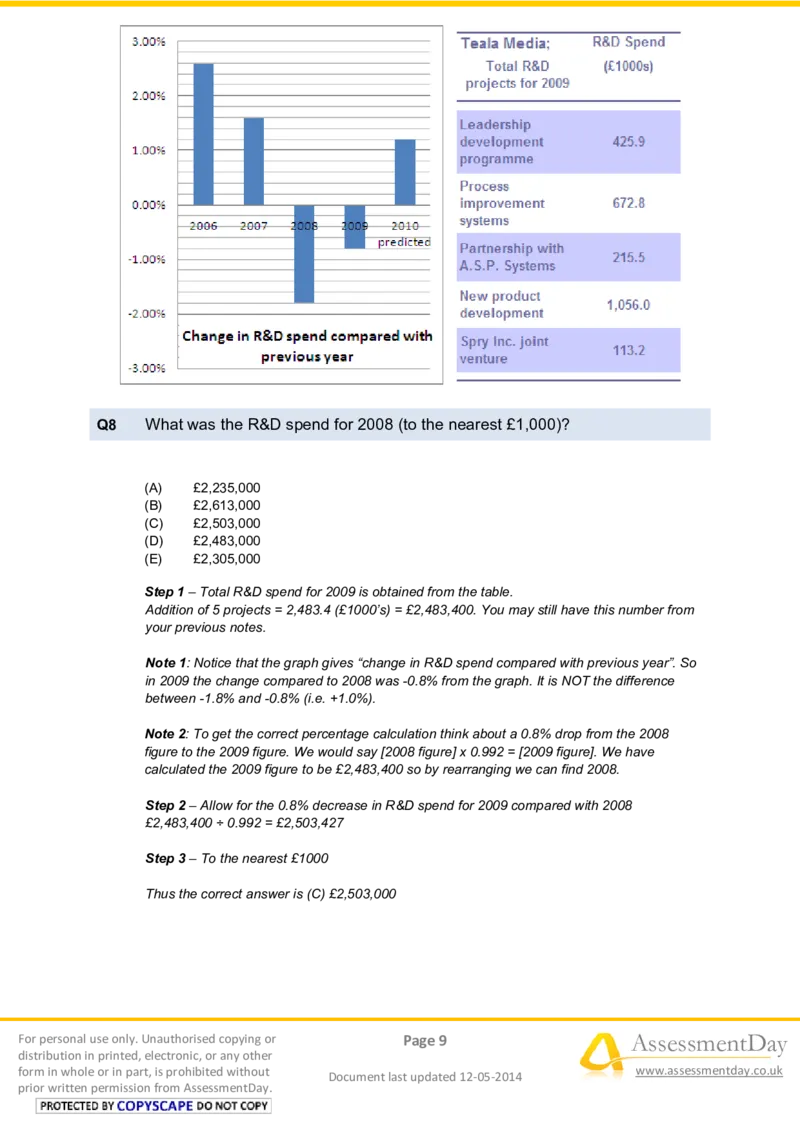
prior written permission from AssessmentDay.Q8 What was the R&D spend for 2008 (to the nearest £1,000)?
(A) £2,235,000
(B) £2,613,000
(C) £2,503,000
(D) £2,483,000
(E) £2,305,000
Step 1 – Total R&D spend for 2009 is obtained from the table.
Addition of 5 projects = 2,483.4 (£1000’s) = £2,483,400. You may still have this number from
your previous notes.
Note 1: Notice that the graph gives “change in R&D spend compared with previous year”. So
in 2009 the change compared to 2008 was -0.8% from the graph. It is NOT the difference
between -1.8% and -0.8% (i.e. +1.0%).
Note 2: To get the correct percentage calculation think about a 0.8% drop from the 2008
figure to the 2009 figure. We would say [2008 figure] x 0.992 = [2009 figure]. We have
calculated the 2009 figure to be £2,483,400 so by rearranging we can find 2008.
Step 2 – Allow for the 0.8% decrease in R&D spend for 2009 compared with 2008
£2,483,400 ÷ 0.992 = £2,503,427
Step 3 – To the nearest £1000
Thus the correct answer is (C) £2,503,000
For personal use only. Unauthorised copying or Page 9 AssessmentDay
distribution in printed, electronic, or any other
form in whole or in part, is prohibited without
Document last updated 12-05-2014
www.assessmentday.co.uk
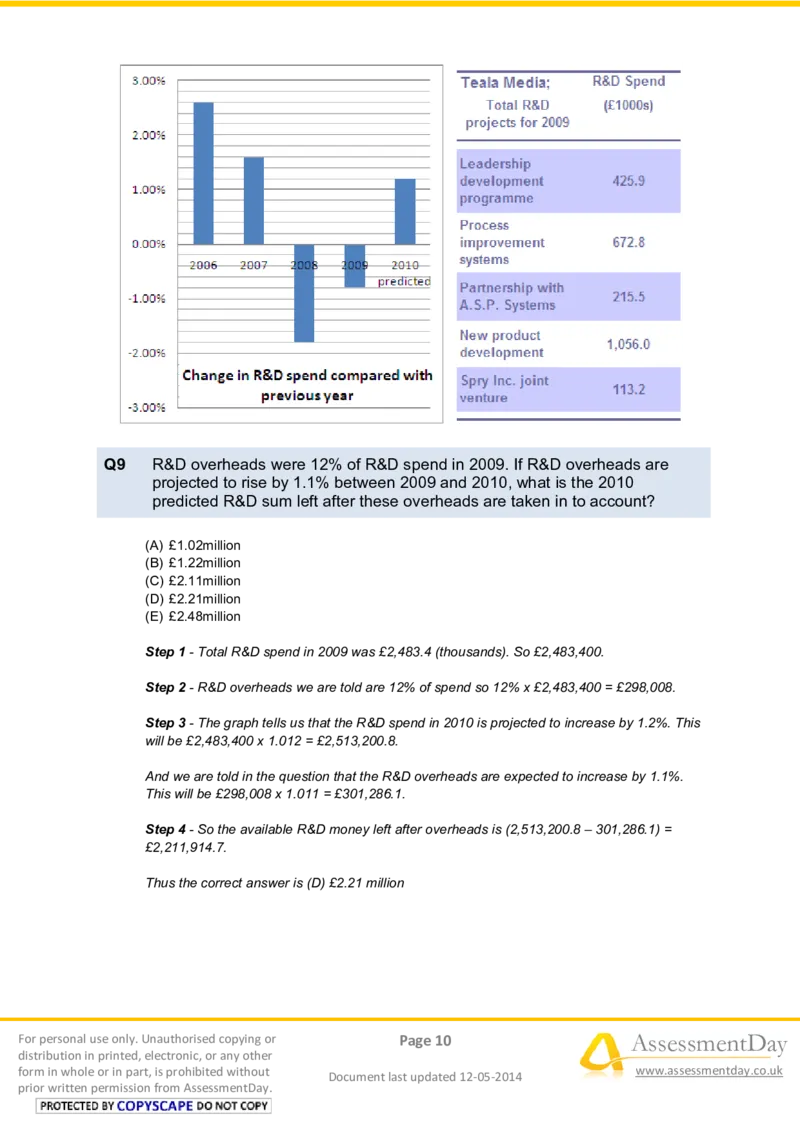
prior written permission from AssessmentDay.Q9 R&D overheads were 12% of R&D spend in 2009. If R&D overheads are
projected to rise by 1.1% between 2009 and 2010, what is the 2010
predicted R&D sum left after these overheads are taken in to account?
(A) £1.02million
(B) £1.22million
(C) £2.11million
(D) £2.21million
(E) £2.48million
Step 1 - Total R&D spend in 2009 was £2,483.4 (thousands). So £2,483,400.
Step 2 - R&D overheads we are told are 12% of spend so 12% x £2,483,400 = £298,008.
Step 3 - The graph tells us that the R&D spend in 2010 is projected to increase by 1.2%. This
will be £2,483,400 x 1.012 = £2,513,200.8.
And we are told in the question that the R&D overheads are expected to increase by 1.1%.
This will be £298,008 x 1.011 = £301,286.1.
Step 4 - So the available R&D money left after overheads is (2,513,200.8 – 301,286.1) =
£2,211,914.7.
Thus the correct answer is (D) £2.21 million
For personal use only. Unauthorised copying or Page 10 AssessmentDay
distribution in printed, electronic, or any other
form in whole or in part, is prohibited without
Document last updated 12-05-2014
www.assessmentday.co.uk
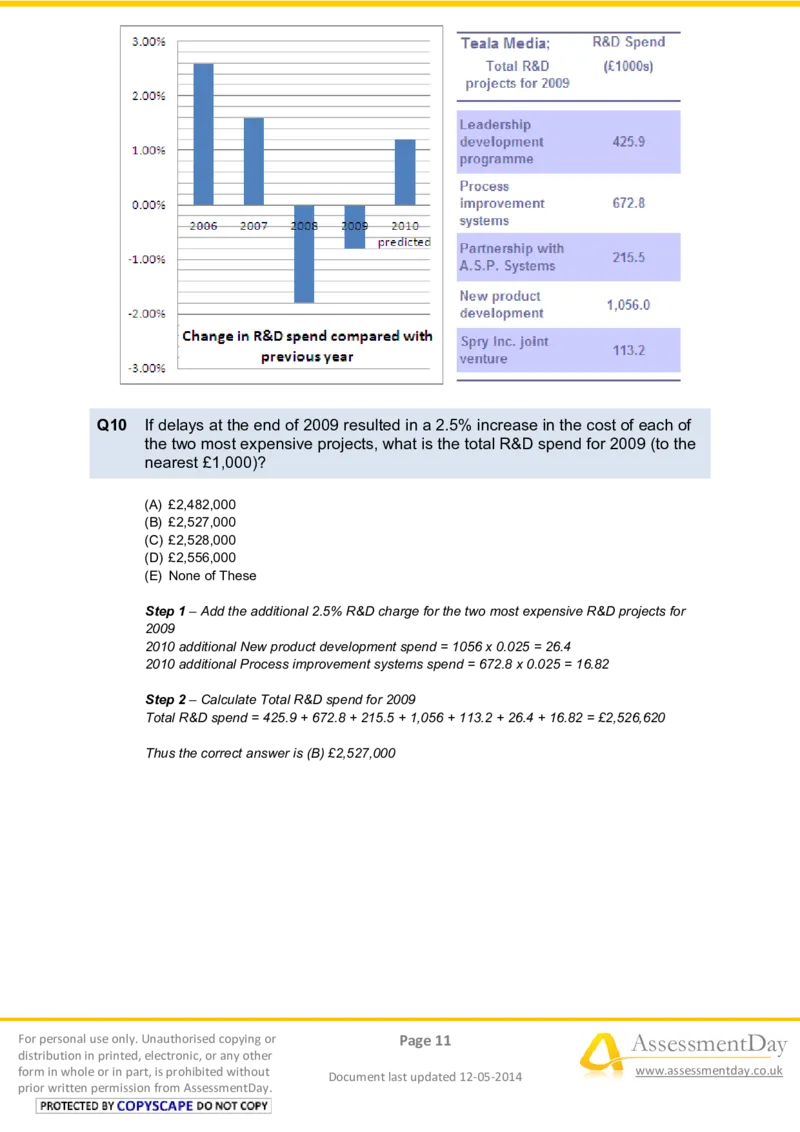
prior written permission from AssessmentDay.Q10 If delays at the end of 2009 resulted in a 2.5% increase in the cost of each of
the two most expensive projects, what is the total R&D spend for 2009 (to the
nearest £1,000)?
(A) £2,482,000
(B) £2,527,000
(C) £2,528,000
(D) £2,556,000
(E) None of These
Step 1 – Add the additional 2.5% R&D charge for the two most expensive R&D projects for
2009
2010 additional New product development spend = 1056 x 0.025 = 26.4
2010 additional Process improvement systems spend = 672.8 x 0.025 = 16.82
Step 2 – Calculate Total R&D spend for 2009
Total R&D spend = 425.9 + 672.8 + 215.5 + 1,056 + 113.2 + 26.4 + 16.82 = £2,526,620
Thus the correct answer is (B) £2,527,000
For personal use only. Unauthorised copying or Page 11 AssessmentDay
distribution in printed, electronic, or any other
form in whole or in part, is prohibited without
Document last updated 12-05-2014
www.assessmentday.co.uk
prior written permission from AssessmentDay.Q11 What is the number of shares not held by Directors of Leutts (as of 30 April
2009)?
(A) 25,620
(B) 6,850
(C) 43,500
(D) 4,880
(E) Cannot tell from data
The data you need is in both the pie-chart and the table.
Step 1 - The pie-chart shows that 16% of Directors hold shares, so 100 – 16 = 84% do not
hold shares
Step 2 - Calculate the total number of director shares at 30 April 2009
Director At 30 April 2009
Geoffrey Yates 1,050
Tobey Gilham 950
Susan Preddy 820
Samantha Hoxton 1,100
Trudy Stupples 960
Total = 4,880
For personal use only. Unauthorised copying or Page 12 AssessmentDay
distribution in printed, electronic, or any other
form in whole or in part, is prohibited without
Document last updated 12-05-2014
www.assessmentday.co.uk
prior written permission from AssessmentDay.Step 3 - Calculate 84%
16% = 4,880
84% = 4,880 x 84 / 16 = 25,620
Thus the correct answer is (A) 25,620.
For personal use only. Unauthorised copying or Page 13 AssessmentDay
distribution in printed, electronic, or any other
form in whole or in part, is prohibited without
Document last updated 12-05-2014
www.assessmentday.co.uk
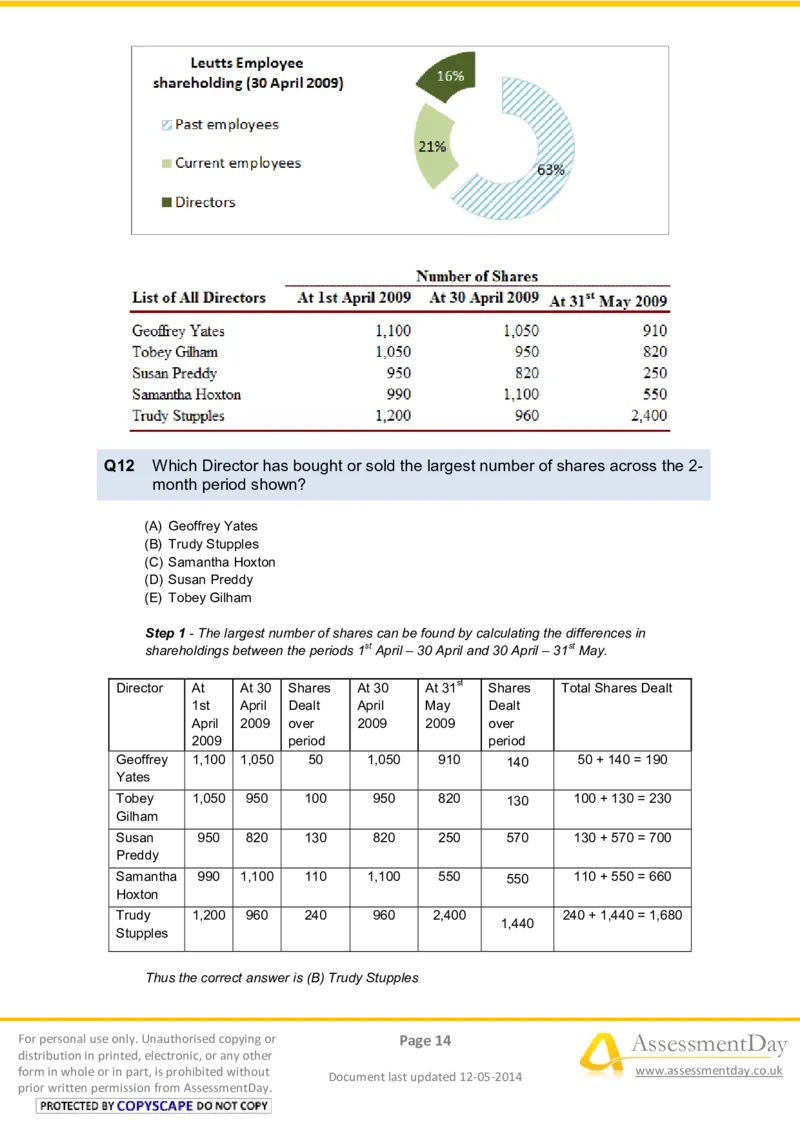
prior written permission from AssessmentDay.Q12 Which Director has bought or sold the largest number of shares across the 2-
month period shown?
(A) Geoffrey Yates
(B) Trudy Stupples
(C) Samantha Hoxton
(D) Susan Preddy
(E) Tobey Gilham
Step 1 - The largest number of shares can be found by calculating the differences in
shareholdings between the periods 1st April – 30 April and 30 April – 31st May.
Director At At 30 Shares At 30 At 31st Shares Total Shares Dealt
1st April Dealt April May Dealt
April 2009 over 2009 2009 over
2009 period period
Geoffrey 1,100 1,050 50 1,050 910 140 50 + 140 = 190
Yates
Tobey 1,050 950 100 950 820 130 100 + 130 = 230
Gilham
Susan 950 820 130 820 250 570 130 + 570 = 700
Preddy
Samantha 990 1,100 110 1,100 550 550 110 + 550 = 660
Hoxton
Trudy 1,200 960 240 960 2,400 240 + 1,440 = 1,680
1,440
Stupples
Thus the correct answer is (B) Trudy Stupples
For personal use only. Unauthorised copying or Page 14 AssessmentDay
distribution in printed, electronic, or any other
form in whole or in part, is prohibited without
Document last updated 12-05-2014
www.assessmentday.co.uk
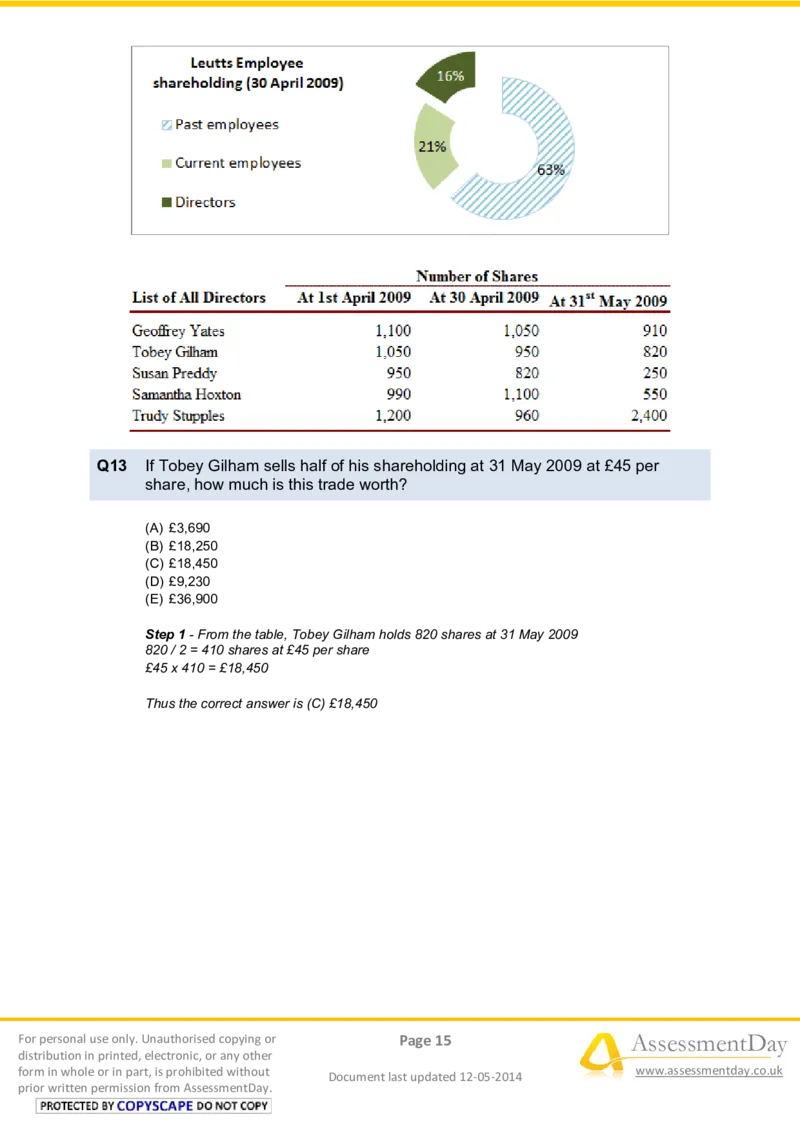
prior written permission from AssessmentDay.Q13 If Tobey Gilham sells half of his shareholding at 31 May 2009 at £45 per
share, how much is this trade worth?
(A) £3,690
(B) £18,250
(C) £18,450
(D) £9,230
(E) £36,900
Step 1 - From the table, Tobey Gilham holds 820 shares at 31 May 2009
820 / 2 = 410 shares at £45 per share
£45 x 410 = £18,450
Thus the correct answer is (C) £18,450
For personal use only. Unauthorised copying or Page 15 AssessmentDay
distribution in printed, electronic, or any other
form in whole or in part, is prohibited without
Document last updated 12-05-2014
www.assessmentday.co.uk
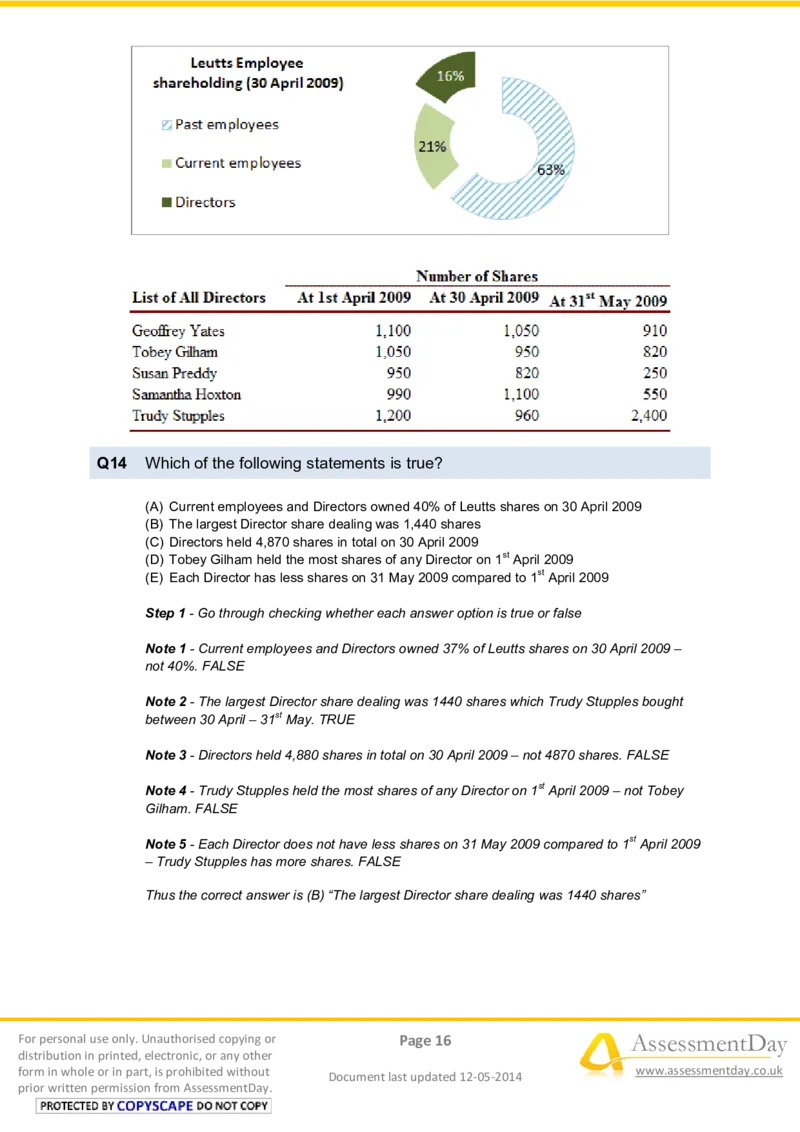
prior written permission from AssessmentDay.Q14 Which of the following statements is true?
(A) Current employees and Directors owned 40% of Leutts shares on 30 April 2009
(B) The largest Director share dealing was 1,440 shares
(C) Directors held 4,870 shares in total on 30 April 2009
(D) Tobey Gilham held the most shares of any Director on 1st April 2009
(E) Each Director has less shares on 31 May 2009 compared to 1st April 2009
Step 1 - Go through checking whether each answer option is true or false
Note 1 - Current employees and Directors owned 37% of Leutts shares on 30 April 2009 –
not 40%. FALSE
Note 2 - The largest Director share dealing was 1440 shares which Trudy Stupples bought
between 30 April – 31st May. TRUE
Note 3 - Directors held 4,880 shares in total on 30 April 2009 – not 4870 shares. FALSE
Note 4 - Trudy Stupples held the most shares of any Director on 1st April 2009 – not Tobey
Gilham. FALSE
Note 5 - Each Director does not have less shares on 31 May 2009 compared to 1st April 2009
– Trudy Stupples has more shares. FALSE
Thus the correct answer is (B) “The largest Director share dealing was 1440 shares”
For personal use only. Unauthorised copying or Page 16 AssessmentDay
distribution in printed, electronic, or any other
form in whole or in part, is prohibited without
Document last updated 12-05-2014
www.assessmentday.co.uk
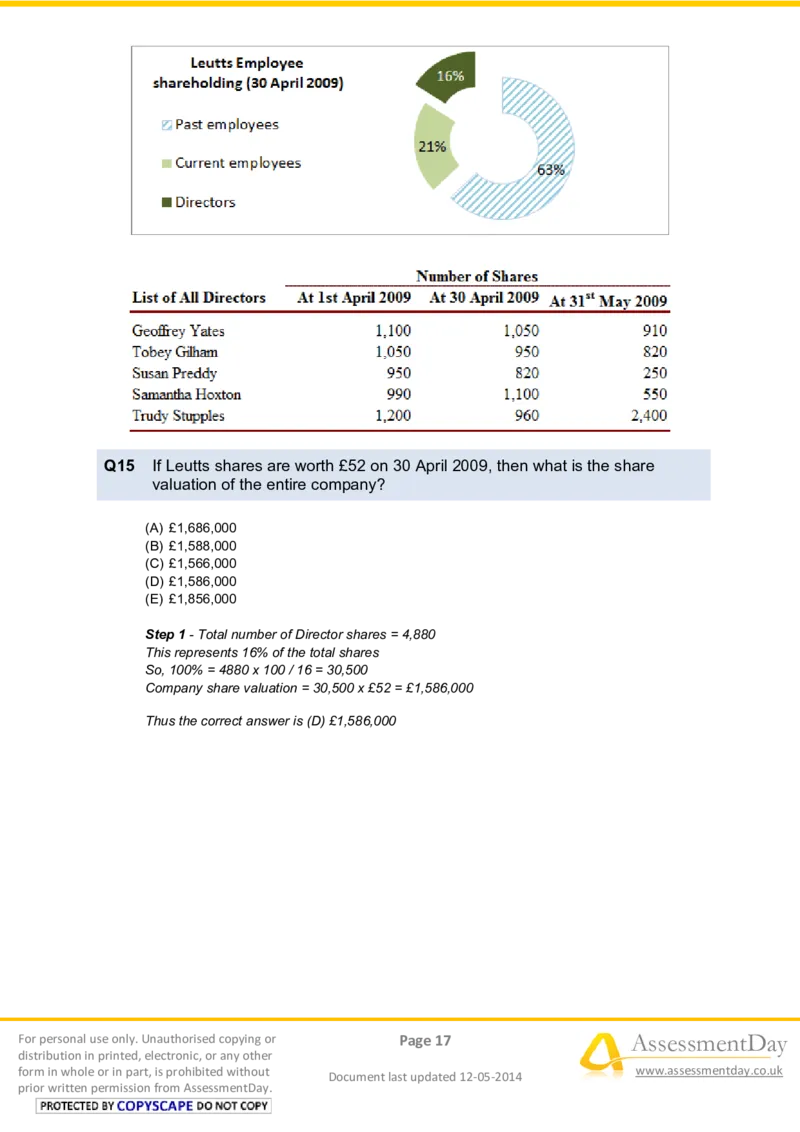
prior written permission from AssessmentDay.Q15 If Leutts shares are worth £52 on 30 April 2009, then what is the share
valuation of the entire company?
(A) £1,686,000
(B) £1,588,000
(C) £1,566,000
(D) £1,586,000
(E) £1,856,000
Step 1 - Total number of Director shares = 4,880
This represents 16% of the total shares
So, 100% = 4880 x 100 / 16 = 30,500
Company share valuation = 30,500 x £52 = £1,586,000
Thus the correct answer is (D) £1,586,000
For personal use only. Unauthorised copying or Page 17 AssessmentDay
distribution in printed, electronic, or any other
form in whole or in part, is prohibited without
Document last updated 12-05-2014
www.assessmentday.co.uk
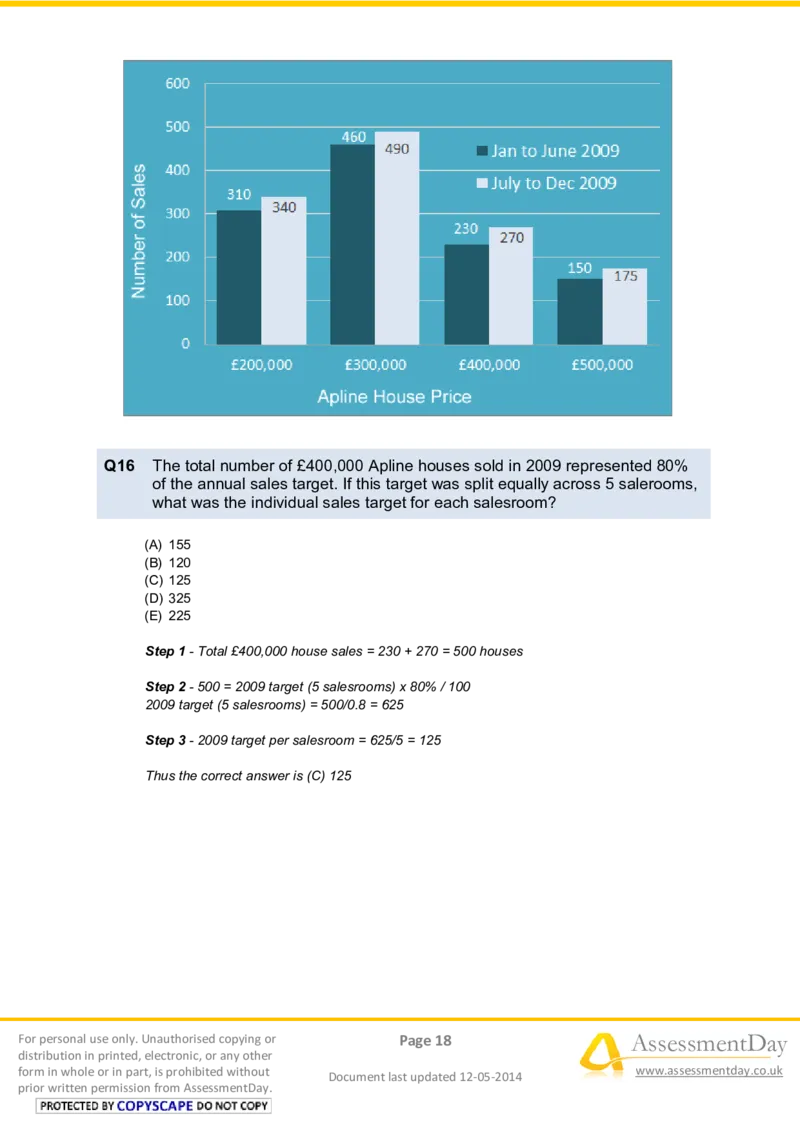
prior written permission from AssessmentDay.Q16 The total number of £400,000 Apline houses sold in 2009 represented 80%
of the annual sales target. If this target was split equally across 5 salerooms,
what was the individual sales target for each salesroom?
(A) 155
(B) 120
(C) 125
(D) 325
(E) 225
Step 1 - Total £400,000 house sales = 230 + 270 = 500 houses
Step 2 - 500 = 2009 target (5 salesrooms) x 80% / 100
2009 target (5 salesrooms) = 500/0.8 = 625
Step 3 - 2009 target per salesroom = 625/5 = 125
Thus the correct answer is (C) 125
For personal use only. Unauthorised copying or Page 18 AssessmentDay
distribution in printed, electronic, or any other
form in whole or in part, is prohibited without
Document last updated 12-05-2014
www.assessmentday.co.uk
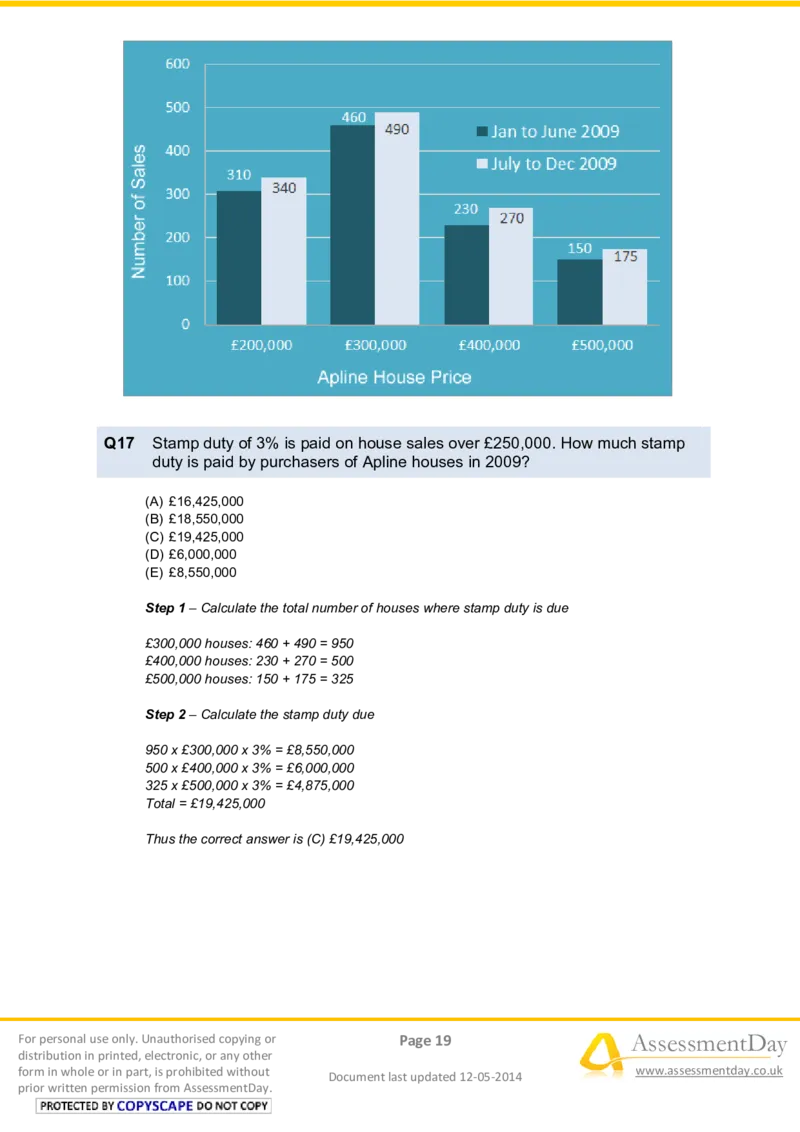
prior written permission from AssessmentDay.Q17 Stamp duty of 3% is paid on house sales over £250,000. How much stamp
duty is paid by purchasers of Apline houses in 2009?
(A) £16,425,000
(B) £18,550,000
(C) £19,425,000
(D) £6,000,000
(E) £8,550,000
Step 1 – Calculate the total number of houses where stamp duty is due
£300,000 houses: 460 + 490 = 950
£400,000 houses: 230 + 270 = 500
£500,000 houses: 150 + 175 = 325
Step 2 – Calculate the stamp duty due
950 x £300,000 x 3% = £8,550,000
500 x £400,000 x 3% = £6,000,000
325 x £500,000 x 3% = £4,875,000
Total = £19,425,000
Thus the correct answer is (C) £19,425,000
For personal use only. Unauthorised copying or Page 19 AssessmentDay
distribution in printed, electronic, or any other
form in whole or in part, is prohibited without
Document last updated 12-05-2014
www.assessmentday.co.uk
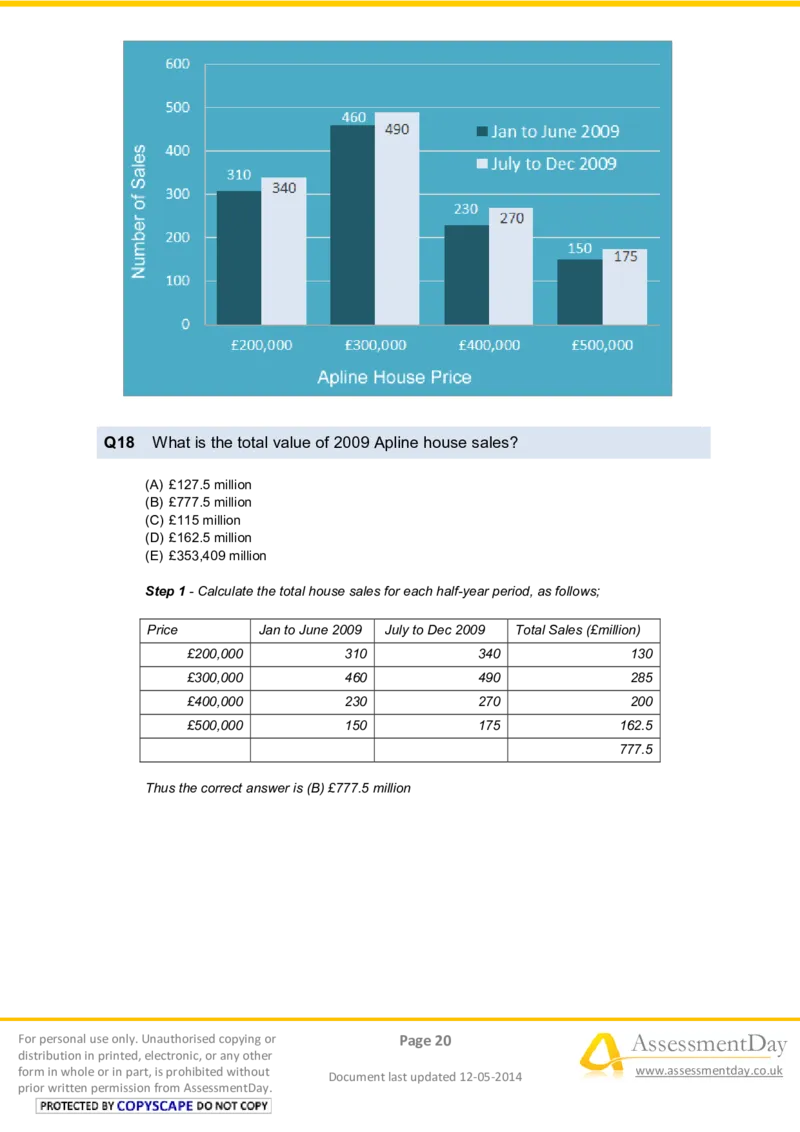
prior written permission from AssessmentDay.Q18 What is the total value of 2009 Apline house sales?
(A) £127.5 million
(B) £777.5 million
(C) £115 million
(D) £162.5 million
(E) £353,409 million
Step 1 - Calculate the total house sales for each half-year period, as follows;
Price Jan to June 2009 July to Dec 2009 Total Sales (£million)
£200,000 310 340 130
£300,000 460 490 285
£400,000 230 270 200
£500,000 150 175 162.5
777.5
Thus the correct answer is (B) £777.5 million
For personal use only. Unauthorised copying or Page 20 AssessmentDay
distribution in printed, electronic, or any other
form in whole or in part, is prohibited without
Document last updated 12-05-2014
www.assessmentday.co.uk
prior written permission from AssessmentDay.Q19 In 2010, the absolute difference in Apline house sales between 2009’s July-
Dec and Jan-June periods is expected to increase by a fifth. What is the
projected difference in Apline house sales between July-Dec and Jan-June
for 2010 (in £million)?
(A) 43.5
(B) 52.2
(C) 100
(D) 125
(E) 125.5
Step 1 - Calculate the difference for 2009, as follows;
Jan to June July to Dec Difference Difference
2009 2009 (houses sold) (£million)
£200,000 310 340 30 6
£300,000 460 490 30 9
£400,000 230 270 40 16
£500,000 150 175 25 12.5
125 43.5
Step 2 – Add the increase of a fifth
43.5 x 1.2 = £52.2 million
Thus the correct answer is (B) 52.2.
For personal use only. Unauthorised copying or Page 21 AssessmentDay
distribution in printed, electronic, or any other
form in whole or in part, is prohibited without
Document last updated 12-05-2014
www.assessmentday.co.uk
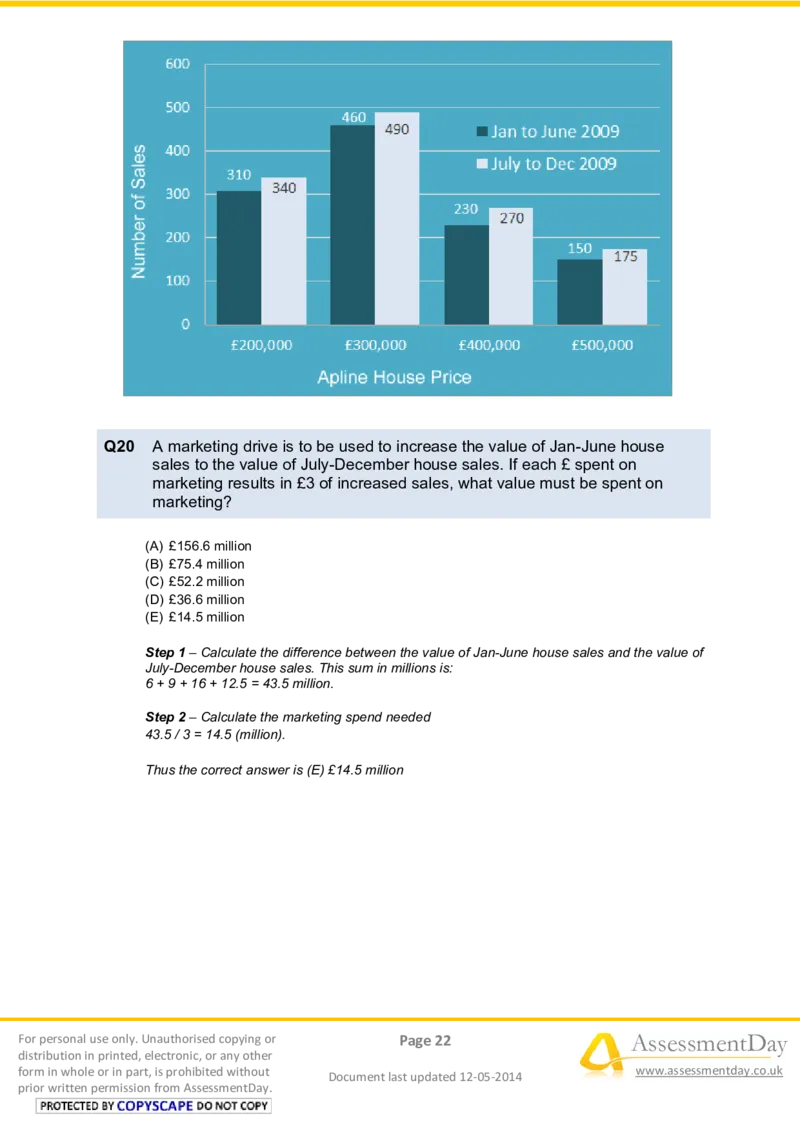
prior written permission from AssessmentDay.Q20 A marketing drive is to be used to increase the value of Jan-June house
sales to the value of July-December house sales. If each £ spent on
marketing results in £3 of increased sales, what value must be spent on
marketing?
(A) £156.6 million
(B) £75.4 million
(C) £52.2 million
(D) £36.6 million
(E) £14.5 million
Step 1 – Calculate the difference between the value of Jan-June house sales and the value of
July-December house sales. This sum in millions is:
6 + 9 + 16 + 12.5 = 43.5 million.
Step 2 – Calculate the marketing spend needed
43.5 / 3 = 14.5 (million).
Thus the correct answer is (E) £14.5 million
For personal use only. Unauthorised copying or Page 22 AssessmentDay
distribution in printed, electronic, or any other
form in whole or in part, is prohibited without
Document last updated 12-05-2014
www.assessmentday.co.uk
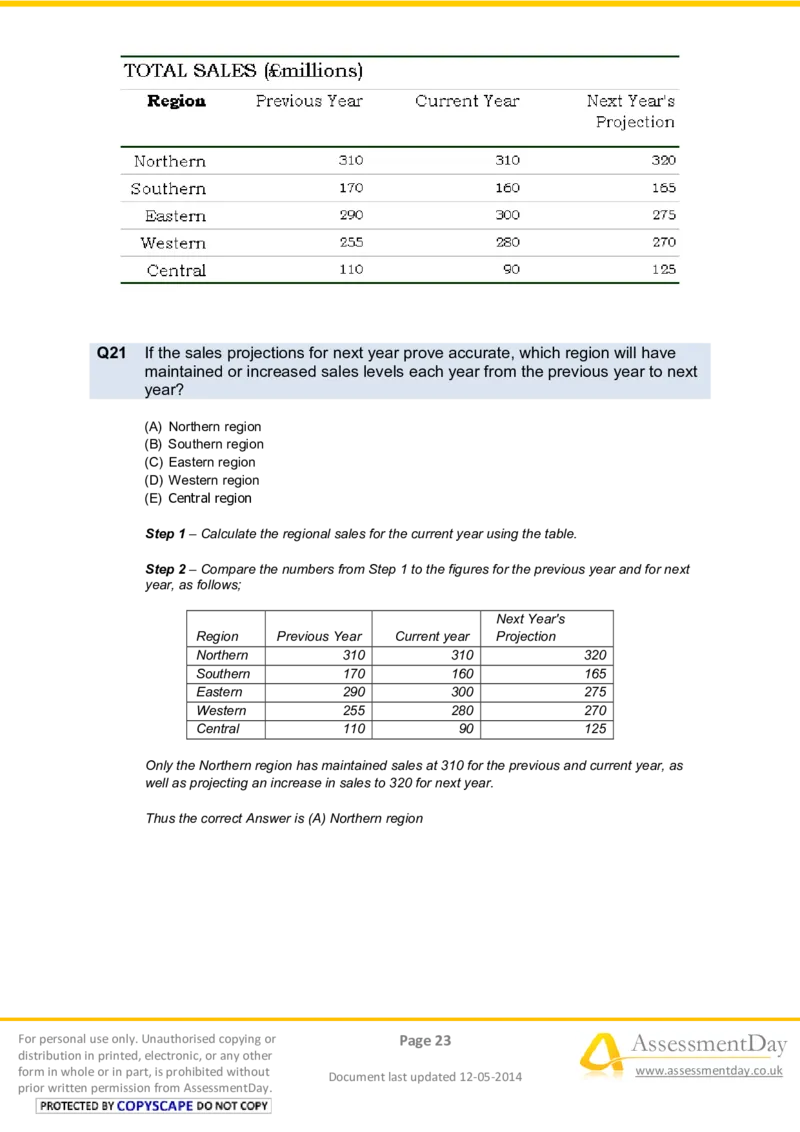
prior written permission from AssessmentDay.Q21 If the sales projections for next year prove accurate, which region will have
maintained or increased sales levels each year from the previous year to next
year?
(A) Northern region
(B) Southern region
(C) Eastern region
(D) Western region
(E) Central region
Step 1 – Calculate the regional sales for the current year using the table.
Step 2 – Compare the numbers from Step 1 to the figures for the previous year and for next
year, as follows;
Next Year's
Region Previous Year Current year Projection
Northern 310 310 320
Southern 170 160 165
Eastern 290 300 275
Western 255 280 270
Central 110 90 125
Only the Northern region has maintained sales at 310 for the previous and current year, as
well as projecting an increase in sales to 320 for next year.
Thus the correct Answer is (A) Northern region
For personal use only. Unauthorised copying or Page 23 AssessmentDay
distribution in printed, electronic, or any other
form in whole or in part, is prohibited without
Document last updated 12-05-2014
www.assessmentday.co.uk
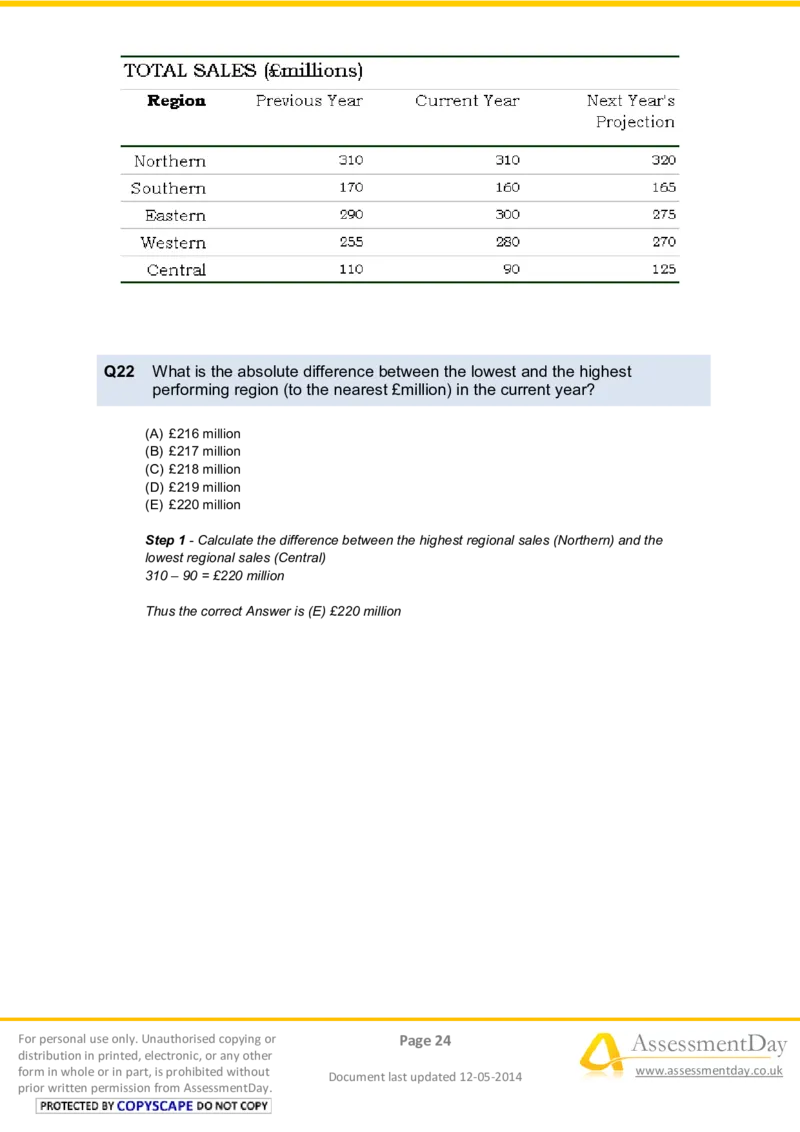
prior written permission from AssessmentDay.Q22 What is the absolute difference between the lowest and the highest
performing region (to the nearest £million) in the current year?
(A) £216 million
(B) £217 million
(C) £218 million
(D) £219 million
(E) £220 million
Step 1 - Calculate the difference between the highest regional sales (Northern) and the
lowest regional sales (Central)
310 – 90 = £220 million
Thus the correct Answer is (E) £220 million
For personal use only. Unauthorised copying or Page 24 AssessmentDay
distribution in printed, electronic, or any other
form in whole or in part, is prohibited without
Document last updated 12-05-2014
www.assessmentday.co.uk
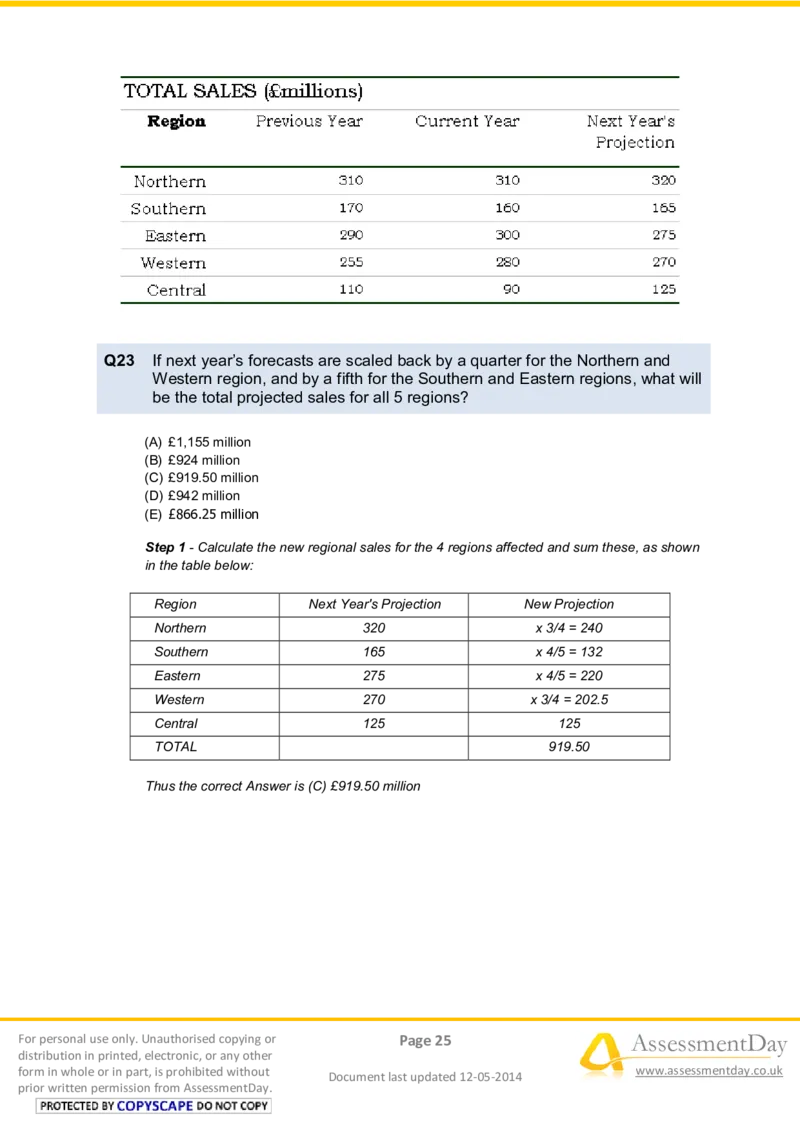
prior written permission from AssessmentDay.Q23 If next year’s forecasts are scaled back by a quarter for the Northern and
Western region, and by a fifth for the Southern and Eastern regions, what will
be the total projected sales for all 5 regions?
(A) £1,155 million
(B) £924 million
(C) £919.50 million
(D) £942 million
(E) £866.25 million
Step 1 - Calculate the new regional sales for the 4 regions affected and sum these, as shown
in the table below:
Region Next Year's Projection New Projection
Northern 320 x 3/4 = 240
Southern 165 x 4/5 = 132
Eastern 275 x 4/5 = 220
Western 270 x 3/4 = 202.5
Central 125 125
TOTAL 919.50
Thus the correct Answer is (C) £919.50 million
For personal use only. Unauthorised copying or Page 25 AssessmentDay
distribution in printed, electronic, or any other
form in whole or in part, is prohibited without
Document last updated 12-05-2014
www.assessmentday.co.uk
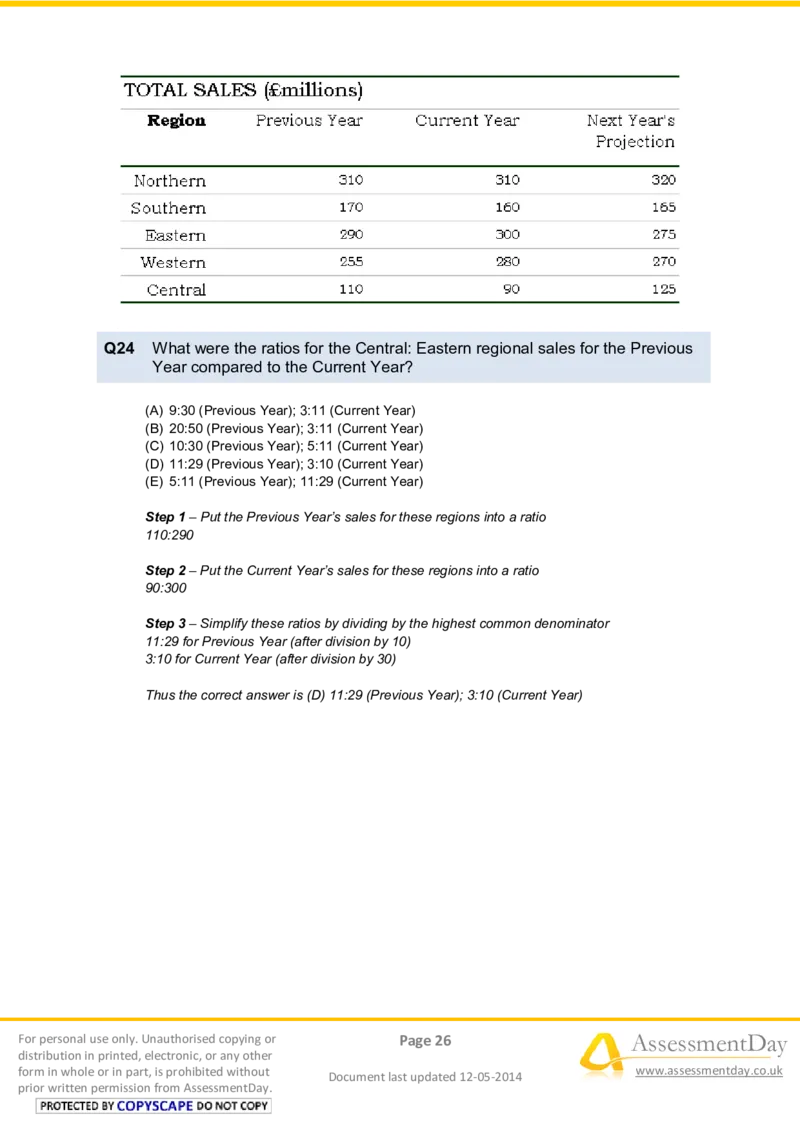
prior written permission from AssessmentDay.Q24 What were the ratios for the Central: Eastern regional sales for the Previous
Year compared to the Current Year?
(A) 9:30 (Previous Year); 3:11 (Current Year)
(B) 20:50 (Previous Year); 3:11 (Current Year)
(C) 10:30 (Previous Year); 5:11 (Current Year)
(D) 11:29 (Previous Year); 3:10 (Current Year)
(E) 5:11 (Previous Year); 11:29 (Current Year)
Step 1 – Put the Previous Year’s sales for these regions into a ratio
110:290
Step 2 – Put the Current Year’s sales for these regions into a ratio
90:300
Step 3 – Simplify these ratios by dividing by the highest common denominator
11:29 for Previous Year (after division by 10)
3:10 for Current Year (after division by 30)
Thus the correct answer is (D) 11:29 (Previous Year); 3:10 (Current Year)
For personal use only. Unauthorised copying or Page 26 AssessmentDay
distribution in printed, electronic, or any other
form in whole or in part, is prohibited without
Document last updated 12-05-2014
www.assessmentday.co.uk
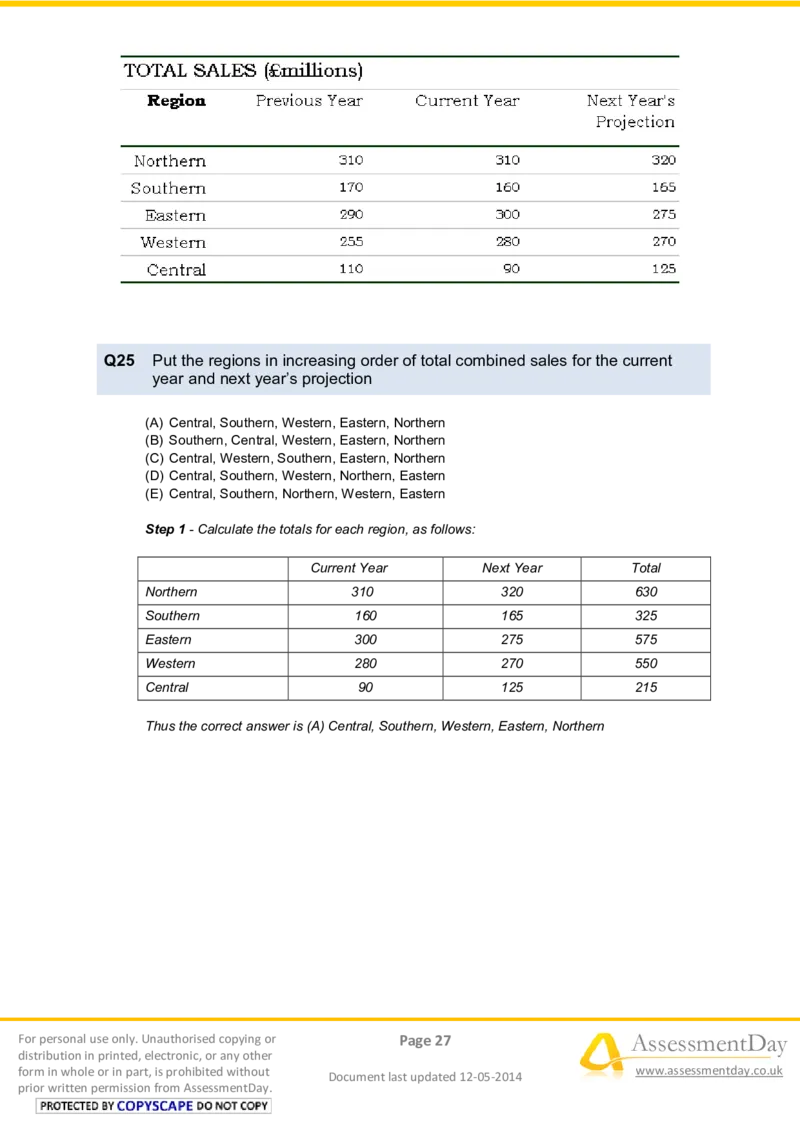
prior written permission from AssessmentDay.Q25 Put the regions in increasing order of total combined sales for the current
year and next year’s projection
(A) Central, Southern, Western, Eastern, Northern
(B) Southern, Central, Western, Eastern, Northern
(C) Central, Western, Southern, Eastern, Northern
(D) Central, Southern, Western, Northern, Eastern
(E) Central, Southern, Northern, Western, Eastern
Step 1 - Calculate the totals for each region, as follows:
Current Year Next Year Total
Northern 310 320 630
Southern 160 165 325
Eastern 300 275 575
Western 280 270 550
Central 90 125 215
Thus the correct answer is (A) Central, Southern, Western, Eastern, Northern
For personal use only. Unauthorised copying or Page 27 AssessmentDay
distribution in printed, electronic, or any other
form in whole or in part, is prohibited without
Document last updated 12-05-2014
www.assessmentday.co.uk
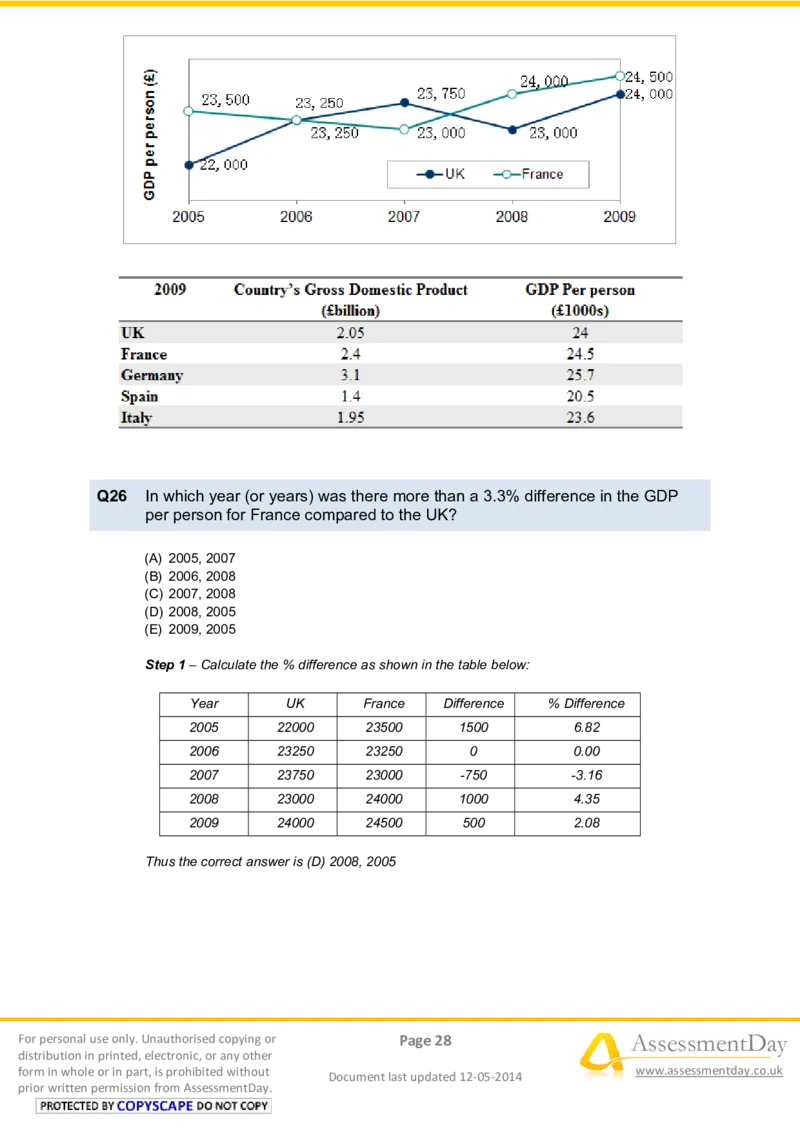
prior written permission from AssessmentDay.Q26 In which year (or years) was there more than a 3.3% difference in the GDP
per person for France compared to the UK?
(A) 2005, 2007
(B) 2006, 2008
(C) 2007, 2008
(D) 2008, 2005
(E) 2009, 2005
Step 1 – Calculate the % difference as shown in the table below:
Year UK France Difference % Difference
2005 22000 23500 1500 6.82
2006 23250 23250 0 0.00
2007 23750 23000 -750 -3.16
2008 23000 24000 1000 4.35
2009 24000 24500 500 2.08
Thus the correct answer is (D) 2008, 2005
For personal use only. Unauthorised copying or Page 28 AssessmentDay
distribution in printed, electronic, or any other
form in whole or in part, is prohibited without
Document last updated 12-05-2014
www.assessmentday.co.uk
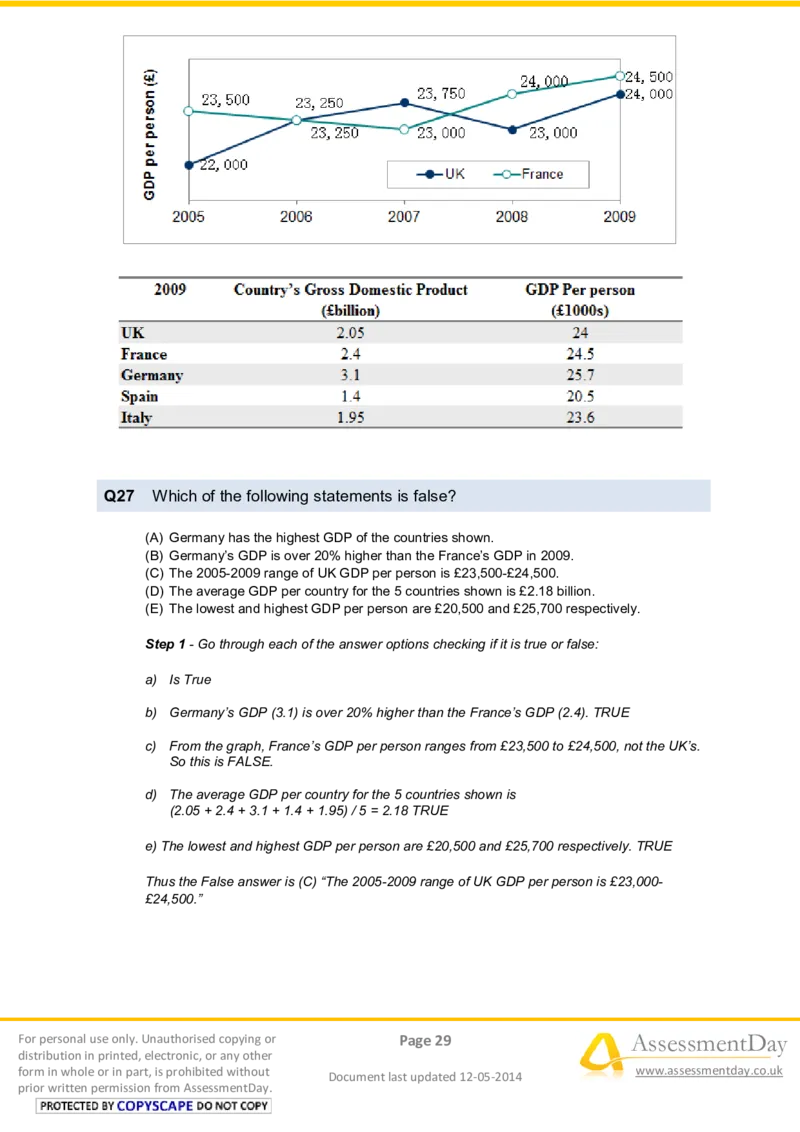
prior written permission from AssessmentDay.Q27 Which of the following statements is false?
(A) Germany has the highest GDP of the countries shown.
(B) Germany’s GDP is over 20% higher than the France’s GDP in 2009.
(C) The 2005-2009 range of UK GDP per person is £23,500-£24,500.
(D) The average GDP per country for the 5 countries shown is £2.18 billion.
(E) The lowest and highest GDP per person are £20,500 and £25,700 respectively.
Step 1 - Go through each of the answer options checking if it is true or false:
a) Is True
b) Germany’s GDP (3.1) is over 20% higher than the France’s GDP (2.4). TRUE
c) From the graph, France’s GDP per person ranges from £23,500 to £24,500, not the UK’s.
So this is FALSE.
d) The average GDP per country for the 5 countries shown is
(2.05 + 2.4 + 3.1 + 1.4 + 1.95) / 5 = 2.18 TRUE
e) The lowest and highest GDP per person are £20,500 and £25,700 respectively. TRUE
Thus the False answer is (C) “The 2005-2009 range of UK GDP per person is £23,000-
£24,500.”
For personal use only. Unauthorised copying or Page 29 AssessmentDay
distribution in printed, electronic, or any other
form in whole or in part, is prohibited without
Document last updated 12-05-2014
www.assessmentday.co.uk
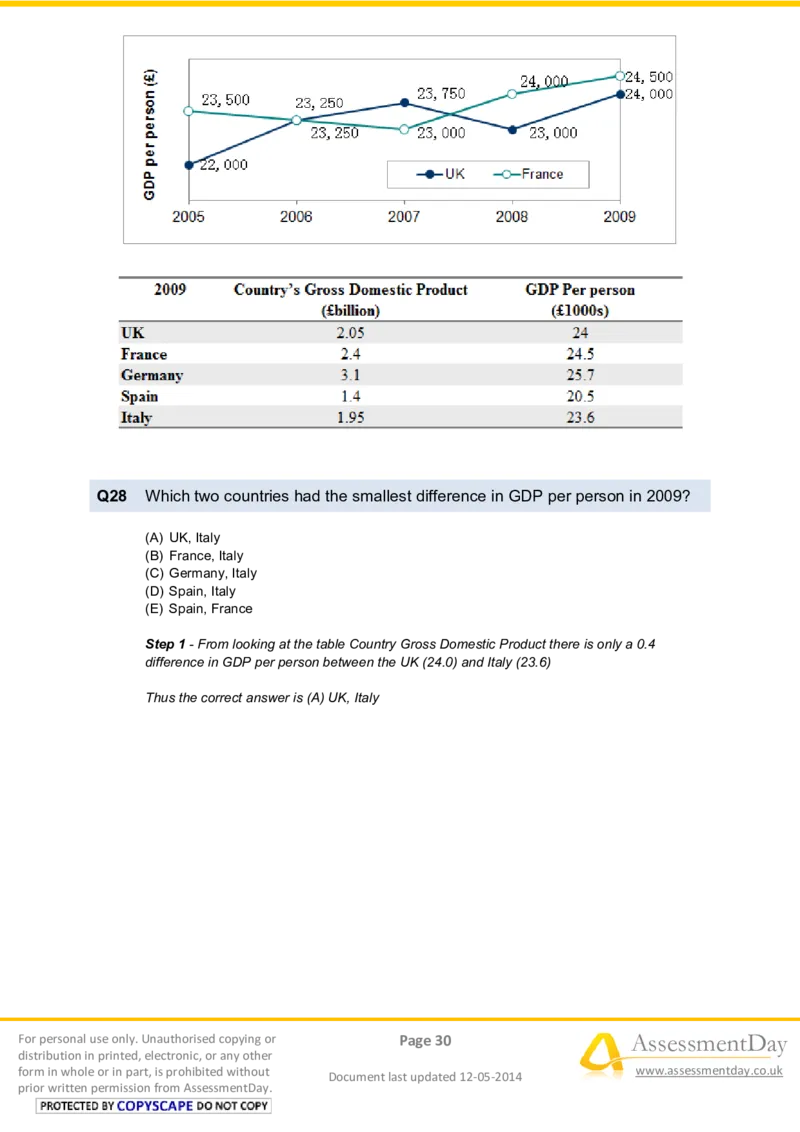
prior written permission from AssessmentDay.Q28 Which two countries had the smallest difference in GDP per person in 2009?
(A) UK, Italy
(B) France, Italy
(C) Germany, Italy
(D) Spain, Italy
(E) Spain, France
Step 1 - From looking at the table Country Gross Domestic Product there is only a 0.4
difference in GDP per person between the UK (24.0) and Italy (23.6)
Thus the correct answer is (A) UK, Italy
For personal use only. Unauthorised copying or Page 30 AssessmentDay
distribution in printed, electronic, or any other
form in whole or in part, is prohibited without
Document last updated 12-05-2014
www.assessmentday.co.uk
prior written permission from AssessmentDay.Q29 Between which years were the GDPs per person increasing in both France
and the UK?
(A) 2008-2009
(B) 2007-2008
(C) 2006-2007
(D) 2005-2006
(E) Cannot tell from data
Step 1 - Look at the direction of the lines representing the UK and France (on the line graph).
For both the France and the UK to be increasing the lines need to both be pointing upwards.
This is only true for 2008-2009.
Thus the correct answer is (A) 2008-2009
For personal use only. Unauthorised copying or Page 31 AssessmentDay
distribution in printed, electronic, or any other
form in whole or in part, is prohibited without
Document last updated 12-05-2014
www.assessmentday.co.uk
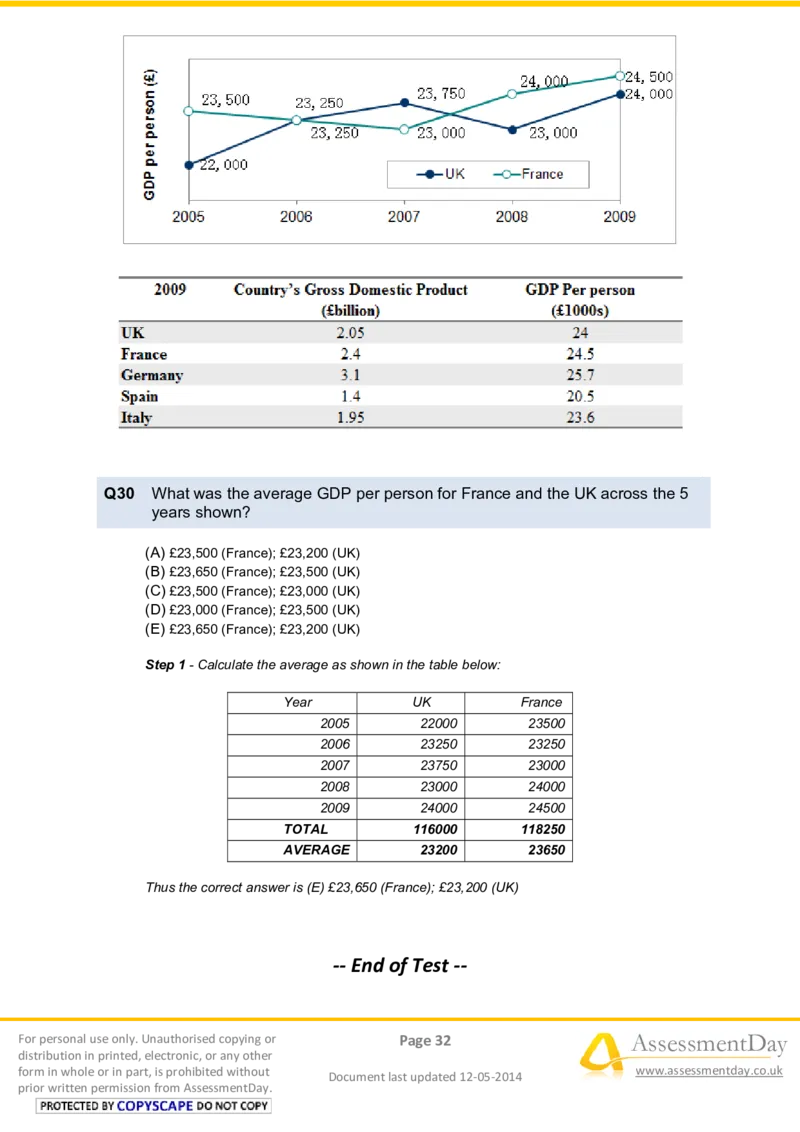
prior written permission from AssessmentDay.Q30 What was the average GDP per person for France and the UK across the 5
years shown?
(A) £23,500 (France); £23,200 (UK)
(B) £23,650 (France); £23,500 (UK)
(C) £23,500 (France); £23,000 (UK)
(D) £23,000 (France); £23,500 (UK)
(E) £23,650 (France); £23,200 (UK)
Step 1 - Calculate the average as shown in the table below:
Year UK France
2005 22000 23500
2006 23250 23250
2007 23750 23000
2008 23000 24000
2009 24000 24500
TOTAL 116000 118250
AVERAGE 23200 23650
Thus the correct answer is (E) £23,650 (France); £23,200 (UK)
-- End of Test --
For personal use only. Unauthorised copying or Page 32 AssessmentDay
distribution in printed, electronic, or any other
form in whole or in part, is prohibited without
Document last updated 12-05-2014
www.assessmentday.co.uk
prior written permission from AssessmentDay.
