文档内容
Numerical Test 4
Solutions Booklet
Instructions
This numerical reasoning test comprises 30 questions, and you will have 30 minutes in
which to correctly answer as many as you can. Calculators are permitted for this test, and it is
recommended you have some rough paper to work on.
You will have to work quickly and accurately to perform well in this test. If you don't know the
answer to a question, leave it and come back to it if you have time. Each question will have
five possible answers, one of which is correct. You may click Back and Next during the test to
review or skip questions.
You can submit your test at any time. If the time limit is up before you click submit the test will
automatically be submitted with the answers you have selected. It is recommended to keep
working until the time limit is up.
Try to find a time and place where you will not be interrupted during the test. The test will
begin on the next page.
AssessmentDay
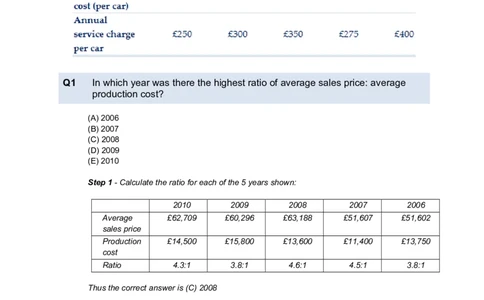
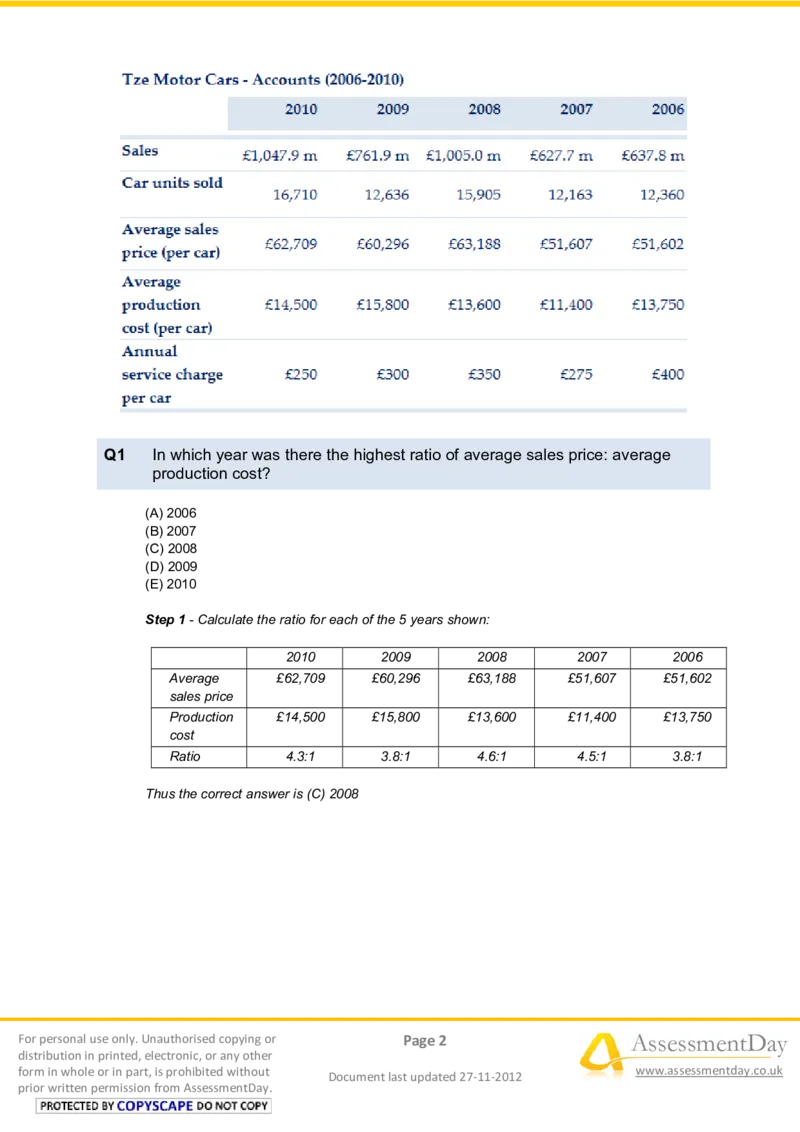
Practice Aptitude TestsQ1 In which year was there the highest ratio of average sales price: average
production cost?
(A) 2006
(B) 2007
(C) 2008
(D) 2009
(E) 2010
Step 1 - Calculate the ratio for each of the 5 years shown:
2010 2009 2008 2007 2006
Average £62,709 £60,296 £63,188 £51,607 £51,602
sales price
Production £14,500 £15,800 £13,600 £11,400 £13,750
cost
Ratio 4.3:1 3.8:1 4.6:1 4.5:1 3.8:1
Thus the correct answer is (C) 2008
For personal use only. Unauthorised copying or Page 2 AssessmentDay
distribution in printed, electronic, or any other
form in whole or in part, is prohibited without
Document last updated 27-11-2012
www.assessmentday.co.uk
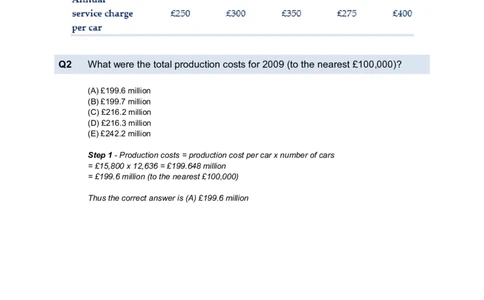
prior written permission from AssessmentDay.Q2 What were the total production costs for 2009 (to the nearest £100,000)?
(A) £199.6 million
(B) £199.7 million
(C) £216.2 million
(D) £216.3 million
(E) £242.2 million
Step 1 - Production costs = production cost per car x number of cars
= £15,800 x 12,636 = £199.648 million
= £199.6 million (to the nearest £100,000)
Thus the correct answer is (A) £199.6 million
For personal use only. Unauthorised copying or Page 3 AssessmentDay
distribution in printed, electronic, or any other
form in whole or in part, is prohibited without
Document last updated 27-11-2012
www.assessmentday.co.uk
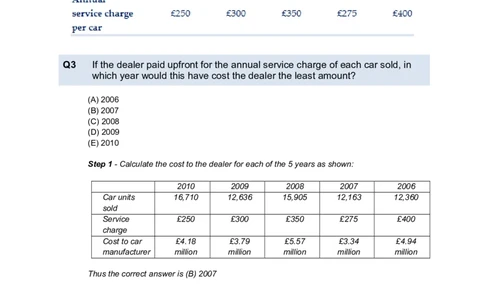
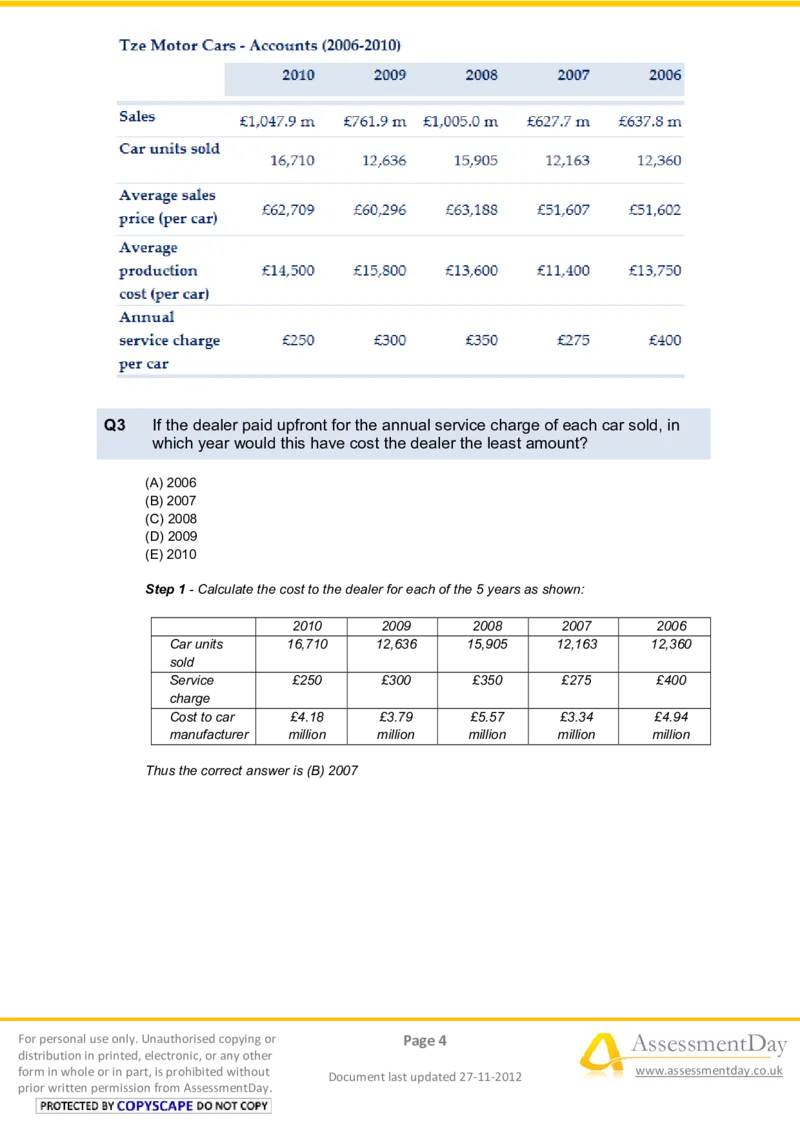
prior written permission from AssessmentDay.Q3 If the dealer paid upfront for the annual service charge of each car sold, in
which year would this have cost the dealer the least amount?
(A) 2006
(B) 2007
(C) 2008
(D) 2009
(E) 2010
Step 1 - Calculate the cost to the dealer for each of the 5 years as shown:
2010 2009 2008 2007 2006
Car units 16,710 12,636 15,905 12,163 12,360
sold
Service £250 £300 £350 £275 £400
charge
Cost to car £4.18 £3.79 £5.57 £3.34 £4.94
manufacturer million million million million million
Thus the correct answer is (B) 2007
For personal use only. Unauthorised copying or Page 4 AssessmentDay
distribution in printed, electronic, or any other
form in whole or in part, is prohibited without
Document last updated 27-11-2012
www.assessmentday.co.uk
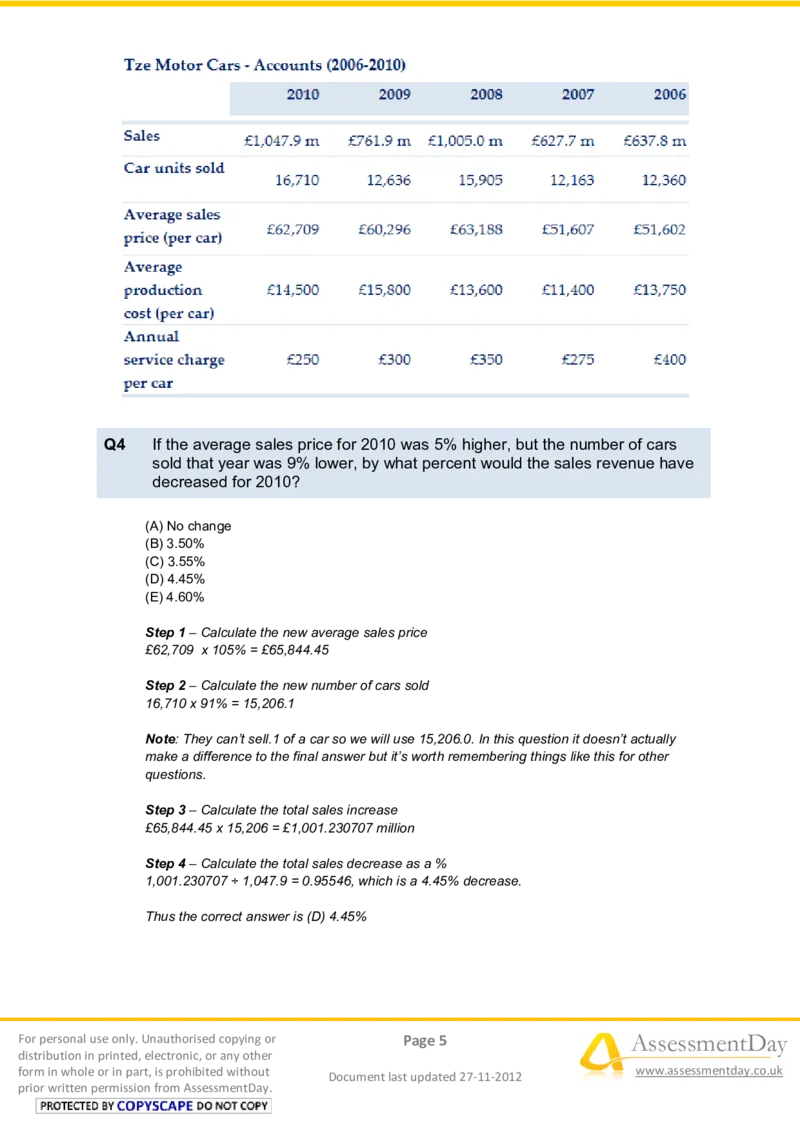
prior written permission from AssessmentDay.Q4 If the average sales price for 2010 was 5% higher, but the number of cars
sold that year was 9% lower, by what percent would the sales revenue have
decreased for 2010?
(A) No change
(B) 3.50%
(C) 3.55%
(D) 4.45%
(E) 4.60%
Step 1 – Calculate the new average sales price
£62,709 x 105% = £65,844.45
Step 2 – Calculate the new number of cars sold
16,710 x 91% = 15,206.1
Note: They can’t sell.1 of a car so we will use 15,206.0. In this question it doesn’t actually
make a difference to the final answer but it’s worth remembering things like this for other
questions.
Step 3 – Calculate the total sales increase
£65,844.45 x 15,206 = £1,001.230707 million
Step 4 – Calculate the total sales decrease as a %
1,001.230707 ÷ 1,047.9 = 0.95546, which is a 4.45% decrease.
Thus the correct answer is (D) 4.45%
For personal use only. Unauthorised copying or Page 5 AssessmentDay
distribution in printed, electronic, or any other
form in whole or in part, is prohibited without
Document last updated 27-11-2012
www.assessmentday.co.uk
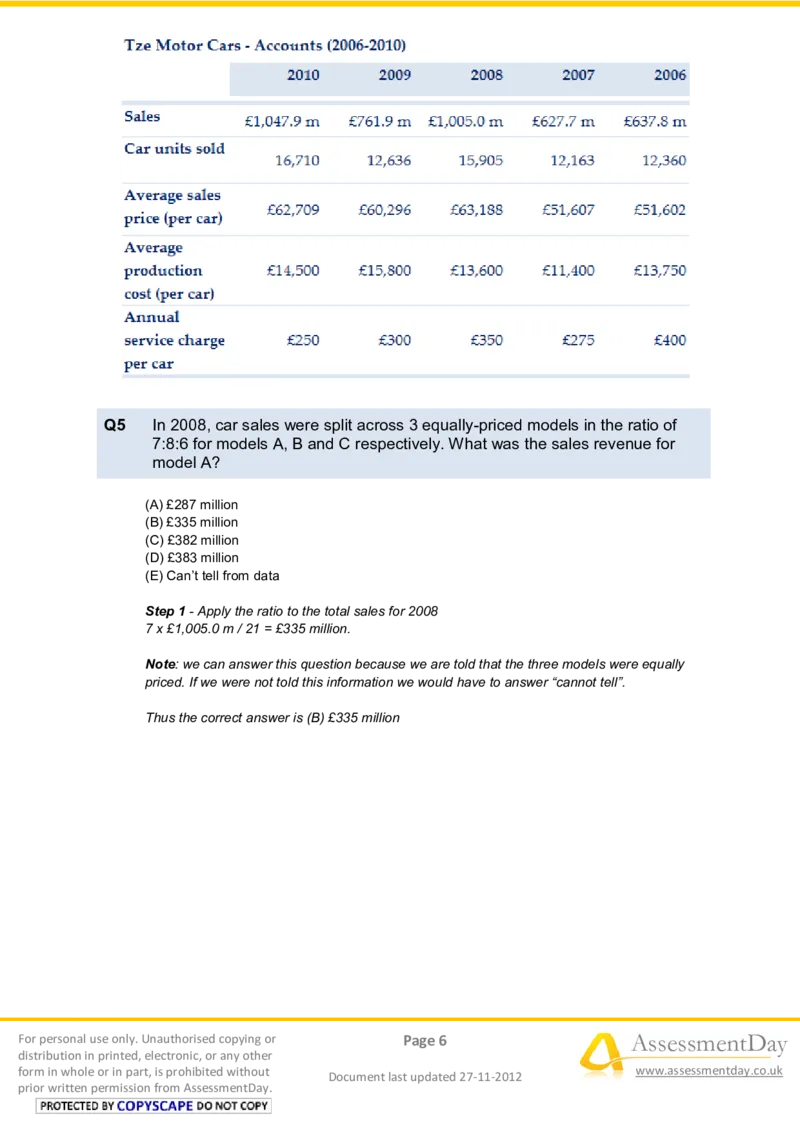
prior written permission from AssessmentDay.Q5 In 2008, car sales were split across 3 equally-priced models in the ratio of
7:8:6 for models A, B and C respectively. What was the sales revenue for
model A?
(A) £287 million
(B) £335 million
(C) £382 million
(D) £383 million
(E) Can’t tell from data
Step 1 - Apply the ratio to the total sales for 2008
7 x £1,005.0 m / 21 = £335 million.
Note: we can answer this question because we are told that the three models were equally
priced. If we were not told this information we would have to answer “cannot tell”.
Thus the correct answer is (B) £335 million
For personal use only. Unauthorised copying or Page 6 AssessmentDay
distribution in printed, electronic, or any other
form in whole or in part, is prohibited without
Document last updated 27-11-2012
www.assessmentday.co.uk
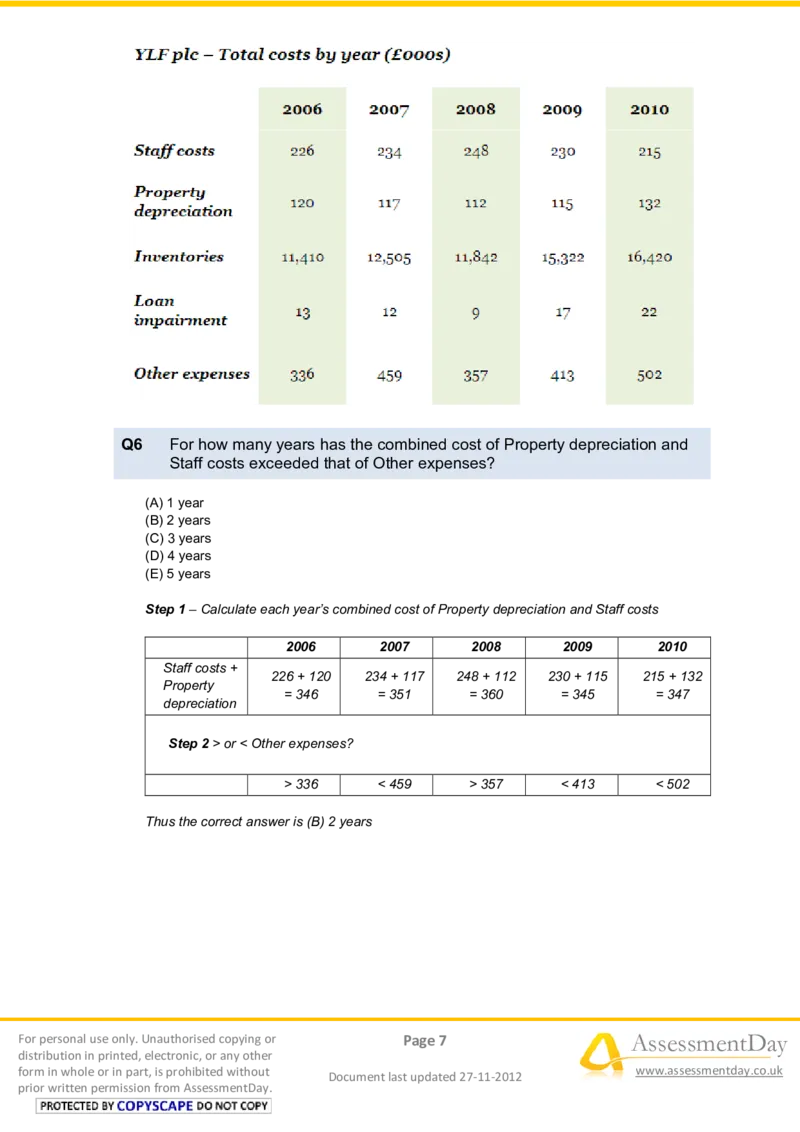
prior written permission from AssessmentDay.Q6 For how many years has the combined cost of Property depreciation and
Staff costs exceeded that of Other expenses?
(A) 1 year
(B) 2 years
(C) 3 years
(D) 4 years
(E) 5 years
Step 1 – Calculate each year’s combined cost of Property depreciation and Staff costs
2006 2007 2008 2009 2010
Staff costs +
226 + 120 234 + 117 248 + 112 230 + 115 215 + 132
Property
= 346 = 351 = 360 = 345 = 347
depreciation
Step 2 > or < Other expenses?
> 336 < 459 > 357 < 413 < 502
Thus the correct answer is (B) 2 years
For personal use only. Unauthorised copying or Page 7 AssessmentDay
distribution in printed, electronic, or any other
form in whole or in part, is prohibited without
Document last updated 27-11-2012
www.assessmentday.co.uk
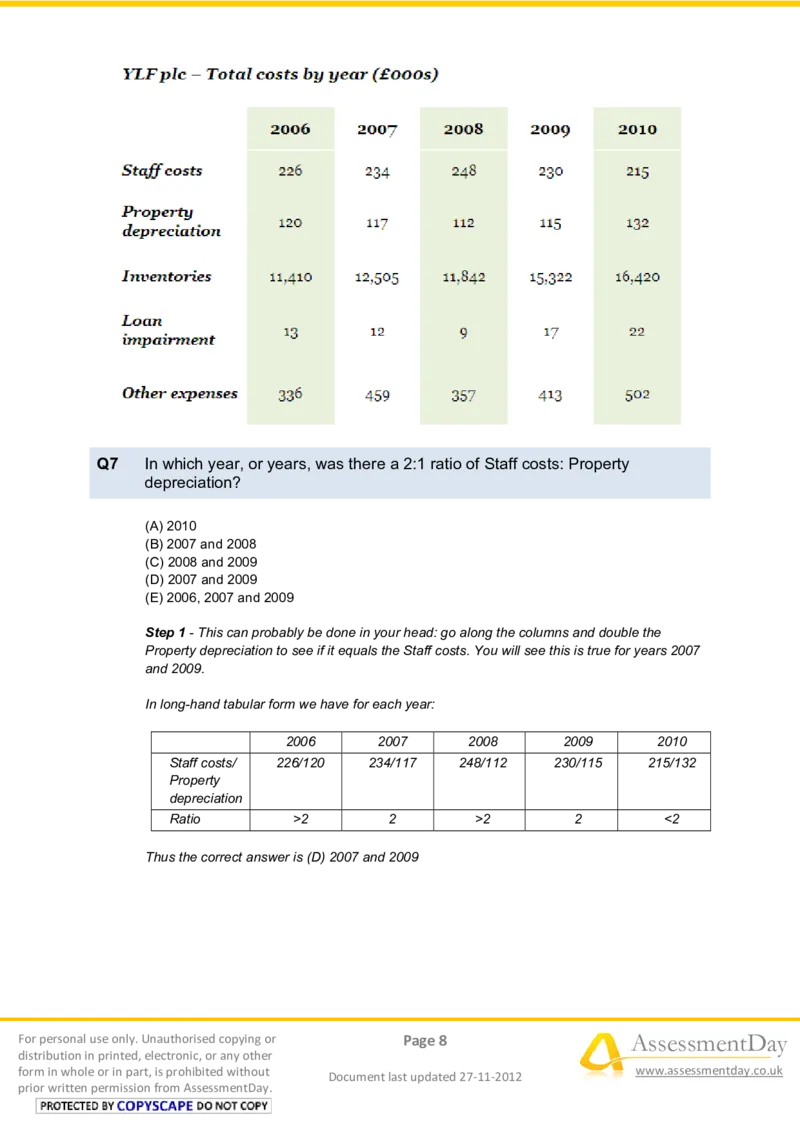
prior written permission from AssessmentDay.Q7 In which year, or years, was there a 2:1 ratio of Staff costs: Property
depreciation?
(A) 2010
(B) 2007 and 2008
(C) 2008 and 2009
(D) 2007 and 2009
(E) 2006, 2007 and 2009
Step 1 - This can probably be done in your head: go along the columns and double the
Property depreciation to see if it equals the Staff costs. You will see this is true for years 2007
and 2009.
In long-hand tabular form we have for each year:
2006 2007 2008 2009 2010
Staff costs/ 226/120 234/117 248/112 230/115 215/132
Property
depreciation
Ratio >2 2 >2 2 <2
Thus the correct answer is (D) 2007 and 2009
For personal use only. Unauthorised copying or Page 8 AssessmentDay
distribution in printed, electronic, or any other
form in whole or in part, is prohibited without
Document last updated 27-11-2012
www.assessmentday.co.uk
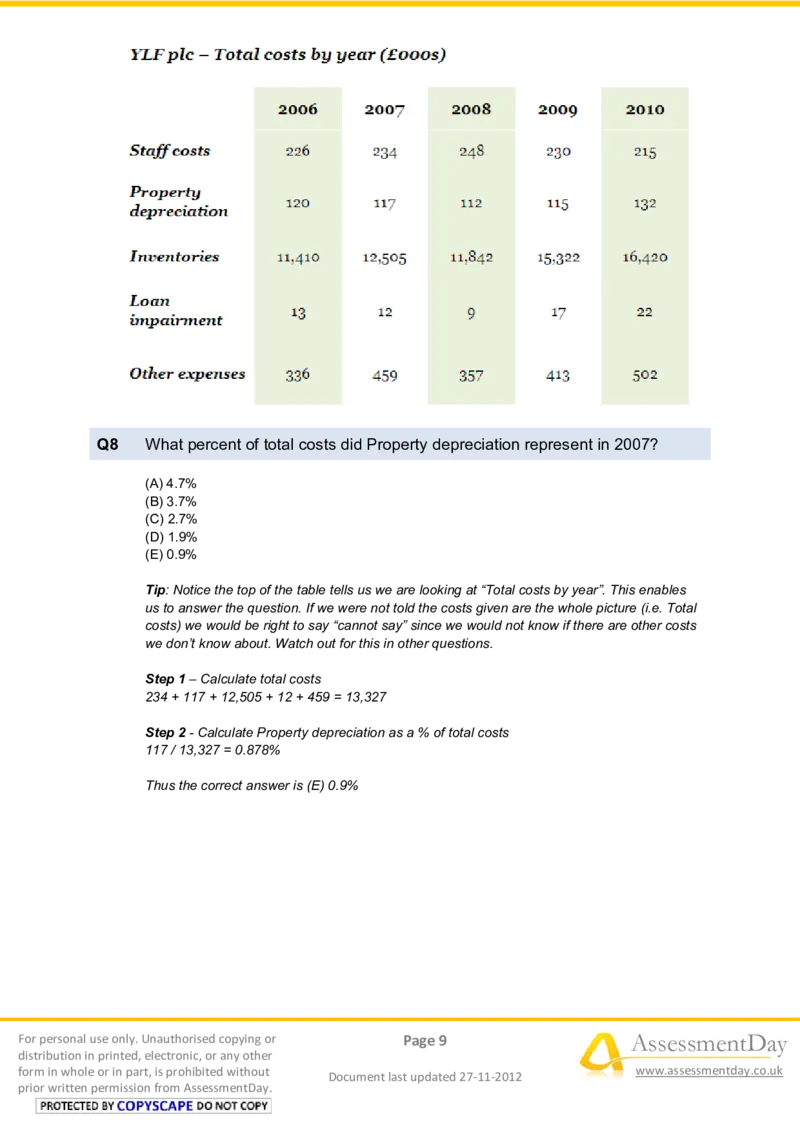
prior written permission from AssessmentDay.Q8 What percent of total costs did Property depreciation represent in 2007?
(A) 4.7%
(B) 3.7%
(C) 2.7%
(D) 1.9%
(E) 0.9%
Tip: Notice the top of the table tells us we are looking at “Total costs by year”. This enables
us to answer the question. If we were not told the costs given are the whole picture (i.e. Total
costs) we would be right to say “cannot say” since we would not know if there are other costs
we don’t know about. Watch out for this in other questions.
Step 1 – Calculate total costs
234 + 117 + 12,505 + 12 + 459 = 13,327
Step 2 - Calculate Property depreciation as a % of total costs
117 / 13,327 = 0.878%
Thus the correct answer is (E) 0.9%
For personal use only. Unauthorised copying or Page 9 AssessmentDay
distribution in printed, electronic, or any other
form in whole or in part, is prohibited without
Document last updated 27-11-2012
www.assessmentday.co.uk
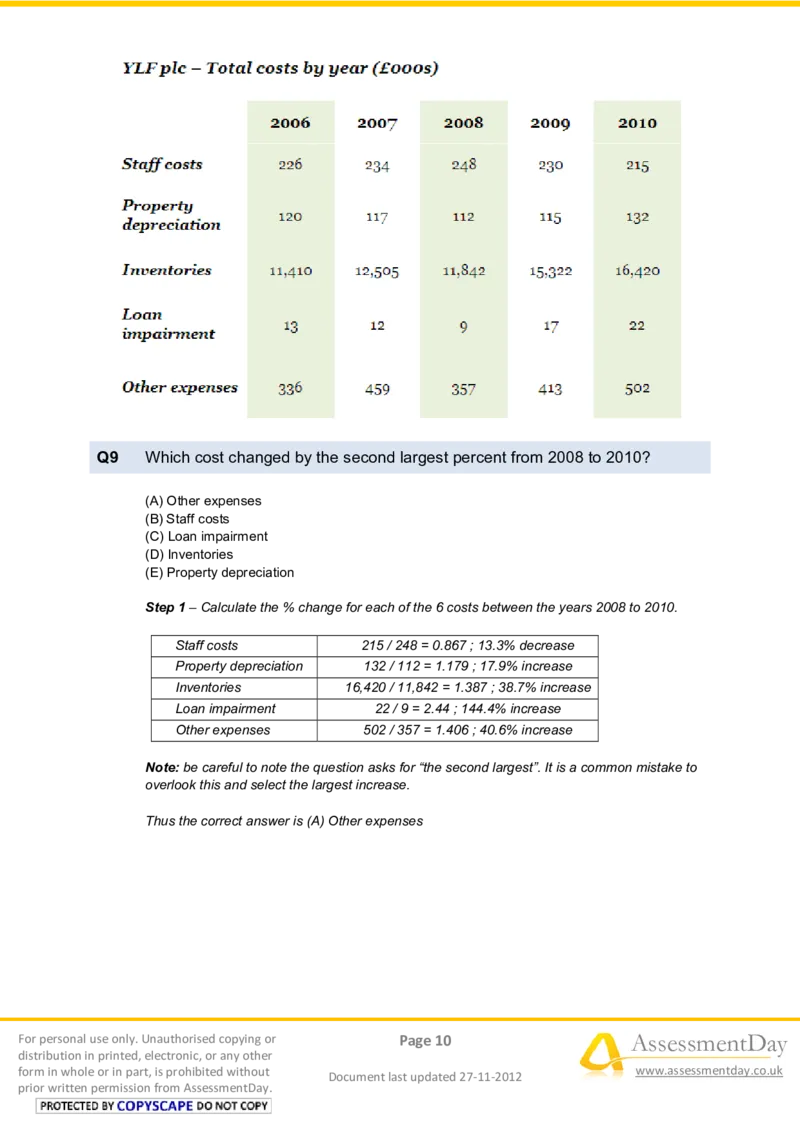
prior written permission from AssessmentDay.Q9 Which cost changed by the second largest percent from 2008 to 2010?
(A) Other expenses
(B) Staff costs
(C) Loan impairment
(D) Inventories
(E) Property depreciation
Step 1 – Calculate the % change for each of the 6 costs between the years 2008 to 2010.
Staff costs 215 / 248 = 0.867 ; 13.3% decrease
Property depreciation 132 / 112 = 1.179 ; 17.9% increase
Inventories 16,420 / 11,842 = 1.387 ; 38.7% increase
Loan impairment 22 / 9 = 2.44 ; 144.4% increase
Other expenses 502 / 357 = 1.406 ; 40.6% increase
Note: be careful to note the question asks for “the second largest”. It is a common mistake to
overlook this and select the largest increase.
Thus the correct answer is (A) Other expenses
For personal use only. Unauthorised copying or Page 10 AssessmentDay
distribution in printed, electronic, or any other
form in whole or in part, is prohibited without
Document last updated 27-11-2012
www.assessmentday.co.uk
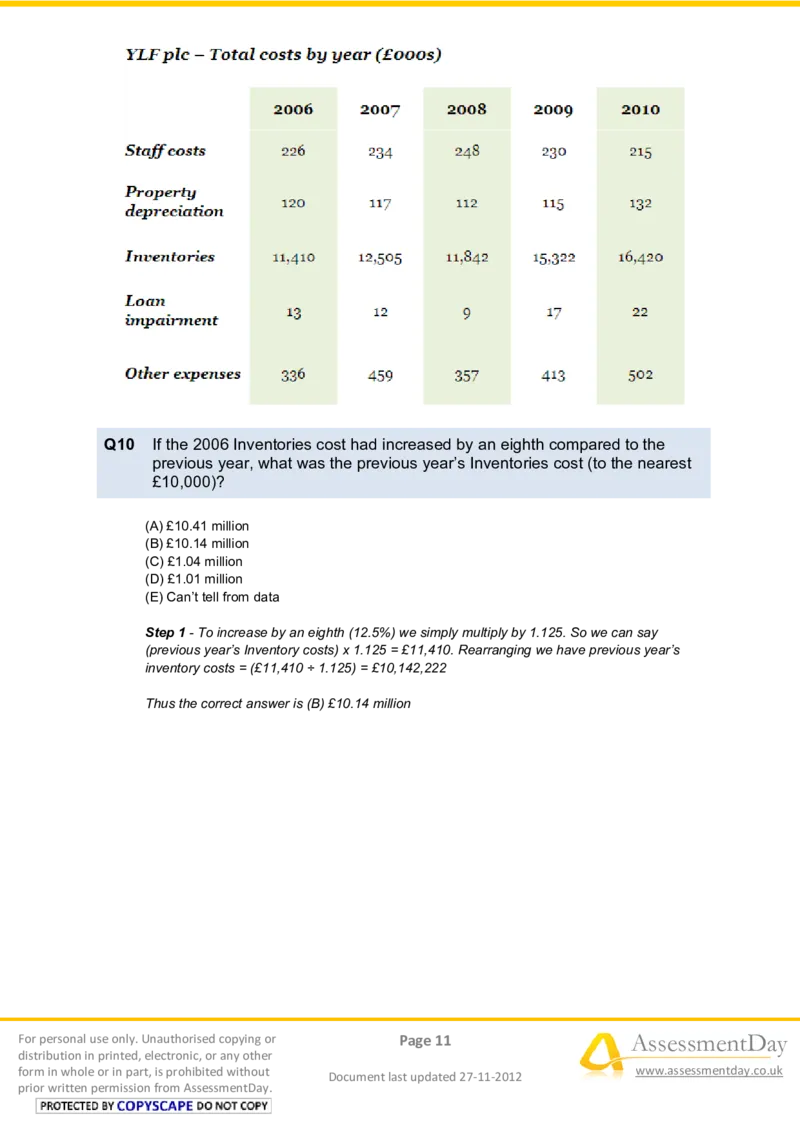
prior written permission from AssessmentDay.Q10 If the 2006 Inventories cost had increased by an eighth compared to the
previous year, what was the previous year’s Inventories cost (to the nearest
£10,000)?
(A) £10.41 million
(B) £10.14 million
(C) £1.04 million
(D) £1.01 million
(E) Can’t tell from data
Step 1 - To increase by an eighth (12.5%) we simply multiply by 1.125. So we can say
(previous year’s Inventory costs) x 1.125 = £11,410. Rearranging we have previous year’s
inventory costs = (£11,410 ÷ 1.125) = £10,142,222
Thus the correct answer is (B) £10.14 million
For personal use only. Unauthorised copying or Page 11 AssessmentDay
distribution in printed, electronic, or any other
form in whole or in part, is prohibited without
Document last updated 27-11-2012
www.assessmentday.co.uk
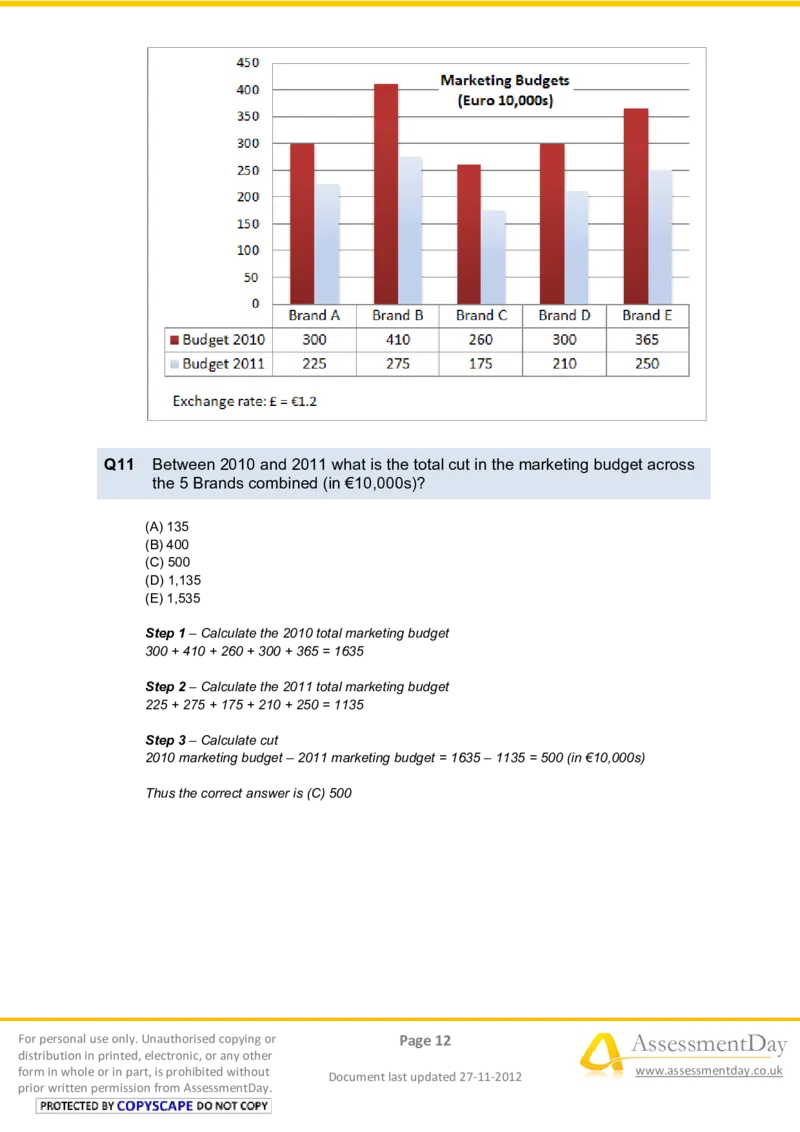
prior written permission from AssessmentDay.Q11 Between 2010 and 2011 what is the total cut in the marketing budget across
the 5 Brands combined (in €10,000s)?
(A) 135
(B) 400
(C) 500
(D) 1,135
(E) 1,535
Step 1 – Calculate the 2010 total marketing budget
300 + 410 + 260 + 300 + 365 = 1635
Step 2 – Calculate the 2011 total marketing budget
225 + 275 + 175 + 210 + 250 = 1135
Step 3 – Calculate cut
2010 marketing budget – 2011 marketing budget = 1635 – 1135 = 500 (in €10,000s)
Thus the correct answer is (C) 500
For personal use only. Unauthorised copying or Page 12 AssessmentDay
distribution in printed, electronic, or any other
form in whole or in part, is prohibited without
Document last updated 27-11-2012
www.assessmentday.co.uk
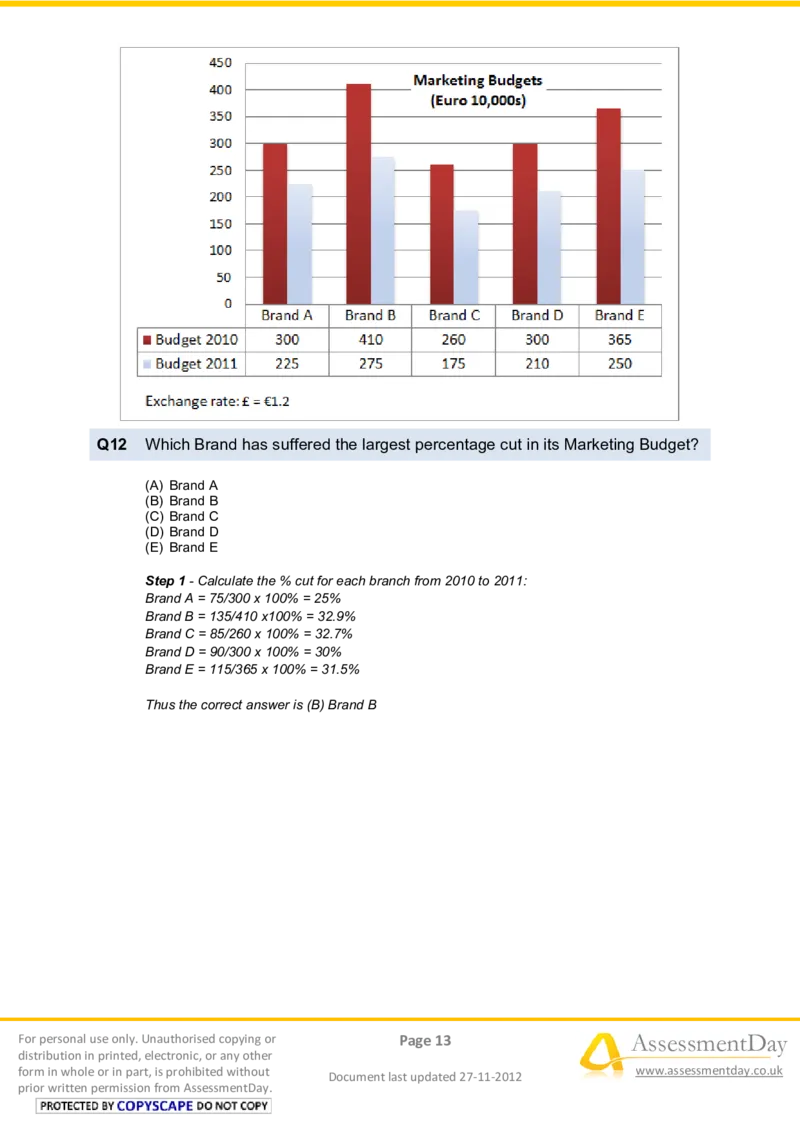
prior written permission from AssessmentDay.Q12 Which Brand has suffered the largest percentage cut in its Marketing Budget?
(A) Brand A
(B) Brand B
(C) Brand C
(D) Brand D
(E) Brand E
Step 1 - Calculate the % cut for each branch from 2010 to 2011:
Brand A = 75/300 x 100% = 25%
Brand B = 135/410 x100% = 32.9%
Brand C = 85/260 x 100% = 32.7%
Brand D = 90/300 x 100% = 30%
Brand E = 115/365 x 100% = 31.5%
Thus the correct answer is (B) Brand B
For personal use only. Unauthorised copying or Page 13 AssessmentDay
distribution in printed, electronic, or any other
form in whole or in part, is prohibited without
Document last updated 27-11-2012
www.assessmentday.co.uk
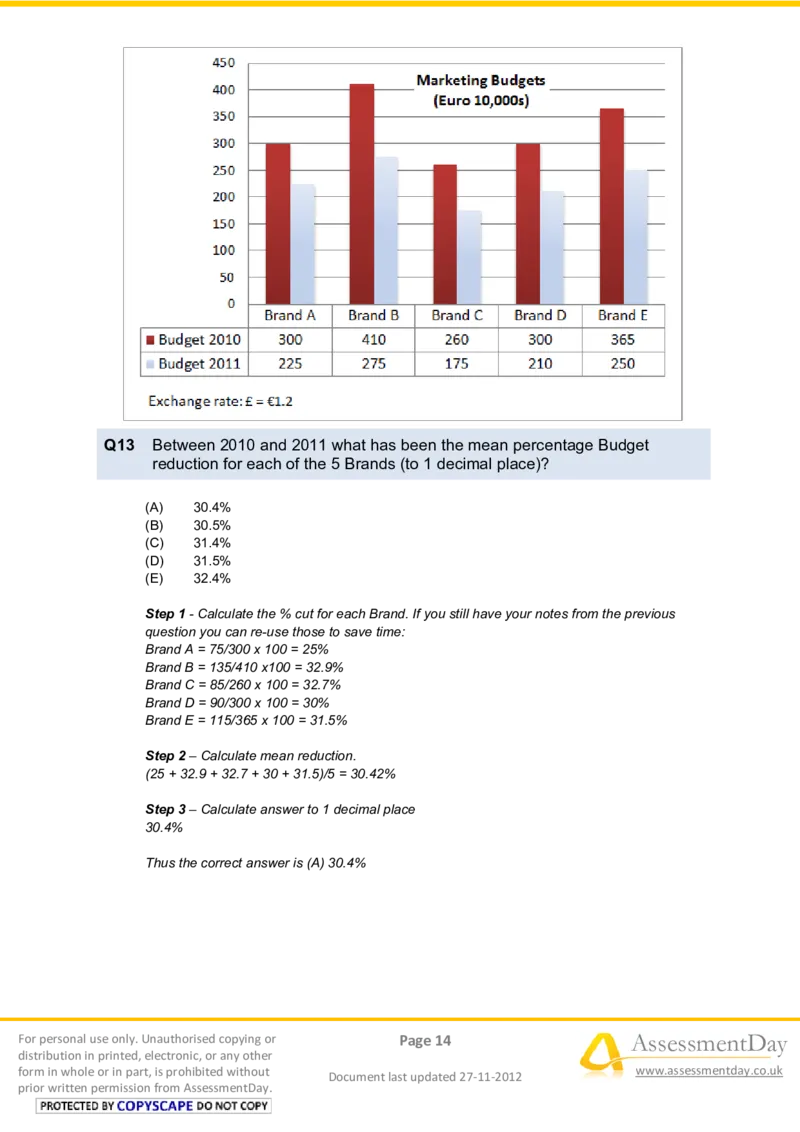
prior written permission from AssessmentDay.Q13 Between 2010 and 2011 what has been the mean percentage Budget
reduction for each of the 5 Brands (to 1 decimal place)?
(A) 30.4%
(B) 30.5%
(C) 31.4%
(D) 31.5%
(E) 32.4%
Step 1 - Calculate the % cut for each Brand. If you still have your notes from the previous
question you can re-use those to save time:
Brand A = 75/300 x 100 = 25%
Brand B = 135/410 x100 = 32.9%
Brand C = 85/260 x 100 = 32.7%
Brand D = 90/300 x 100 = 30%
Brand E = 115/365 x 100 = 31.5%
Step 2 – Calculate mean reduction.
(25 + 32.9 + 32.7 + 30 + 31.5)/5 = 30.42%
Step 3 – Calculate answer to 1 decimal place
30.4%
Thus the correct answer is (A) 30.4%
For personal use only. Unauthorised copying or Page 14 AssessmentDay
distribution in printed, electronic, or any other
form in whole or in part, is prohibited without
Document last updated 27-11-2012
www.assessmentday.co.uk
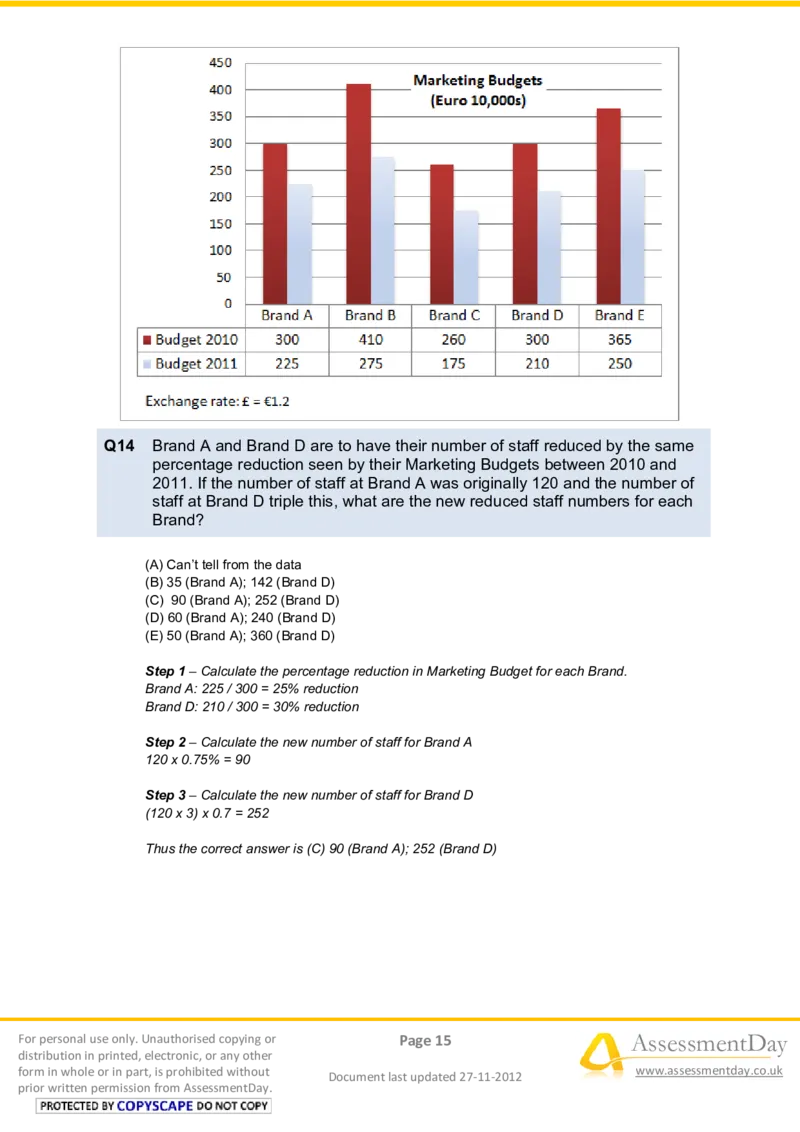
prior written permission from AssessmentDay.Q14 Brand A and Brand D are to have their number of staff reduced by the same
percentage reduction seen by their Marketing Budgets between 2010 and
2011. If the number of staff at Brand A was originally 120 and the number of
staff at Brand D triple this, what are the new reduced staff numbers for each
Brand?
(A) Can’t tell from the data
(B) 35 (Brand A); 142 (Brand D)
(C) 90 (Brand A); 252 (Brand D)
(D) 60 (Brand A); 240 (Brand D)
(E) 50 (Brand A); 360 (Brand D)
Step 1 – Calculate the percentage reduction in Marketing Budget for each Brand.
Brand A: 225 / 300 = 25% reduction
Brand D: 210 / 300 = 30% reduction
Step 2 – Calculate the new number of staff for Brand A
120 x 0.75% = 90
Step 3 – Calculate the new number of staff for Brand D
(120 x 3) x 0.7 = 252
Thus the correct answer is (C) 90 (Brand A); 252 (Brand D)
For personal use only. Unauthorised copying or Page 15 AssessmentDay
distribution in printed, electronic, or any other
form in whole or in part, is prohibited without
Document last updated 27-11-2012
www.assessmentday.co.uk
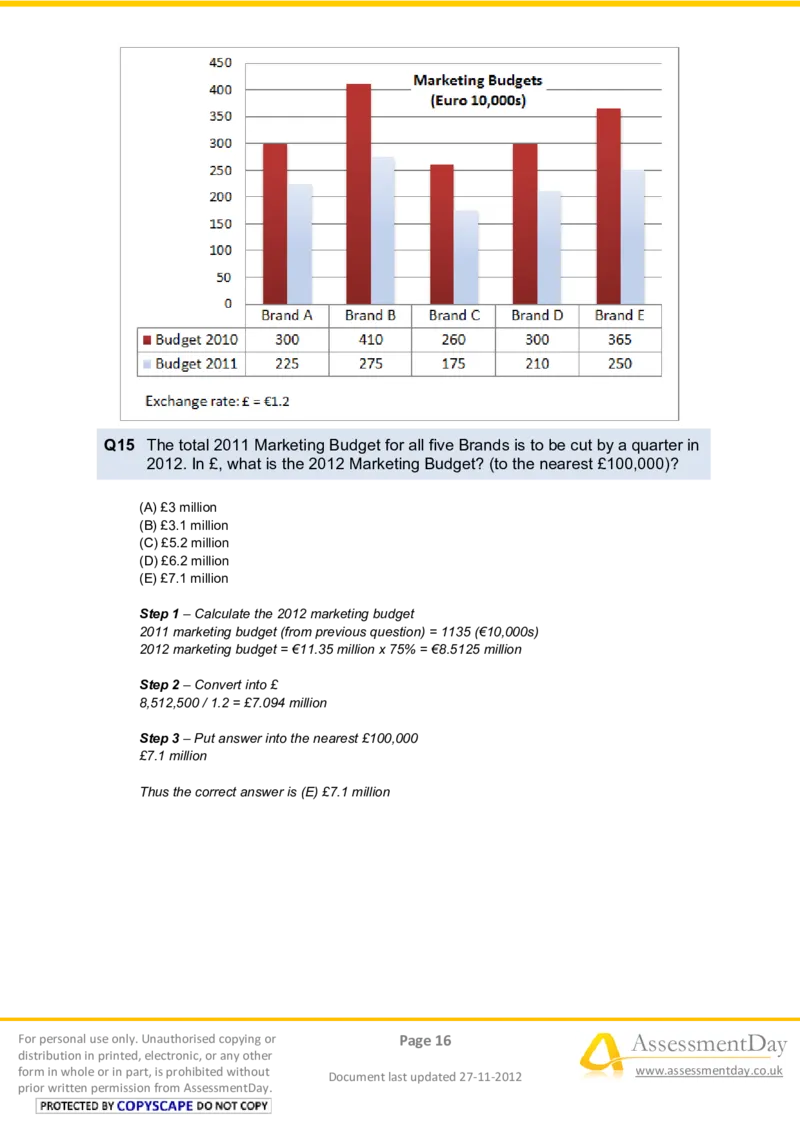
prior written permission from AssessmentDay.Q15 The total 2011 Marketing Budget for all five Brands is to be cut by a quarter in
2012. In £, what is the 2012 Marketing Budget? (to the nearest £100,000)?
(A) £3 million
(B) £3.1 million
(C) £5.2 million
(D) £6.2 million
(E) £7.1 million
Step 1 – Calculate the 2012 marketing budget
2011 marketing budget (from previous question) = 1135 (€10,000s)
2012 marketing budget = €11.35 million x 75% = €8.5125 million
Step 2 – Convert into £
8,512,500 / 1.2 = £7.094 million
Step 3 – Put answer into the nearest £100,000
£7.1 million
Thus the correct answer is (E) £7.1 million
For personal use only. Unauthorised copying or Page 16 AssessmentDay
distribution in printed, electronic, or any other
form in whole or in part, is prohibited without
Document last updated 27-11-2012
www.assessmentday.co.uk
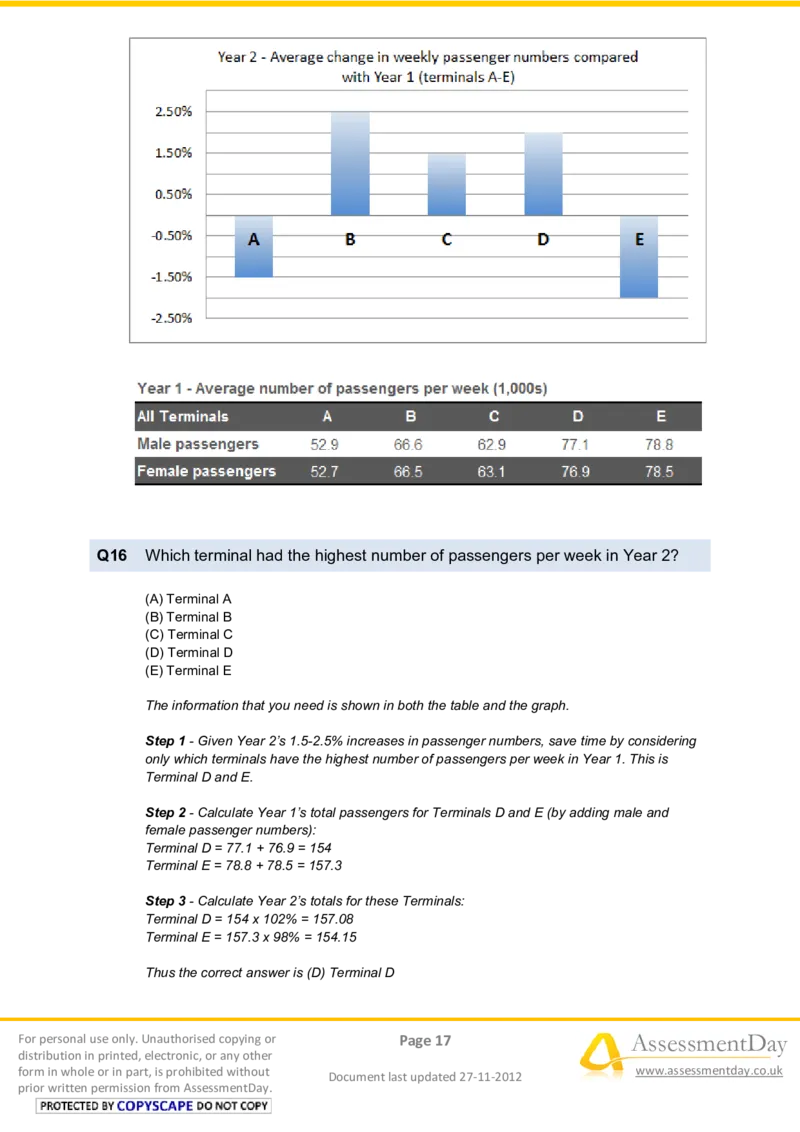
prior written permission from AssessmentDay.Q16 Which terminal had the highest number of passengers per week in Year 2?
(A) Terminal A
(B) Terminal B
(C) Terminal C
(D) Terminal D
(E) Terminal E
The information that you need is shown in both the table and the graph.
Step 1 - Given Year 2’s 1.5-2.5% increases in passenger numbers, save time by considering
only which terminals have the highest number of passengers per week in Year 1. This is
Terminal D and E.
Step 2 - Calculate Year 1’s total passengers for Terminals D and E (by adding male and
female passenger numbers):
Terminal D = 77.1 + 76.9 = 154
Terminal E = 78.8 + 78.5 = 157.3
Step 3 - Calculate Year 2’s totals for these Terminals:
Terminal D = 154 x 102% = 157.08
Terminal E = 157.3 x 98% = 154.15
Thus the correct answer is (D) Terminal D
For personal use only. Unauthorised copying or Page 17 AssessmentDay
distribution in printed, electronic, or any other
form in whole or in part, is prohibited without
Document last updated 27-11-2012
www.assessmentday.co.uk
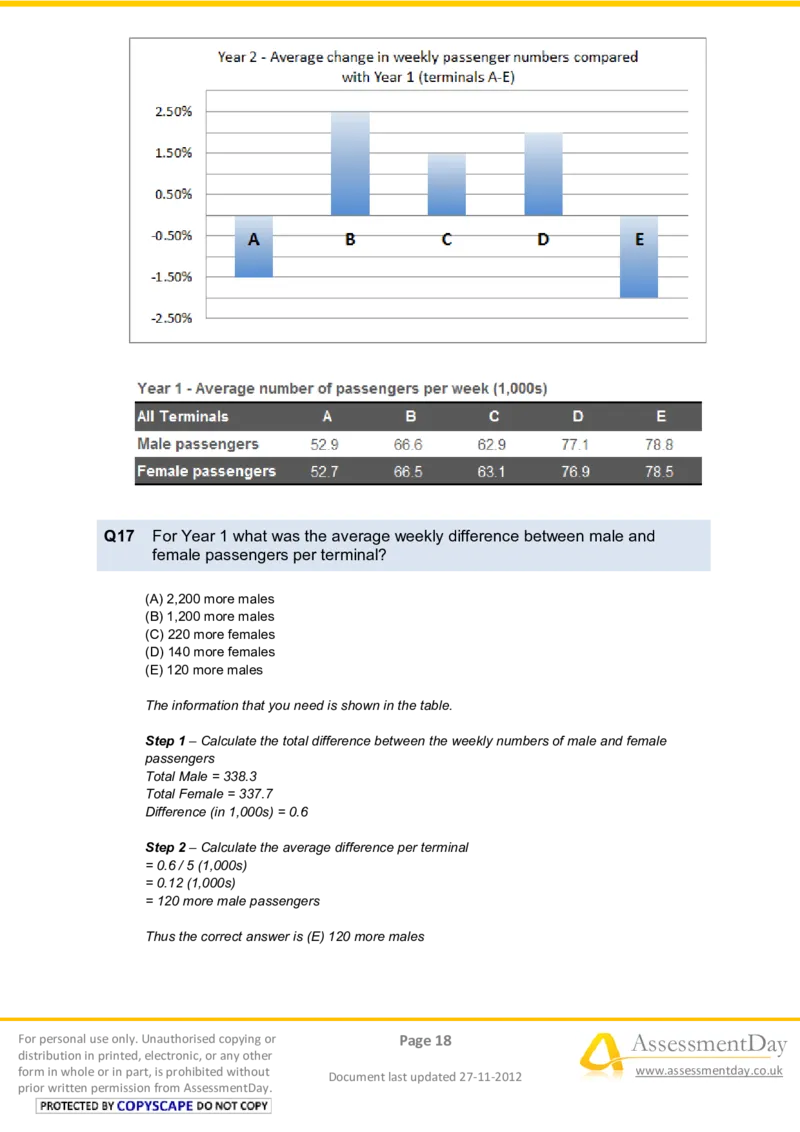
prior written permission from AssessmentDay.Q17 For Year 1 what was the average weekly difference between male and
female passengers per terminal?
(A) 2,200 more males
(B) 1,200 more males
(C) 220 more females
(D) 140 more females
(E) 120 more males
The information that you need is shown in the table.
Step 1 – Calculate the total difference between the weekly numbers of male and female
passengers
Total Male = 338.3
Total Female = 337.7
Difference (in 1,000s) = 0.6
Step 2 – Calculate the average difference per terminal
= 0.6 / 5 (1,000s)
= 0.12 (1,000s)
= 120 more male passengers
Thus the correct answer is (E) 120 more males
For personal use only. Unauthorised copying or Page 18 AssessmentDay
distribution in printed, electronic, or any other
form in whole or in part, is prohibited without
Document last updated 27-11-2012
www.assessmentday.co.uk
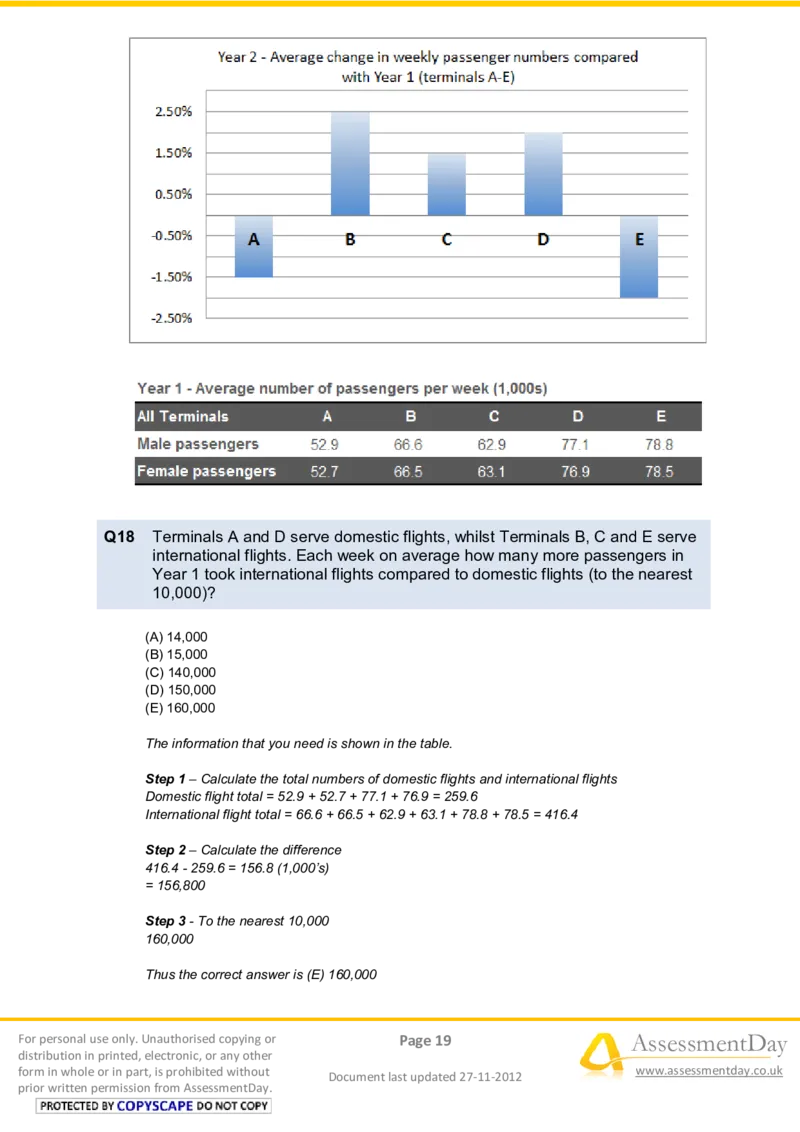
prior written permission from AssessmentDay.Q18 Terminals A and D serve domestic flights, whilst Terminals B, C and E serve
international flights. Each week on average how many more passengers in
Year 1 took international flights compared to domestic flights (to the nearest
10,000)?
(A) 14,000
(B) 15,000
(C) 140,000
(D) 150,000
(E) 160,000
The information that you need is shown in the table.
Step 1 – Calculate the total numbers of domestic flights and international flights
Domestic flight total = 52.9 + 52.7 + 77.1 + 76.9 = 259.6
International flight total = 66.6 + 66.5 + 62.9 + 63.1 + 78.8 + 78.5 = 416.4
Step 2 – Calculate the difference
416.4 - 259.6 = 156.8 (1,000’s)
= 156,800
Step 3 - To the nearest 10,000
160,000
Thus the correct answer is (E) 160,000
For personal use only. Unauthorised copying or Page 19 AssessmentDay
distribution in printed, electronic, or any other
form in whole or in part, is prohibited without
Document last updated 27-11-2012
www.assessmentday.co.uk
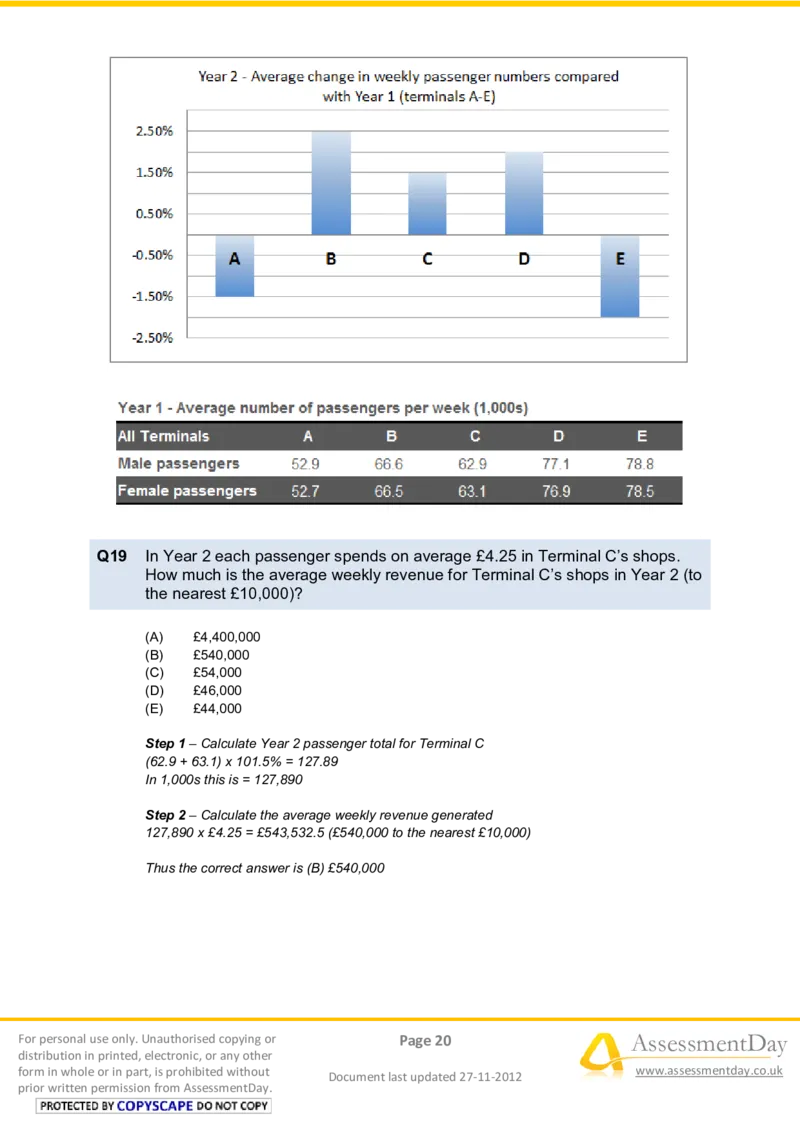
prior written permission from AssessmentDay.Q19 In Year 2 each passenger spends on average £4.25 in Terminal C’s shops.
How much is the average weekly revenue for Terminal C’s shops in Year 2 (to
the nearest £10,000)?
(A) £4,400,000
(B) £540,000
(C) £54,000
(D) £46,000
(E) £44,000
Step 1 – Calculate Year 2 passenger total for Terminal C
(62.9 + 63.1) x 101.5% = 127.89
In 1,000s this is = 127,890
Step 2 – Calculate the average weekly revenue generated
127,890 x £4.25 = £543,532.5 (£540,000 to the nearest £10,000)
Thus the correct answer is (B) £540,000
For personal use only. Unauthorised copying or Page 20 AssessmentDay
distribution in printed, electronic, or any other
form in whole or in part, is prohibited without
Document last updated 27-11-2012
www.assessmentday.co.uk
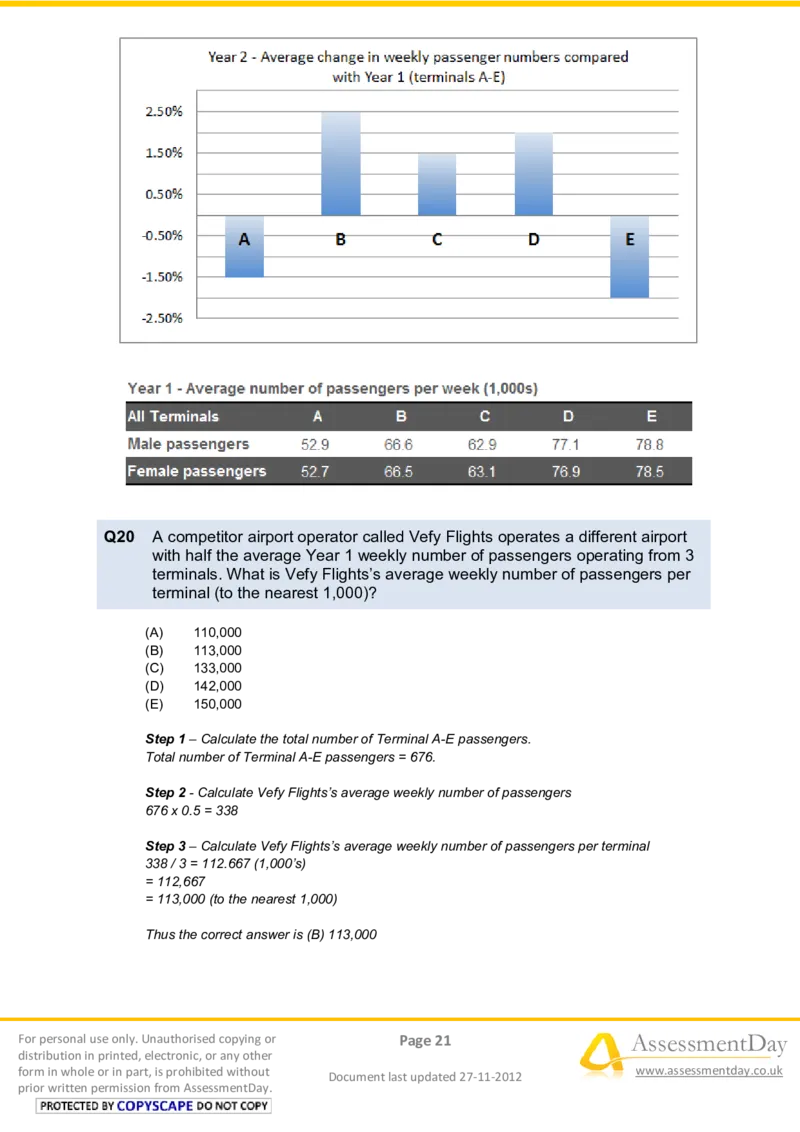
prior written permission from AssessmentDay.Q20 A competitor airport operator called Vefy Flights operates a different airport
with half the average Year 1 weekly number of passengers operating from 3
terminals. What is Vefy Flights’s average weekly number of passengers per
terminal (to the nearest 1,000)?
(A) 110,000
(B) 113,000
(C) 133,000
(D) 142,000
(E) 150,000
Step 1 – Calculate the total number of Terminal A-E passengers.
Total number of Terminal A-E passengers = 676.
Step 2 - Calculate Vefy Flights’s average weekly number of passengers
676 x 0.5 = 338
Step 3 – Calculate Vefy Flights’s average weekly number of passengers per terminal
338 / 3 = 112.667 (1,000’s)
= 112,667
= 113,000 (to the nearest 1,000)
Thus the correct answer is (B) 113,000
For personal use only. Unauthorised copying or Page 21 AssessmentDay
distribution in printed, electronic, or any other
form in whole or in part, is prohibited without
Document last updated 27-11-2012
www.assessmentday.co.uk
prior written permission from AssessmentDay.Q21 If the total 2010 costs represent a 5% increase on the total 2009 costs, what
were the total 2009 costs (to the nearest £million)?
(A) £3 million
(B) £4 million
(C) £36 million
(D) £37 million
(E) £38 million
The information for 2010 that you need is shown in the table.
Step 1 – Calculate the total costs for 2010
Q1 total = 914
Q2 total = 915
Q3 total = 1,014
Q4 total = 1,010
Total = 3,853
Step 2 – Calculate the total costs for 2009
3,853 = 105% x (2009 total costs)
2009 total costs = 3,853 / 1.05 = 3,669
Step 3 - To the nearest £million
3,669 (£10,000s) = £37 million
Thus the correct answer is (D) £37 million
For personal use only. Unauthorised copying or Page 22 AssessmentDay
distribution in printed, electronic, or any other
form in whole or in part, is prohibited without
Document last updated 27-11-2012
www.assessmentday.co.uk
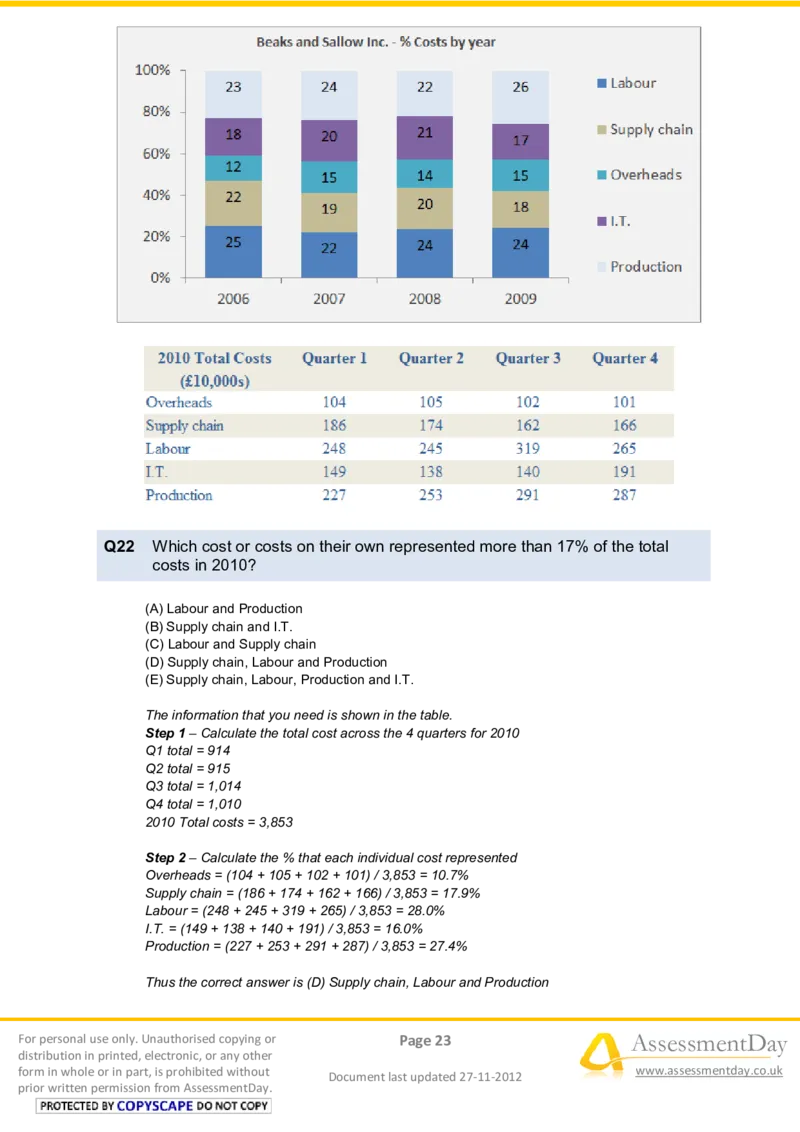
prior written permission from AssessmentDay.Q22 Which cost or costs on their own represented more than 17% of the total
costs in 2010?
(A) Labour and Production
(B) Supply chain and I.T.
(C) Labour and Supply chain
(D) Supply chain, Labour and Production
(E) Supply chain, Labour, Production and I.T.
The information that you need is shown in the table.
Step 1 – Calculate the total cost across the 4 quarters for 2010
Q1 total = 914
Q2 total = 915
Q3 total = 1,014
Q4 total = 1,010
2010 Total costs = 3,853
Step 2 – Calculate the % that each individual cost represented
Overheads = (104 + 105 + 102 + 101) / 3,853 = 10.7%
Supply chain = (186 + 174 + 162 + 166) / 3,853 = 17.9%
Labour = (248 + 245 + 319 + 265) / 3,853 = 28.0%
I.T. = (149 + 138 + 140 + 191) / 3,853 = 16.0%
Production = (227 + 253 + 291 + 287) / 3,853 = 27.4%
Thus the correct answer is (D) Supply chain, Labour and Production
For personal use only. Unauthorised copying or Page 23 AssessmentDay
distribution in printed, electronic, or any other
form in whole or in part, is prohibited without
Document last updated 27-11-2012
www.assessmentday.co.uk
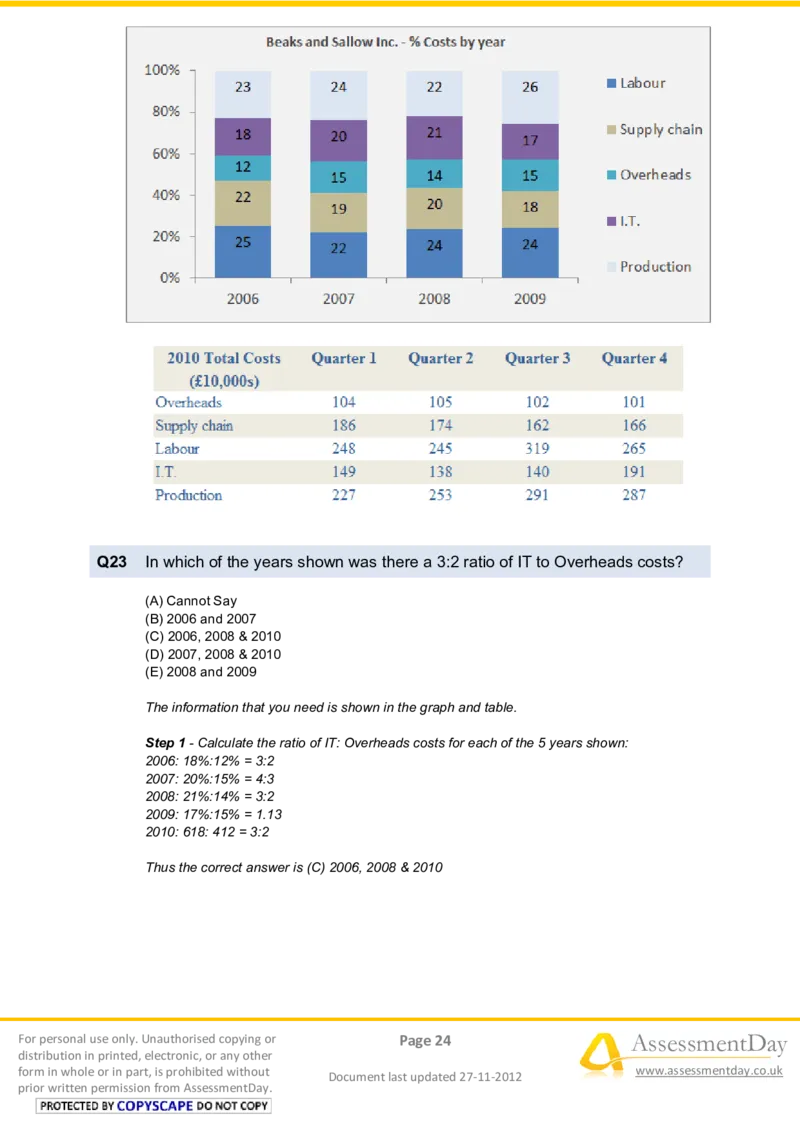
prior written permission from AssessmentDay.Q23 In which of the years shown was there a 3:2 ratio of IT to Overheads costs?
(A) Cannot Say
(B) 2006 and 2007
(C) 2006, 2008 & 2010
(D) 2007, 2008 & 2010
(E) 2008 and 2009
The information that you need is shown in the graph and table.
Step 1 - Calculate the ratio of IT: Overheads costs for each of the 5 years shown:
2006: 18%:12% = 3:2
2007: 20%:15% = 4:3
2008: 21%:14% = 3:2
2009: 17%:15% = 1.13
2010: 618: 412 = 3:2
Thus the correct answer is (C) 2006, 2008 & 2010
For personal use only. Unauthorised copying or Page 24 AssessmentDay
distribution in printed, electronic, or any other
form in whole or in part, is prohibited without
Document last updated 27-11-2012
www.assessmentday.co.uk
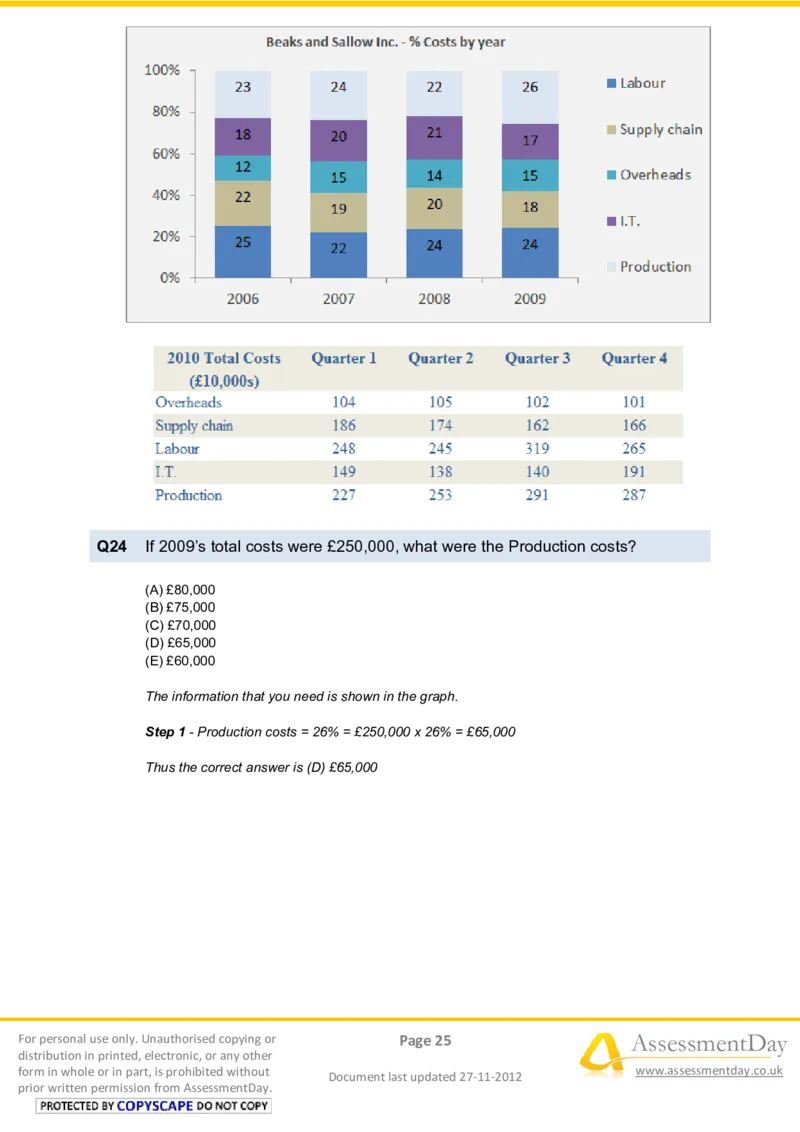
prior written permission from AssessmentDay.Q24 If 2009’s total costs were £250,000, what were the Production costs?
(A) £80,000
(B) £75,000
(C) £70,000
(D) £65,000
(E) £60,000
The information that you need is shown in the graph.
Step 1 - Production costs = 26% = £250,000 x 26% = £65,000
Thus the correct answer is (D) £65,000
For personal use only. Unauthorised copying or Page 25 AssessmentDay
distribution in printed, electronic, or any other
form in whole or in part, is prohibited without
Document last updated 27-11-2012
www.assessmentday.co.uk
prior written permission from AssessmentDay.Q25 If the costs are put into order of decreasing size, in which two years is the
order the same?
(A) 2006 and 2007
(B) 2006 and 2008
(C) 2006 and 2010
(D) 2007 and 2008
(E) 2007 and 2009
Step 1 - Put each year’s costs into size order:
2006 = Labour, Production, Supply Chain, IT, Overheads
2007 = Production, Labour, IT, Supply Chain, Overheads
2008 = Labour, Production, IT, Supply Chain, Overheads
2009 = Production, Labour, Supply Chain, IT, Overheads
Tip: at this stage you could see that none of the years match so given that there is no "none
of these" option you could gamble that 2010 will have the same order as one of the others,
and thus go for answer (C).
Step 2 - Carrying on for the remaining year:
2010 = Labour (1,077), Production (1,058), Supply Chain (688), IT (618), Overheads (412)
Thus the correct answer is (C) 2006 and 2010
For personal use only. Unauthorised copying or Page 26 AssessmentDay
distribution in printed, electronic, or any other
form in whole or in part, is prohibited without
Document last updated 27-11-2012
www.assessmentday.co.uk
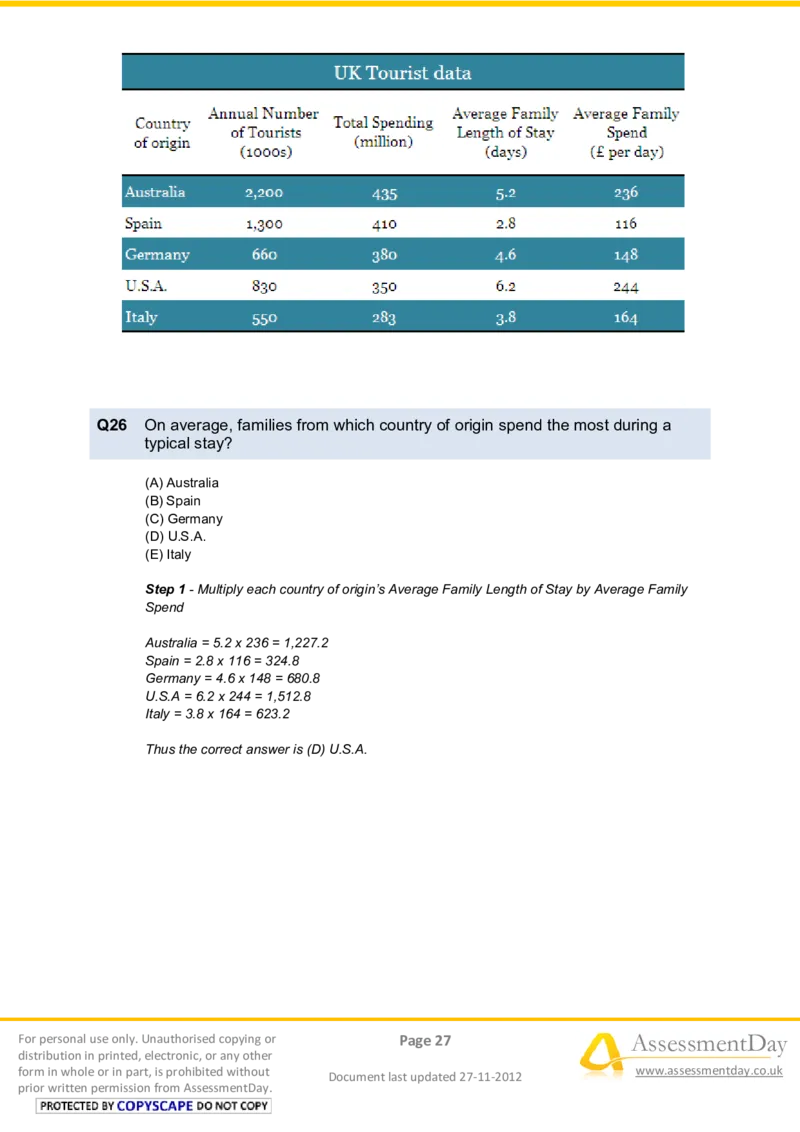
prior written permission from AssessmentDay.Q26 On average, families from which country of origin spend the most during a
typical stay?
(A) Australia
(B) Spain
(C) Germany
(D) U.S.A.
(E) Italy
Step 1 - Multiply each country of origin’s Average Family Length of Stay by Average Family
Spend
Australia = 5.2 x 236 = 1,227.2
Spain = 2.8 x 116 = 324.8
Germany = 4.6 x 148 = 680.8
U.S.A = 6.2 x 244 = 1,512.8
Italy = 3.8 x 164 = 623.2
Thus the correct answer is (D) U.S.A.
For personal use only. Unauthorised copying or Page 27 AssessmentDay
distribution in printed, electronic, or any other
form in whole or in part, is prohibited without
Document last updated 27-11-2012
www.assessmentday.co.uk
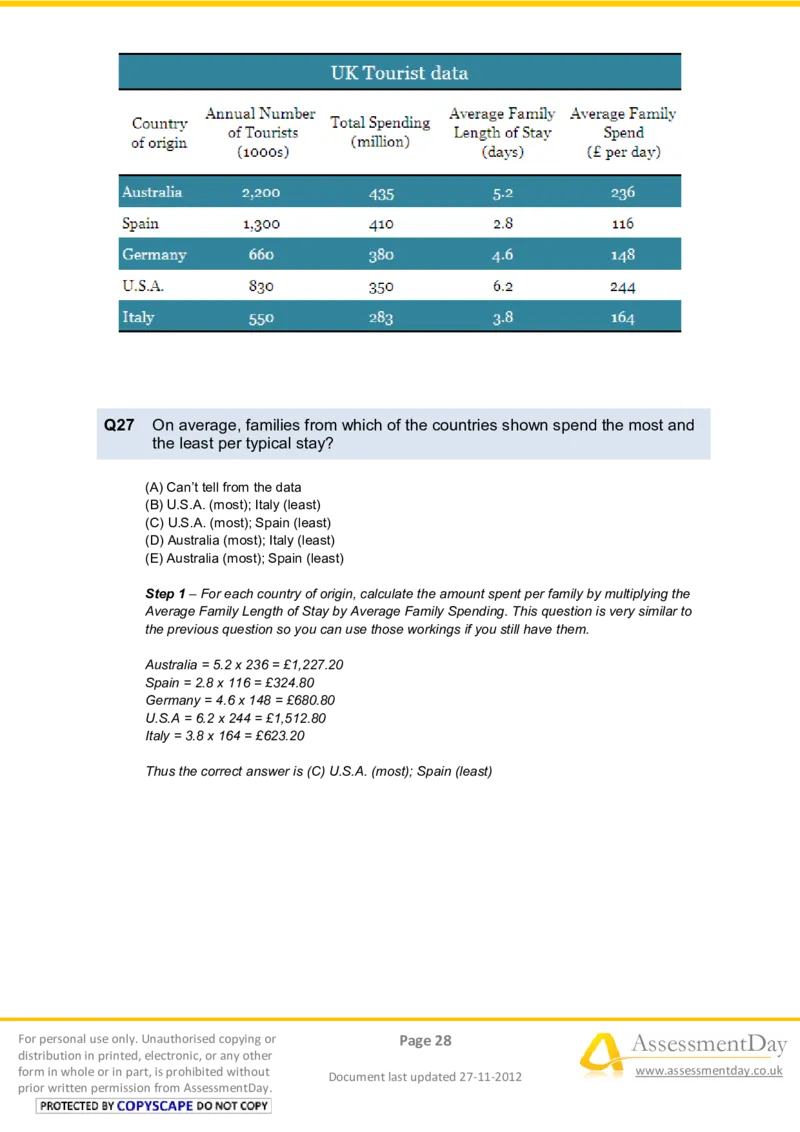
prior written permission from AssessmentDay.Q27 On average, families from which of the countries shown spend the most and
the least per typical stay?
(A) Can’t tell from the data
(B) U.S.A. (most); Italy (least)
(C) U.S.A. (most); Spain (least)
(D) Australia (most); Italy (least)
(E) Australia (most); Spain (least)
Step 1 – For each country of origin, calculate the amount spent per family by multiplying the
Average Family Length of Stay by Average Family Spending. This question is very similar to
the previous question so you can use those workings if you still have them.
Australia = 5.2 x 236 = £1,227.20
Spain = 2.8 x 116 = £324.80
Germany = 4.6 x 148 = £680.80
U.S.A = 6.2 x 244 = £1,512.80
Italy = 3.8 x 164 = £623.20
Thus the correct answer is (C) U.S.A. (most); Spain (least)
For personal use only. Unauthorised copying or Page 28 AssessmentDay
distribution in printed, electronic, or any other
form in whole or in part, is prohibited without
Document last updated 27-11-2012
www.assessmentday.co.uk
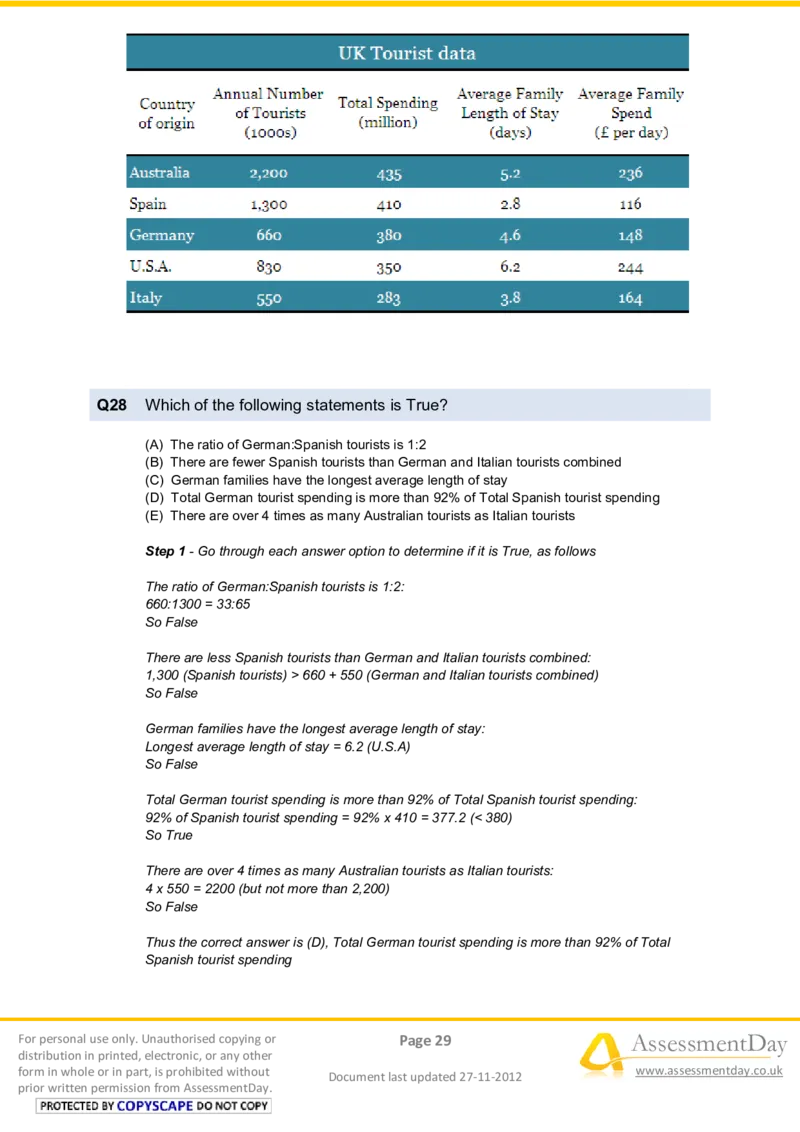
prior written permission from AssessmentDay.Q28 Which of the following statements is True?
(A) The ratio of German:Spanish tourists is 1:2
(B) There are fewer Spanish tourists than German and Italian tourists combined
(C) German families have the longest average length of stay
(D) Total German tourist spending is more than 92% of Total Spanish tourist spending
(E) There are over 4 times as many Australian tourists as Italian tourists
Step 1 - Go through each answer option to determine if it is True, as follows
The ratio of German:Spanish tourists is 1:2:
660:1300 = 33:65
So False
There are less Spanish tourists than German and Italian tourists combined:
1,300 (Spanish tourists) > 660 + 550 (German and Italian tourists combined)
So False
German families have the longest average length of stay:
Longest average length of stay = 6.2 (U.S.A)
So False
Total German tourist spending is more than 92% of Total Spanish tourist spending:
92% of Spanish tourist spending = 92% x 410 = 377.2 (< 380)
So True
There are over 4 times as many Australian tourists as Italian tourists:
4 x 550 = 2200 (but not more than 2,200)
So False
Thus the correct answer is (D), Total German tourist spending is more than 92% of Total
Spanish tourist spending
For personal use only. Unauthorised copying or Page 29 AssessmentDay
distribution in printed, electronic, or any other
form in whole or in part, is prohibited without
Document last updated 27-11-2012
www.assessmentday.co.uk
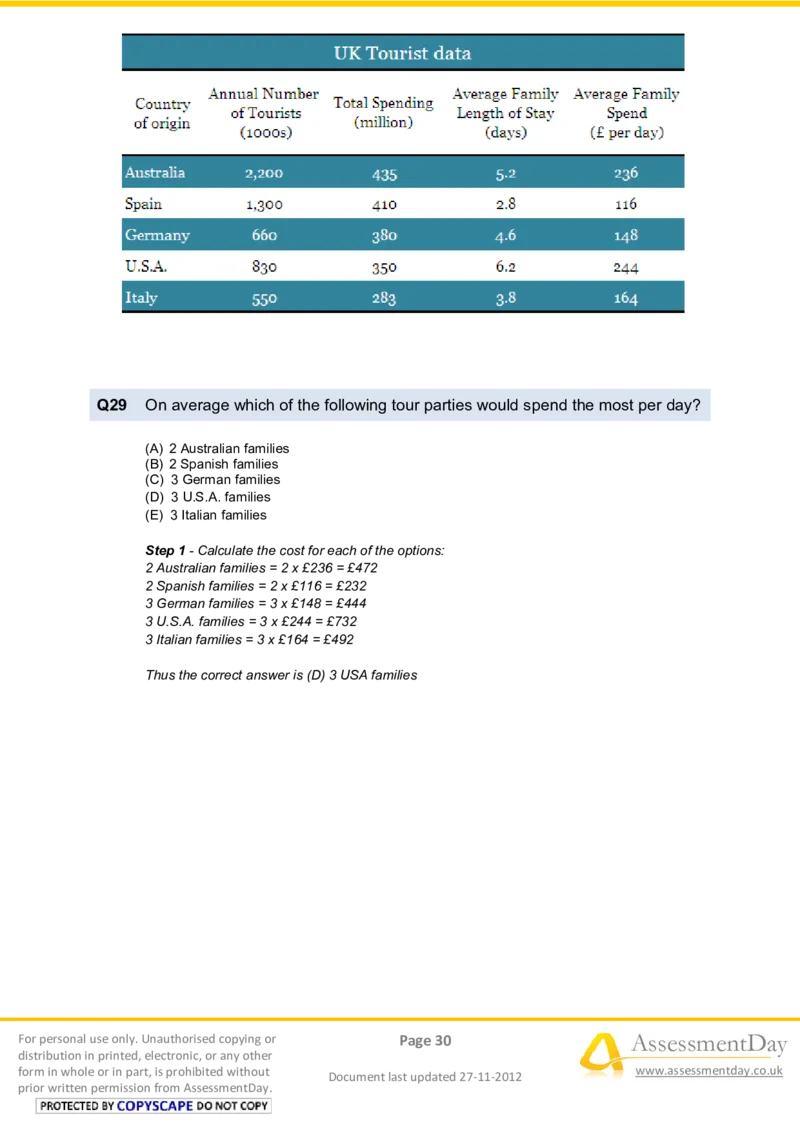
prior written permission from AssessmentDay.Q29 On average which of the following tour parties would spend the most per day?
(A) 2 Australian families
(B) 2 Spanish families
(C) 3 German families
(D) 3 U.S.A. families
(E) 3 Italian families
Step 1 - Calculate the cost for each of the options:
2 Australian families = 2 x £236 = £472
2 Spanish families = 2 x £116 = £232
3 German families = 3 x £148 = £444
3 U.S.A. families = 3 x £244 = £732
3 Italian families = 3 x £164 = £492
Thus the correct answer is (D) 3 USA families
For personal use only. Unauthorised copying or Page 30 AssessmentDay
distribution in printed, electronic, or any other
form in whole or in part, is prohibited without
Document last updated 27-11-2012
www.assessmentday.co.uk
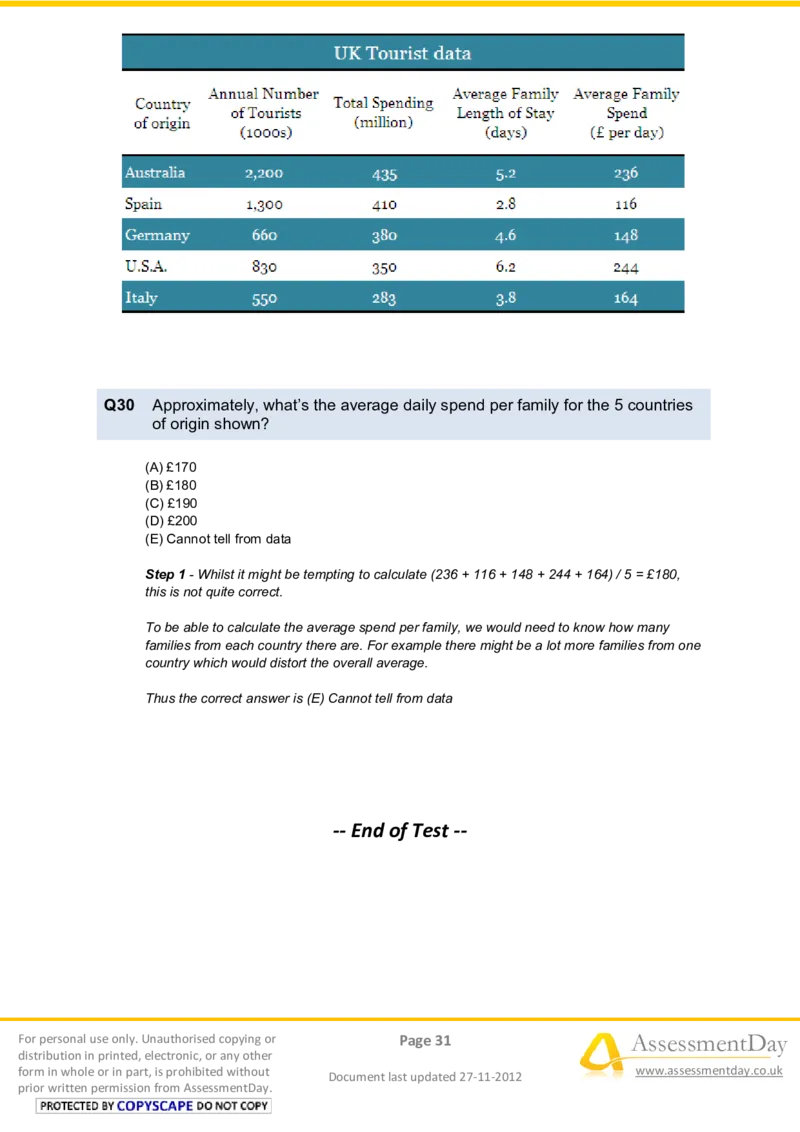
prior written permission from AssessmentDay.Q30 Approximately, what’s the average daily spend per family for the 5 countries
of origin shown?
(A) £170
(B) £180
(C) £190
(D) £200
(E) Cannot tell from data
Step 1 - Whilst it might be tempting to calculate (236 + 116 + 148 + 244 + 164) / 5 = £180,
this is not quite correct.
To be able to calculate the average spend per family, we would need to know how many
families from each country there are. For example there might be a lot more families from one
country which would distort the overall average.
Thus the correct answer is (E) Cannot tell from data
-- End of Test --
For personal use only. Unauthorised copying or Page 31 AssessmentDay
distribution in printed, electronic, or any other
form in whole or in part, is prohibited without
Document last updated 27-11-2012
www.assessmentday.co.uk
prior written permission from AssessmentDay.

