ARTICLE · 947124
利用 Tikz 在 LaTeX 文档中绘制平面直角坐标系
利用 Tikz 在 LaTeX 文档中绘制平面直角坐标系
今天学习了利用 Tikz 在 LaTeX 文档中绘制平面直角坐标系,总结笔记如下.
版本 1 代码,首先是空白的带刻度的平面直角坐标系
% tikz 绘制带刻度的直角坐标系代码,版本1\documentclass{article}\usepackage{tikz}\begin{document}\begin{tikzpicture}[>=stealth,scale=1]% 坐标轴范围\def\xmin{-3.5} \def\xmax{4.2}\def\ymin{-2.5} \def\ymax{3.8}% 原点标注\node[below left] at (0,0) {$O$};% x轴\draw[->] (\xmin,0) -- (\xmax,0) node[shift={(-110:7pt)}] {$x$};% y轴\draw[->] (0,\ymin) -- (0,\ymax) node[shift={(200:7pt)}] {$y$};% x轴刻度\foreach \x in {-3,-2,-1,1,2,3} { \draw (\x,0.08) -- (\x,0) node[below] {$\x$};}% y轴刻度\foreach \y in {-2,-1,1,2,3} { \draw (0.08,\y) -- (0,\y) node[left] {$\y$};}\end{tikzpicture}\end{document}绘制带刻度的坐标轴效果图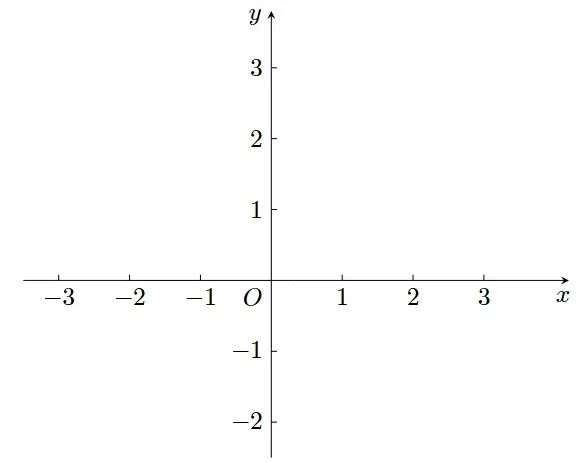
版本 2 代码
% tikz 绘制带刻度的直角坐标系代码,版本2\documentclass{article}\usepackage{tikz}\begin{document}\begin{tikzpicture}[ >=stealth, line width=0.6pt, tick/.style={shorten >=0pt, shorten <=0pt}]% 坐标轴\draw[->] (-3.5,0)--(4,0) node[shift={(-110:7pt)}] {$x$};\draw[->] (0,-3.5)--(0,3.6) node[shift={(200:7pt)}] {$y$};\node[anchor=north west] at (0,0){$O$};%原点在右下角% x轴% 批量绘制刻度%\foreach \t in {-3,-2,-1,1,2,3}{ %\draw (\t,0.1)--(\t,-0.1) node[below] {$\t$}; %\draw (0.1,\t)--(-0.1,\t) node[left] {$\t$};%}\foreach \t in {-3,-2,-1,1,2,3}{ \draw (\t,0.1)--(\t,0) node[below] {$\t$}; \draw (0.1,\t)--(0,\t) node[left] {$\t$};}% 示例:画一条直线 y=x\draw[line width=0.9pt,red] (-3,-3)--(3,3);\end{tikzpicture}\end{document}效果图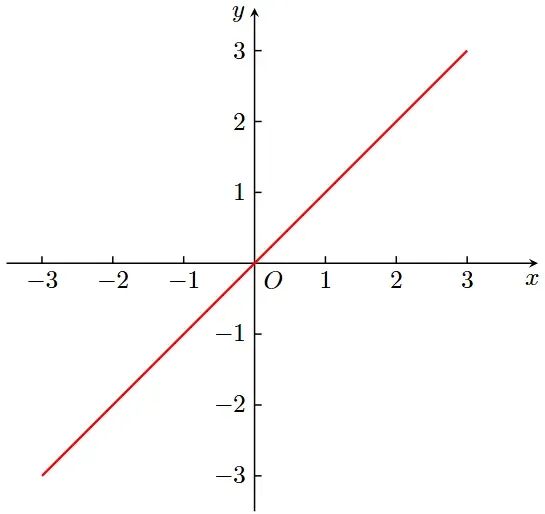
弧度制下的平面直角坐标系代码
% tikz 绘制弧度制下的平面直角坐标系代码,以绘制正弦函数图像为例\documentclass[12pt]{article}\usepackage{amsmath,amssymb,amsthm,mathrsfs,upgreek,ctex}\usepackage{tikz}\usepackage{chemfig}\usepackage[left=2cm,right=2cm,top=2cm,bottom=2cm]{geometry}\begin{document}\begin{tikzpicture}%[thick] \draw[-Stealth] (-8,0)--(7.2,0) node[shift={(-120:7pt)}] {$x$};%x轴 \draw[-Stealth] (0,-1.5)--(0,1.5) node[shift={(210:7pt)}] {$y$};%y轴 \node[anchor=north west] at (0,0){$O$};%原点在右下角%x轴上的刻度及标注\foreach \t in {-2*pi,-1.5*pi,-pi,-0.5*pi,0.5*pi,pi,1.5*pi,2*pi}{ \draw (\t,0.1)--(\t,0) ;}\node [below] at (-2*pi,0) {$-2\pi$};\node [below] at (-1.5*pi,0) {$-\dfrac{3\pi}{2}$};\node [below] at (-pi,0) {$-\pi$};\node [below] at (-0.5*pi,0) {$-\dfrac{\pi}{2}$};\node [below] at (0.5*pi,0) {$\dfrac{\pi}{2}$};\node [below] at (pi,0) {$\pi$};;\node [below] at (1.5*pi,0) {$\dfrac{3\pi}{2}$};\node [below] at (2*pi,0) {$2\pi$};%y轴上的刻度及标注\draw (0,1)--(0.1,1) node[left] {$1$};\draw (0,-1)--(0.1,-1) node[left] {$-1$};%%%%%%%%%%%以下绘图%%%%%%%%%%%%%%%%%%%%%%%%\draw[line width=0.9pt,blue,domain=-2.2*pi:2.2*pi,samples=1000] plot(\x,{sin(\x r)});%图像绘制 \draw (0,-2) node{正弦函数$y=\sin x$};%函数名\end{tikzpicture}\end{document}效果图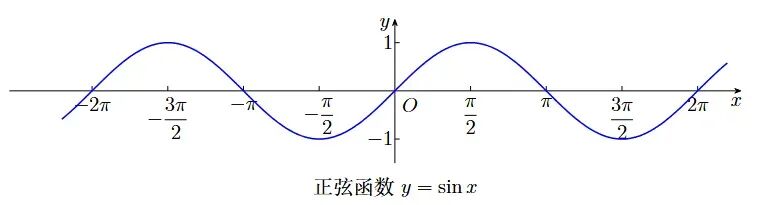
在此基础上,可以用 Tikz 绘制基本初等函数图像和平面解析几何曲线,后续学会了再更新.