文档内容
1、
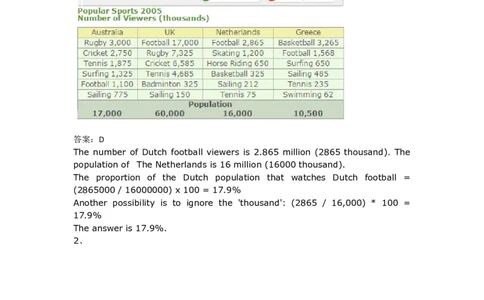
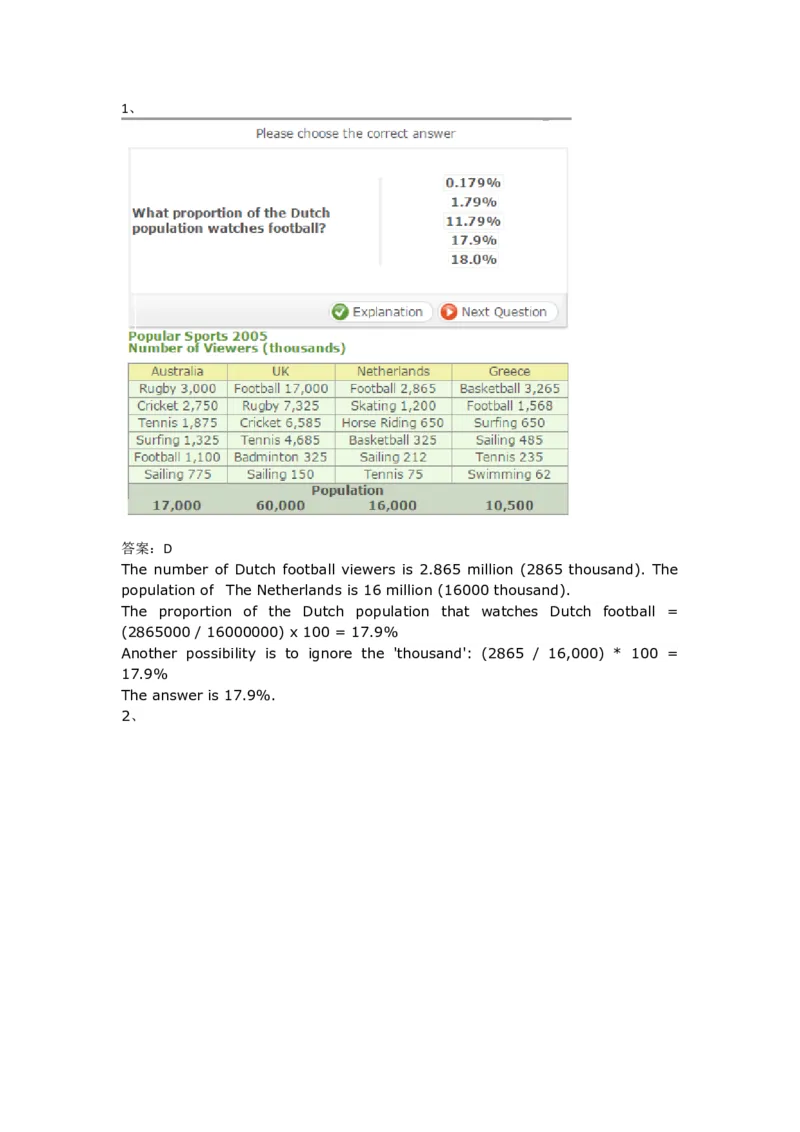
答案:D
The number of Dutch football viewers is 2.865 million (2865 thousand). The
population of The Netherlands is 16 million (16000 thousand).
The proportion of the Dutch population that watches Dutch football =
(2865000 / 16000000) x 100 = 17.9%
Another possibility is to ignore the 'thousand': (2865 / 16,000) * 100 =
17.9%
The answer is 17.9%.
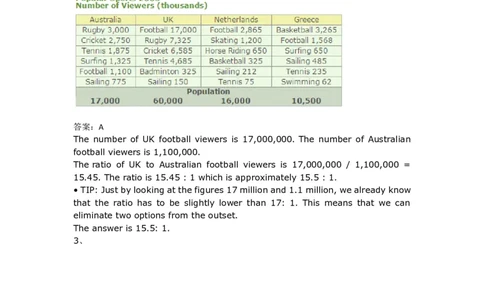
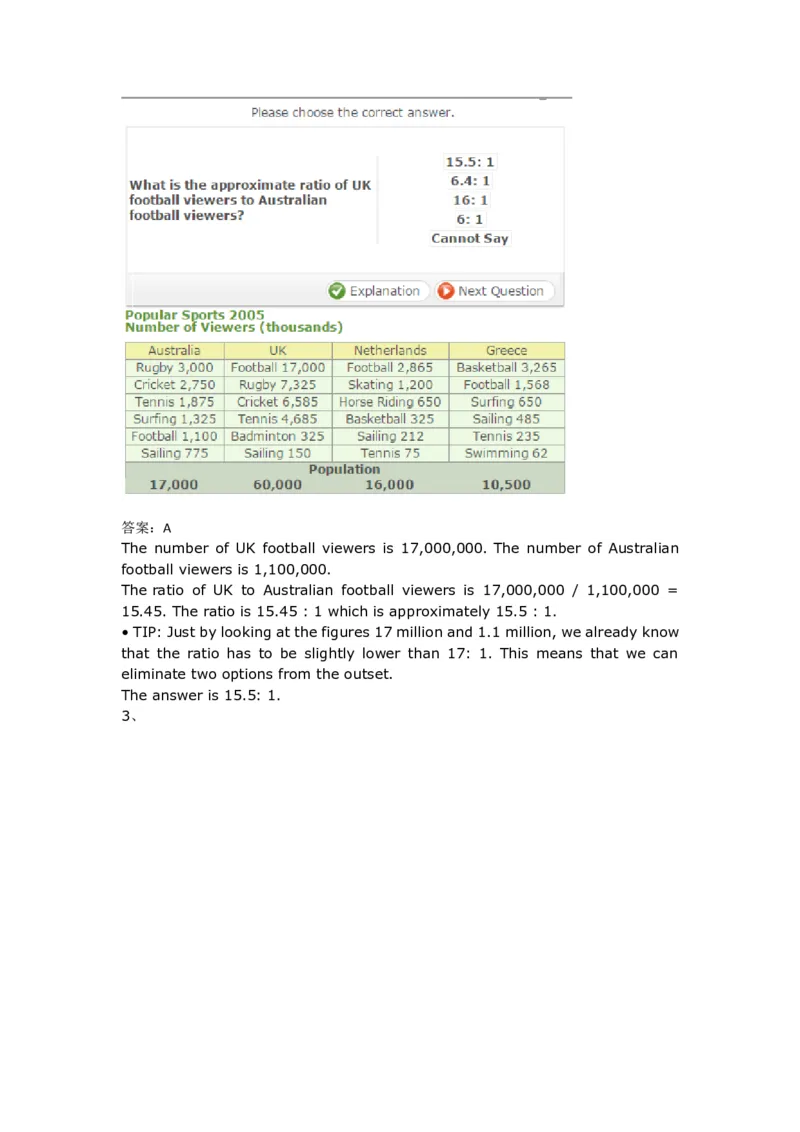
2、答案:A
The number of UK football viewers is 17,000,000. The number of Australian
football viewers is 1,100,000.
The ratio of UK to Australian football viewers is 17,000,000 / 1,100,000 =
15.45. The ratio is 15.45 : 1 which is approximately 15.5 : 1.
• TIP: Just by looking at the figures 17 million and 1.1 million, we already know
that the ratio has to be slightly lower than 17: 1. This means that we can
eliminate two options from the outset.
The answer is 15.5: 1.
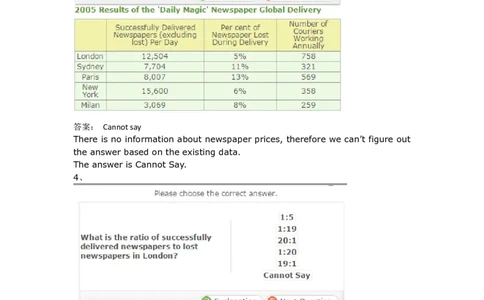
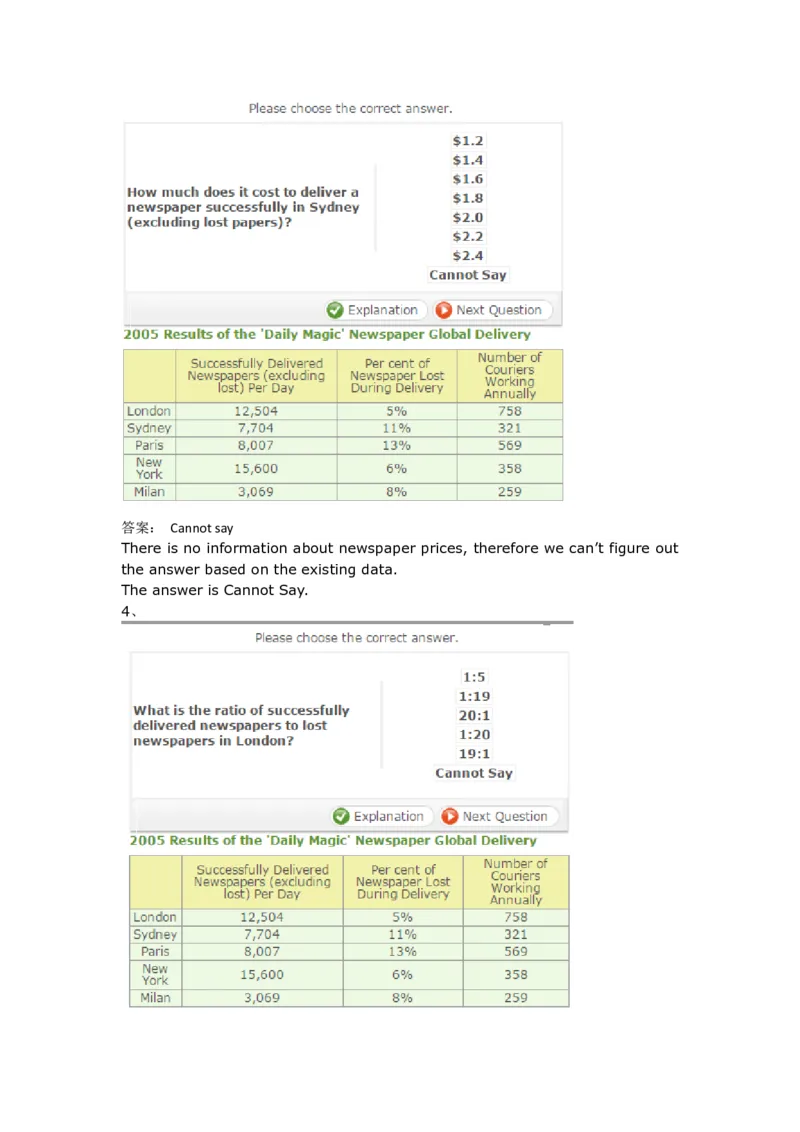
3、答案: Cannot say
There is no information about newspaper prices, therefore we can’t figure out
the answer based on the existing data.
The answer is Cannot Say.
4、答案:19:1
Out of a total of 100% of newspapers that leave the factory, 5% are lost. This
means that for every 100 newspapers, 95 papers are delivered and five
newspapers are lost. Dividing 95 by 5 = 19. The ratio of successfully delivered
newspapers to lost newspapers in London is 19:1.
The answer is 19:1.
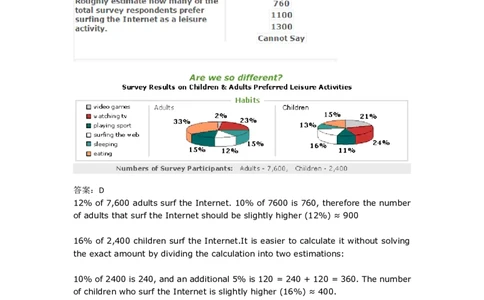
5、
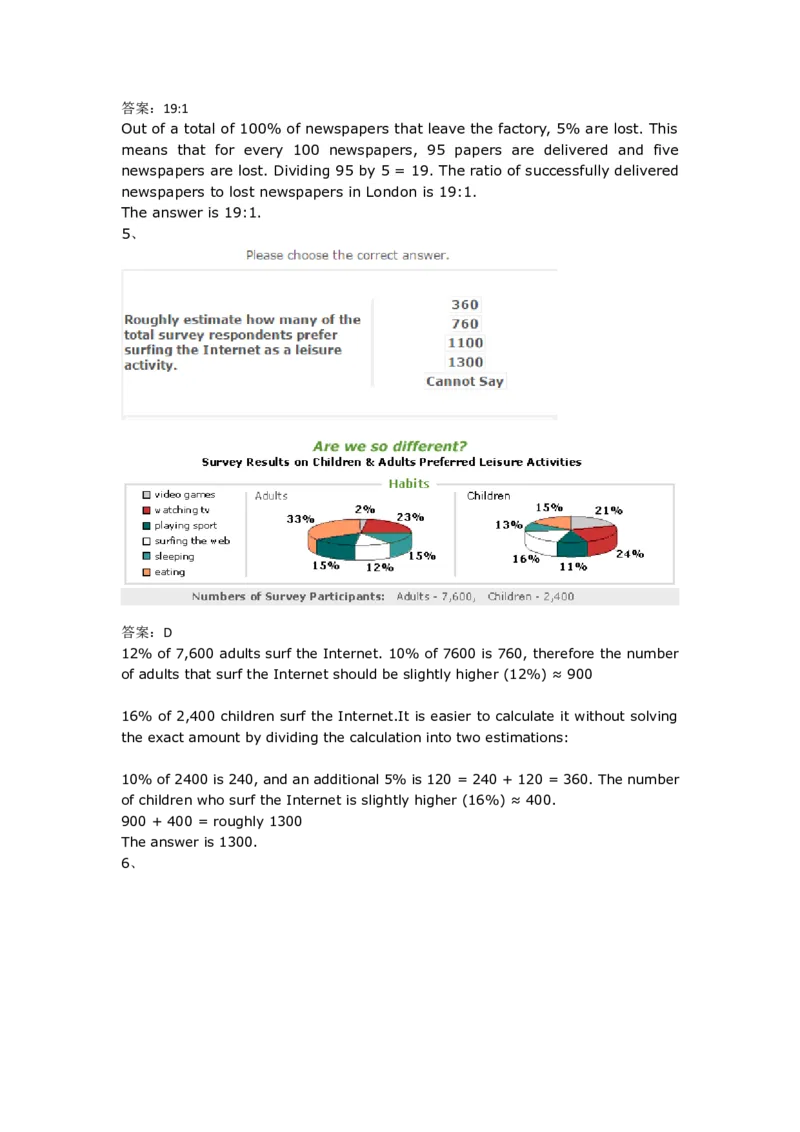
答案:D
12% of 7,600 adults surf the Internet. 10% of 7600 is 760, therefore the number
of adults that surf the Internet should be slightly higher (12%) ≈ 900
16% of 2,400 children surf the Internet.It is easier to calculate it without solving
the exact amount by dividing the calculation into two estimations:
10% of 2400 is 240, and an additional 5% is 120 = 240 + 120 = 360. The number
of children who surf the Internet is slightly higher (16%) ≈ 400.
900 + 400 = roughly 1300
The answer is 1300.
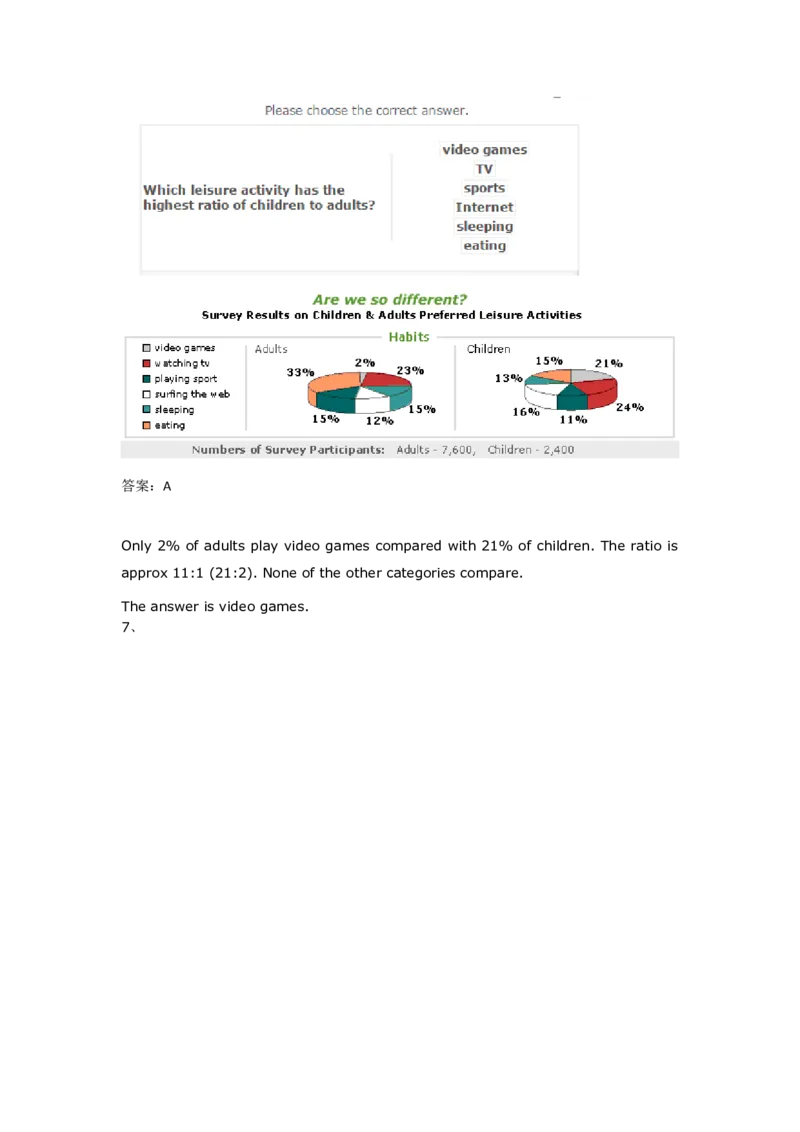
6、答案:A
Only 2% of adults play video games compared with 21% of children. The ratio is
approx 11:1 (21:2). None of the other categories compare.
The answer is video games.
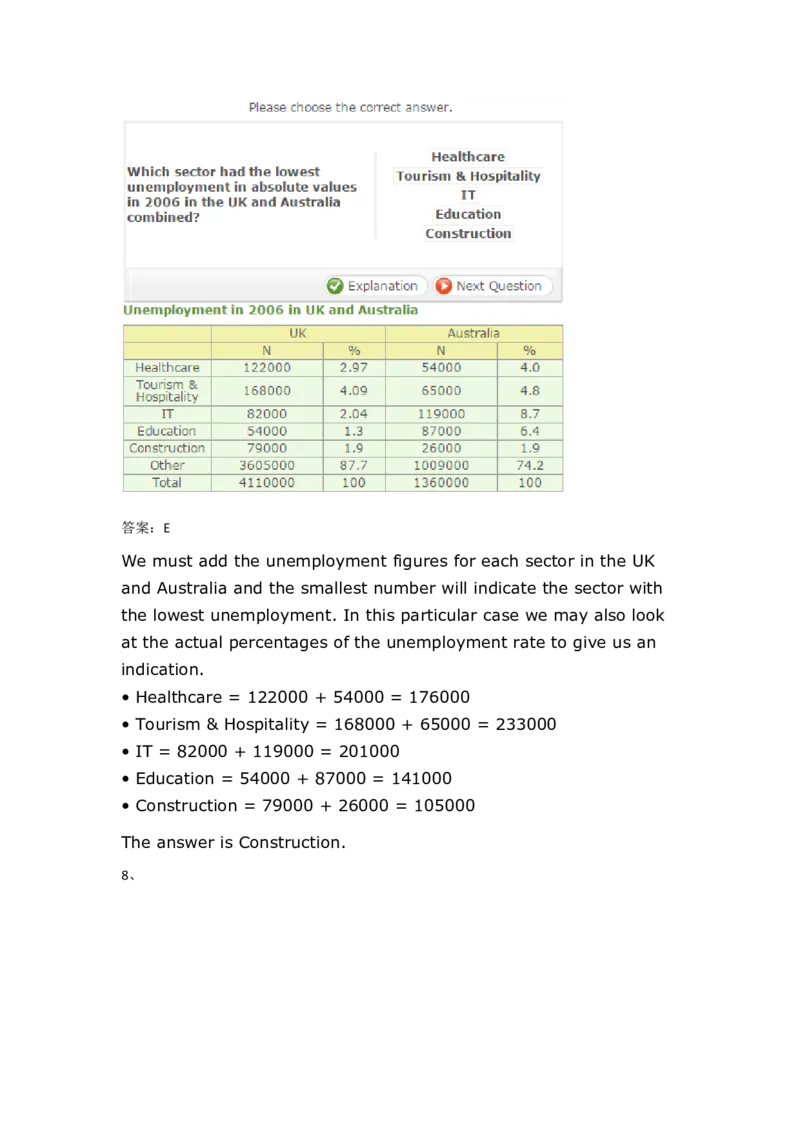
7、答案:E
We must add the unemployment figures for each sector in the UK
and Australia and the smallest number will indicate the sector with
the lowest unemployment. In this particular case we may also look
at the actual percentages of the unemployment rate to give us an
indication.
• Healthcare = 122000 + 54000 = 176000
• Tourism & Hospitality = 168000 + 65000 = 233000
• IT = 82000 + 119000 = 201000
• Education = 54000 + 87000 = 141000
• Construction = 79000 + 26000 = 105000
The answer is Construction.
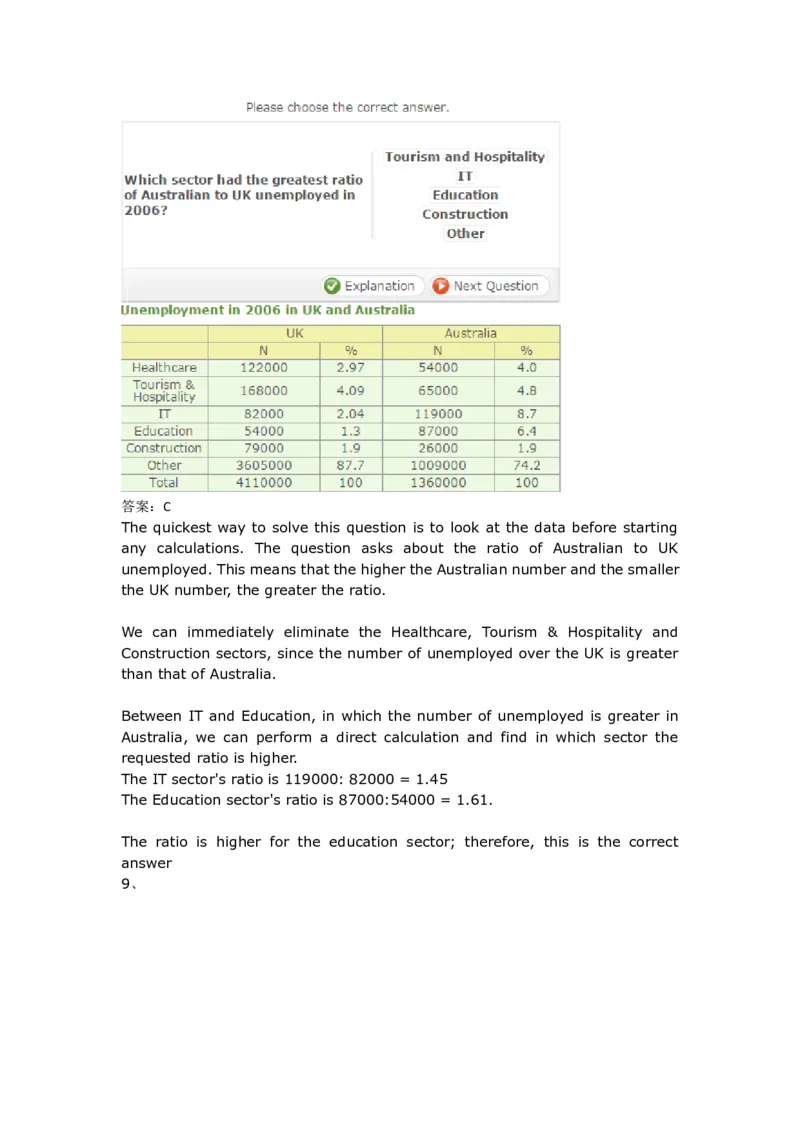
8、答案:C
The quickest way to solve this question is to look at the data before starting
any calculations. The question asks about the ratio of Australian to UK
unemployed. This means that the higher the Australian number and the smaller
the UK number, the greater the ratio.
We can immediately eliminate the Healthcare, Tourism & Hospitality and
Construction sectors, since the number of unemployed over the UK is greater
than that of Australia.
Between IT and Education, in which the number of unemployed is greater in
Australia, we can perform a direct calculation and find in which sector the
requested ratio is higher.
The IT sector's ratio is 119000: 82000 = 1.45
The Education sector's ratio is 87000:54000 = 1.61.
The ratio is higher for the education sector; therefore, this is the correct
answer
9、Natural Resources Market Annum Statistics
Value of Extracted
No. of Produce
employees (in millions)
Product
(in Value Per
Total
thousands) Country
Value
Asia U.S.A
Oil 2,572 $7,568 $487 $1,574
Copper 1,235 $3,587 $831 $928
Coal 957 $3,456 $728 $1,375
Uranium 1,542 $6,875 $427 $3,208
Silver 1,012 $3,500 $700 $1,789
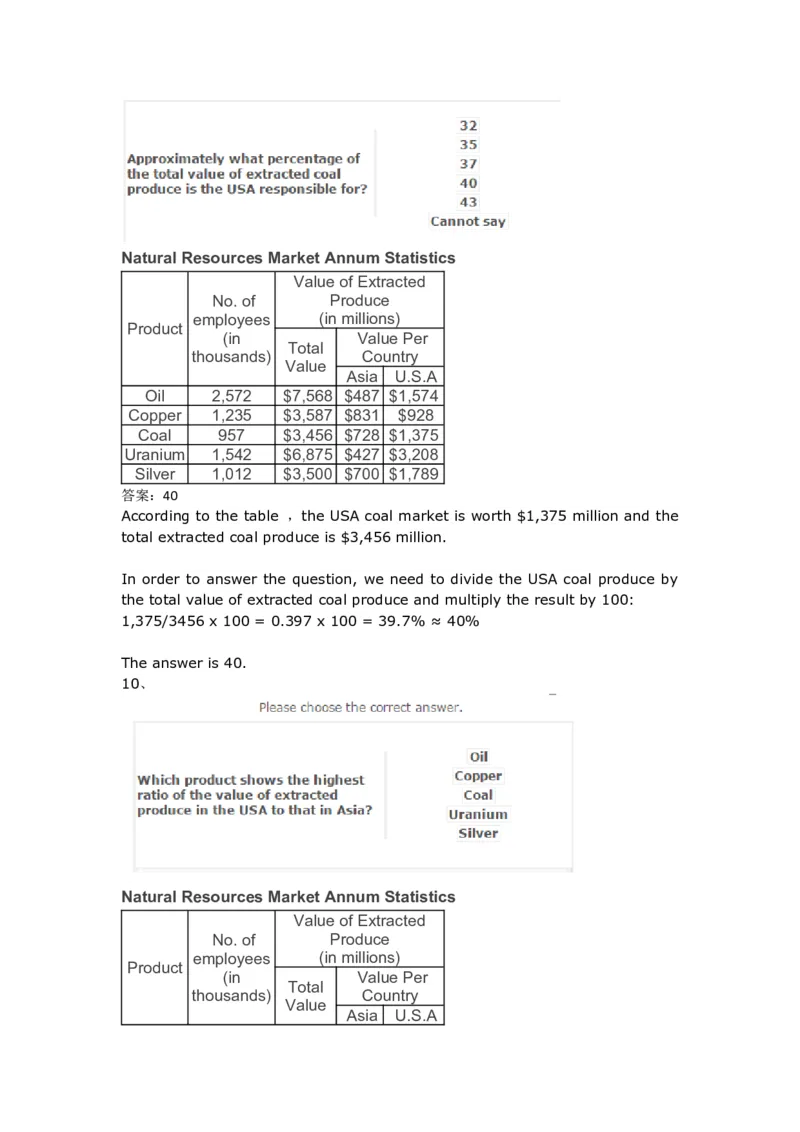
答案:40
According to the table ,the USA coal market is worth $1,375 million and the
total extracted coal produce is $3,456 million.
In order to answer the question, we need to divide the USA coal produce by
the total value of extracted coal produce and multiply the result by 100:
1,375/3456 x 100 = 0.397 x 100 = 39.7% ≈ 40%
The answer is 40.
10、
Natural Resources Market Annum Statistics
Value of Extracted
No. of Produce
employees (in millions)
Product
(in Value Per
Total
thousands) Country
Value
Asia U.S.AOil 2,572 $7,568 $487 $1,574
Copper 1,235 $3,587 $831 $928
Coal 957 $3,456 $728 $1,375
Uranium 1,542 $6,875 $427 $3,208
Silver 1,012 $3,500 $700 $1,789
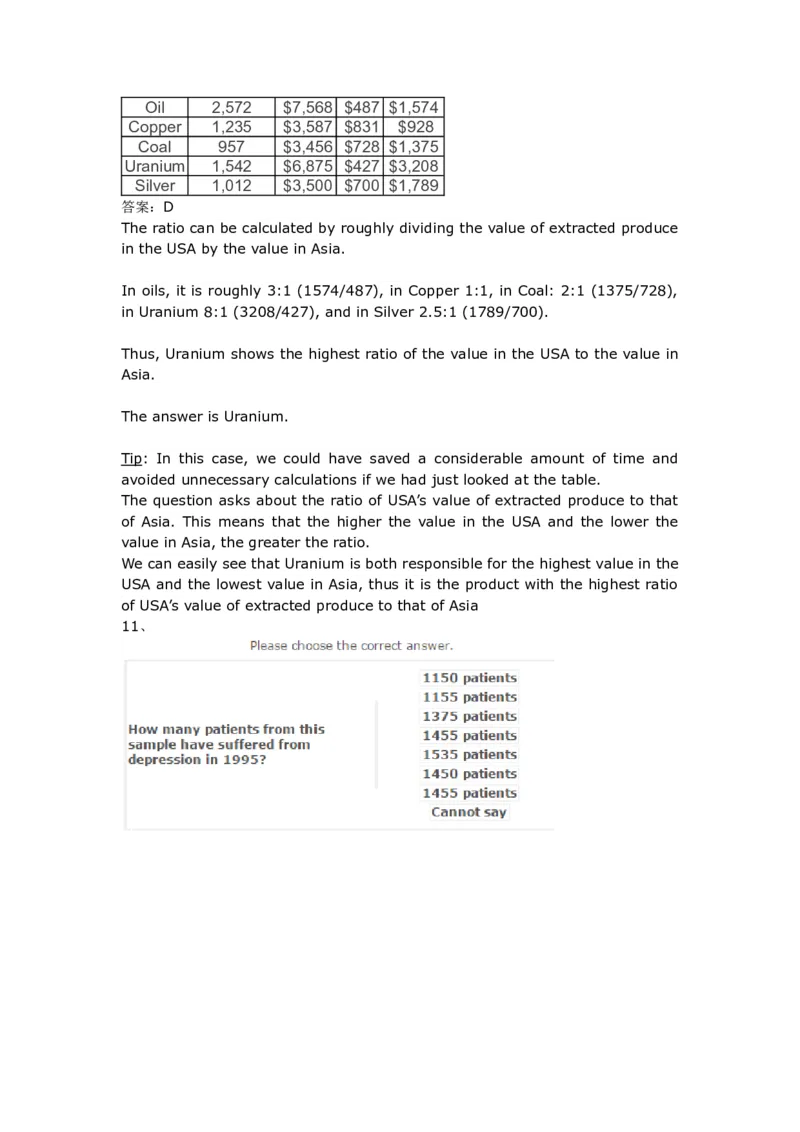
答案:D
The ratio can be calculated by roughly dividing the value of extracted produce
in the USA by the value in Asia.
In oils, it is roughly 3:1 (1574/487), in Copper 1:1, in Coal: 2:1 (1375/728),
in Uranium 8:1 (3208/427), and in Silver 2.5:1 (1789/700).
Thus, Uranium shows the highest ratio of the value in the USA to the value in
Asia.
The answer is Uranium.
Tip: In this case, we could have saved a considerable amount of time and
avoided unnecessary calculations if we had just looked at the table.
The question asks about the ratio of USA’s value of extracted produce to that
of Asia. This means that the higher the value in the USA and the lower the
value in Asia, the greater the ratio.
We can easily see that Uranium is both responsible for the highest value in the
USA and the lowest value in Asia, thus it is the product with the highest ratio
of USA’s value of extracted produce to that of Asia
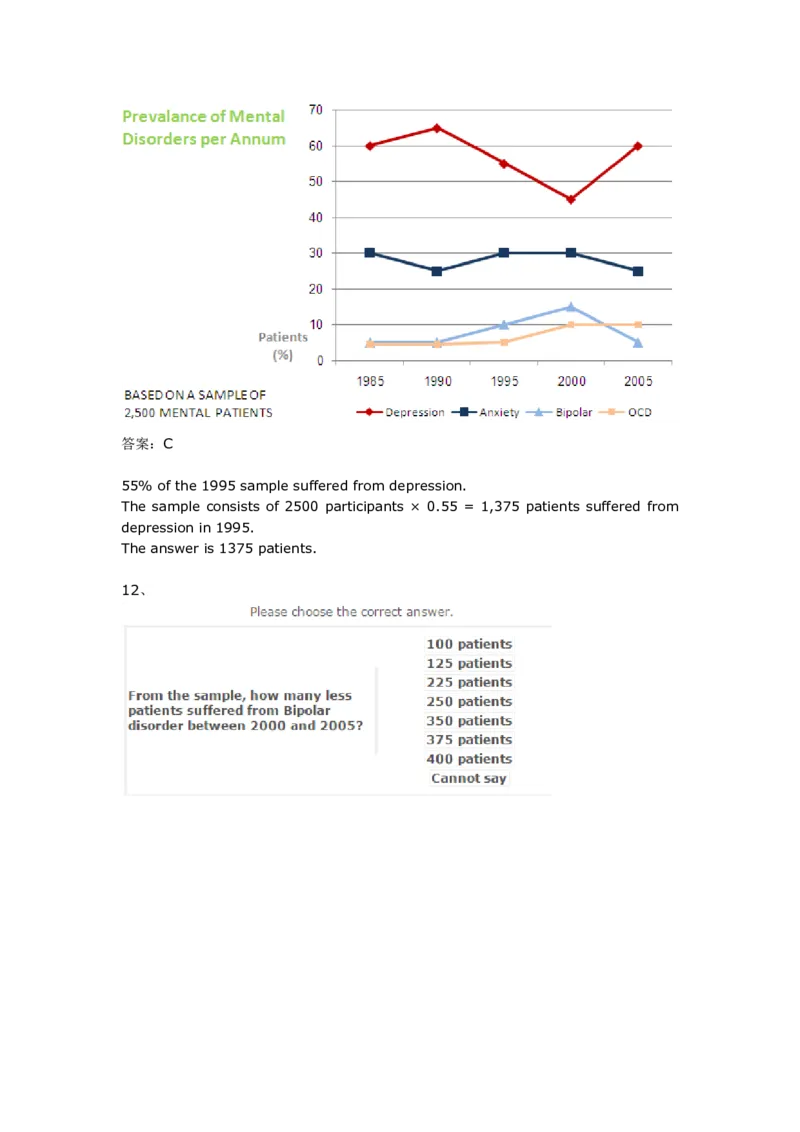
11、答案:C
55% of the 1995 sample suffered from depression.
The sample consists of 2500 participants × 0.55 = 1,375 patients suffered from
depression in 1995.
The answer is 1375 patients.
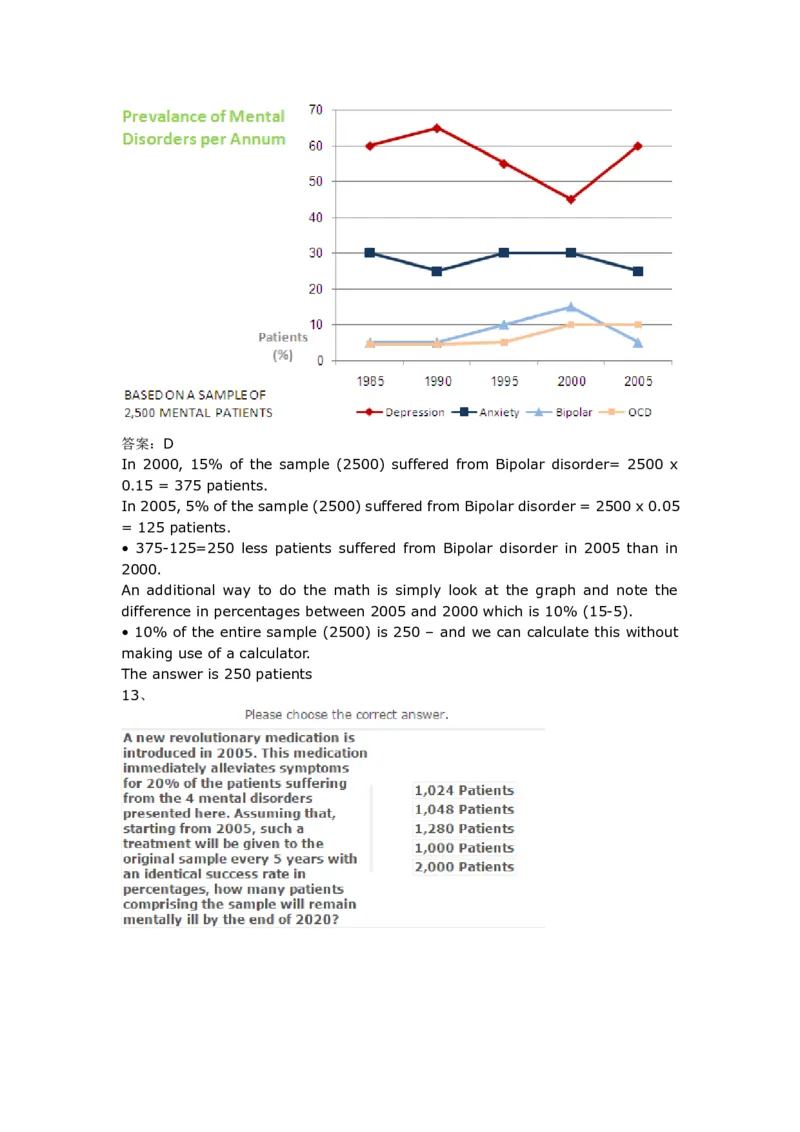
12、答案:D
In 2000, 15% of the sample (2500) suffered from Bipolar disorder= 2500 x
0.15 = 375 patients.
In 2005, 5% of the sample (2500) suffered from Bipolar disorder = 2500 x 0.05
= 125 patients.
• 375-125=250 less patients suffered from Bipolar disorder in 2005 than in
2000.
An additional way to do the math is simply look at the graph and note the
difference in percentages between 2005 and 2000 which is 10% (15-5).
• 10% of the entire sample (2500) is 250 – and we can calculate this without
making use of a calculator.
The answer is 250 patients
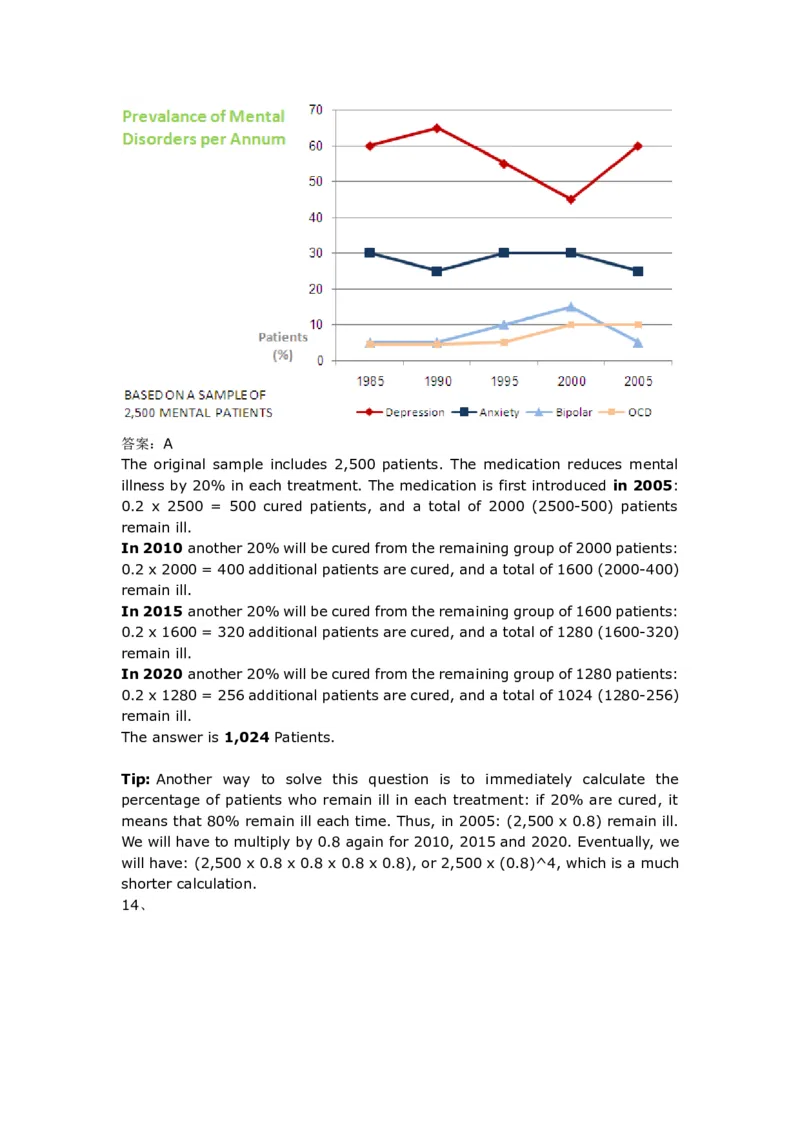
13、答案:A
The original sample includes 2,500 patients. The medication reduces mental
illness by 20% in each treatment. The medication is first introduced in 2005:
0.2 x 2500 = 500 cured patients, and a total of 2000 (2500-500) patients
remain ill.
In 2010 another 20% will be cured from the remaining group of 2000 patients:
0.2 x 2000 = 400 additional patients are cured, and a total of 1600 (2000-400)
remain ill.
In 2015 another 20% will be cured from the remaining group of 1600 patients:
0.2 x 1600 = 320 additional patients are cured, and a total of 1280 (1600-320)
remain ill.
In 2020 another 20% will be cured from the remaining group of 1280 patients:
0.2 x 1280 = 256 additional patients are cured, and a total of 1024 (1280-256)
remain ill.
The answer is 1,024 Patients.
Tip: Another way to solve this question is to immediately calculate the
percentage of patients who remain ill in each treatment: if 20% are cured, it
means that 80% remain ill each time. Thus, in 2005: (2,500 x 0.8) remain ill.
We will have to multiply by 0.8 again for 2010, 2015 and 2020. Eventually, we
will have: (2,500 x 0.8 x 0.8 x 0.8 x 0.8), or 2,500 x (0.8)^4, which is a much
shorter calculation.
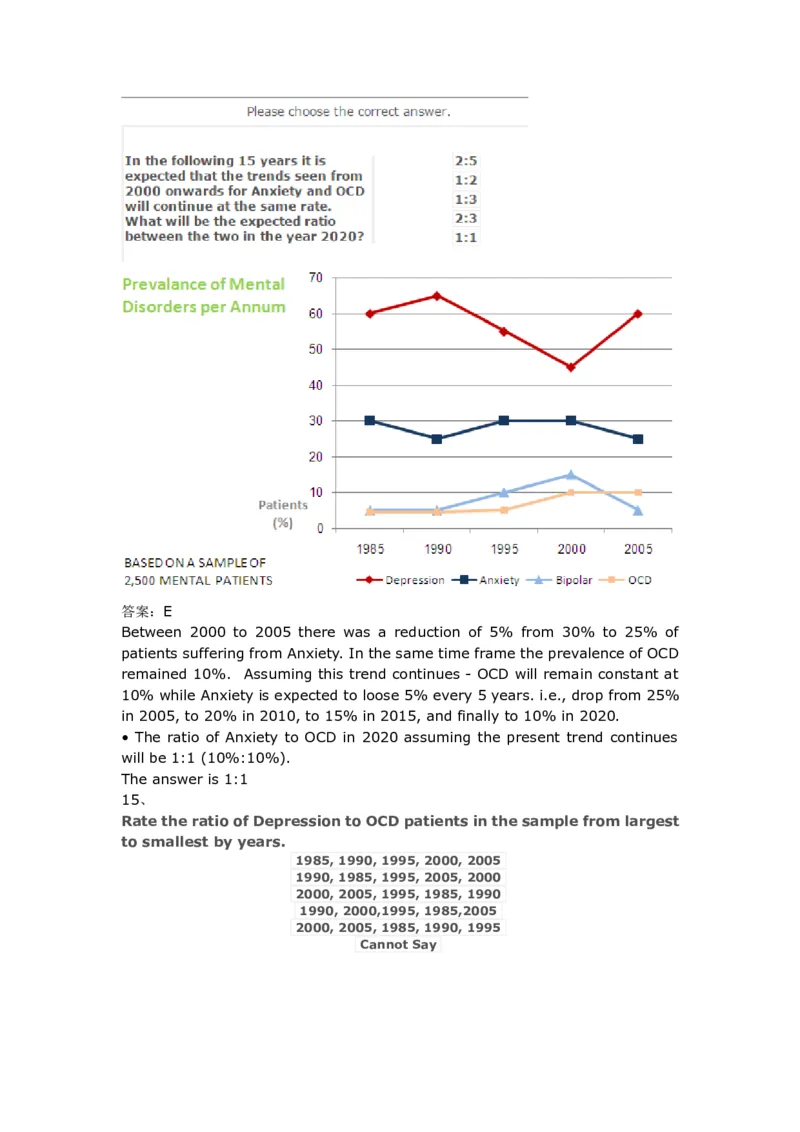
14、答案:E
Between 2000 to 2005 there was a reduction of 5% from 30% to 25% of
patients suffering from Anxiety. In the same time frame the prevalence of OCD
remained 10%. Assuming this trend continues - OCD will remain constant at
10% while Anxiety is expected to loose 5% every 5 years. i.e., drop from 25%
in 2005, to 20% in 2010, to 15% in 2015, and finally to 10% in 2020.
• The ratio of Anxiety to OCD in 2020 assuming the present trend continues
will be 1:1 (10%:10%).
The answer is 1:1
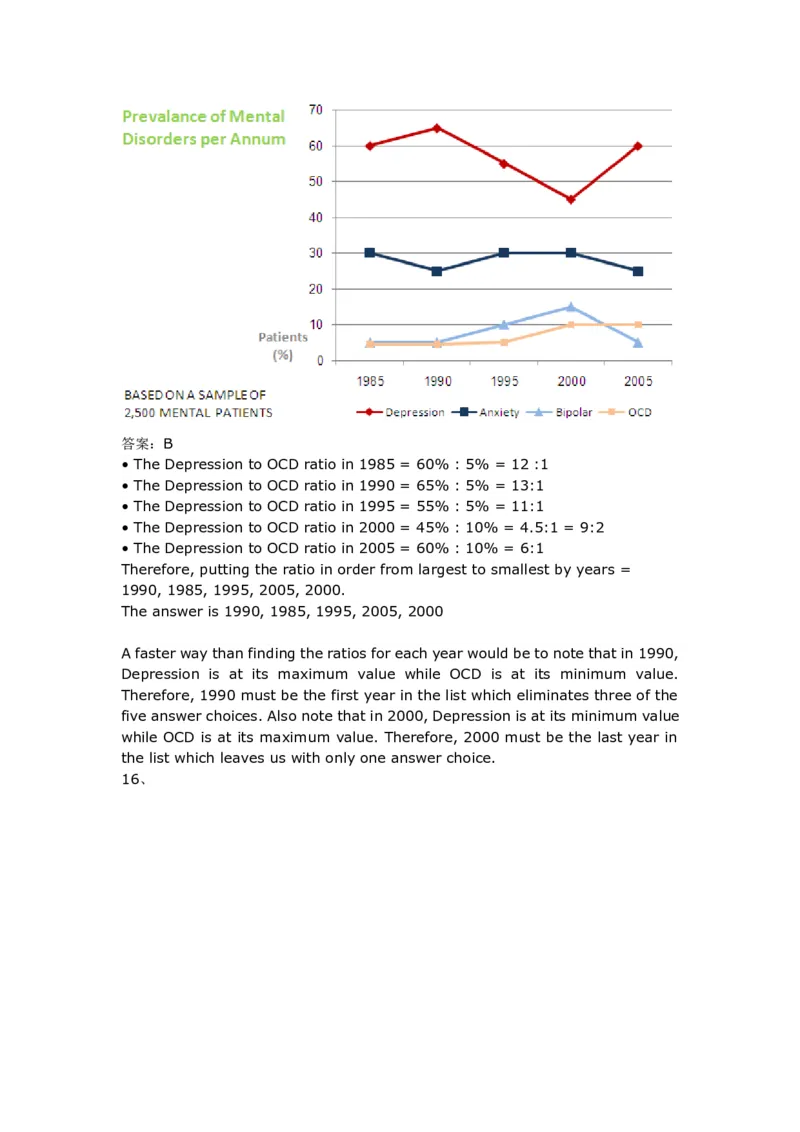
15、
Rate the ratio of Depression to OCD patients in the sample from largest
to smallest by years.
1985, 1990, 1995, 2000, 2005
1990, 1985, 1995, 2005, 2000
2000, 2005, 1995, 1985, 1990
1990, 2000,1995, 1985,2005
2000, 2005, 1985, 1990, 1995
Cannot Say答案:B
• The Depression to OCD ratio in 1985 = 60% : 5% = 12 :1
• The Depression to OCD ratio in 1990 = 65% : 5% = 13:1
• The Depression to OCD ratio in 1995 = 55% : 5% = 11:1
• The Depression to OCD ratio in 2000 = 45% : 10% = 4.5:1 = 9:2
• The Depression to OCD ratio in 2005 = 60% : 10% = 6:1
Therefore, putting the ratio in order from largest to smallest by years =
1990, 1985, 1995, 2005, 2000.
The answer is 1990, 1985, 1995, 2005, 2000
A faster way than finding the ratios for each year would be to note that in 1990,
Depression is at its maximum value while OCD is at its minimum value.
Therefore, 1990 must be the first year in the list which eliminates three of the
five answer choices. Also note that in 2000, Depression is at its minimum value
while OCD is at its maximum value. Therefore, 2000 must be the last year in
the list which leaves us with only one answer choice.
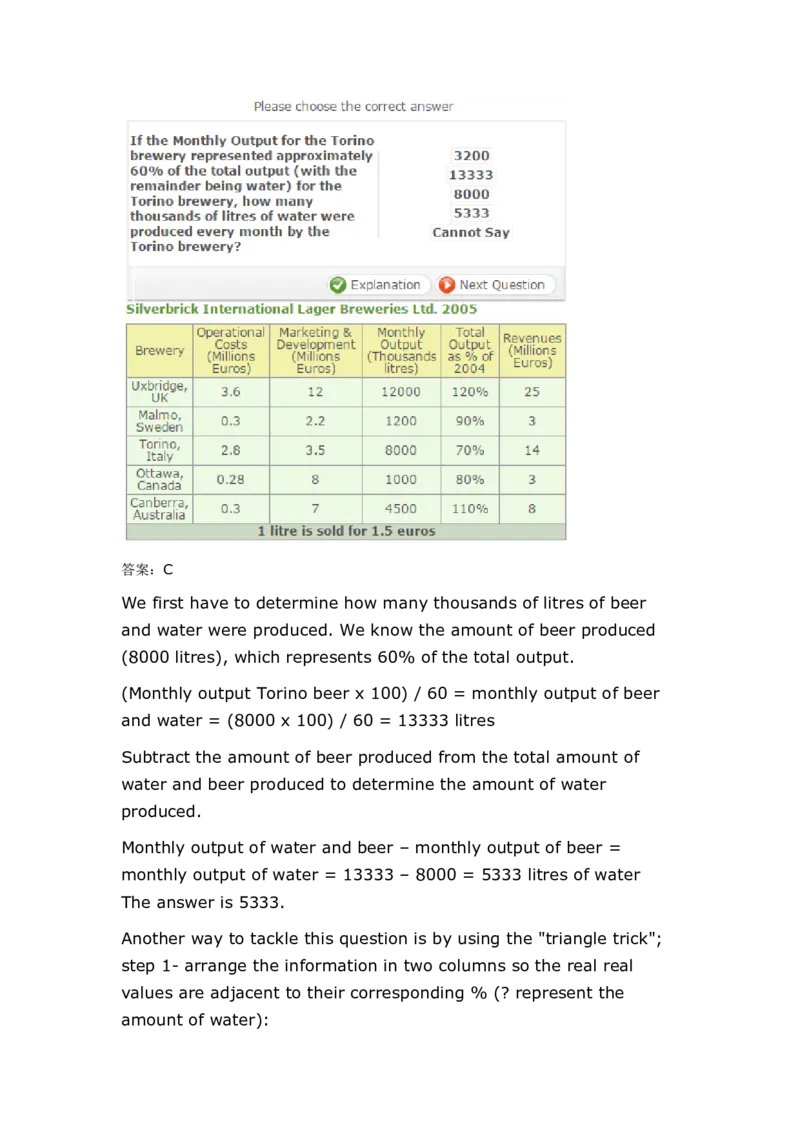
16、答案:C
We first have to determine how many thousands of litres of beer
and water were produced. We know the amount of beer produced
(8000 litres), which represents 60% of the total output.
(Monthly output Torino beer x 100) / 60 = monthly output of beer
and water = (8000 x 100) / 60 = 13333 litres
Subtract the amount of beer produced from the total amount of
water and beer produced to determine the amount of water
produced.
Monthly output of water and beer – monthly output of beer =
monthly output of water = 13333 – 8000 = 5333 litres of water
The answer is 5333.
Another way to tackle this question is by using the "triangle trick";
step 1- arrange the information in two columns so the real real
values are adjacent to their corresponding % (? represent the
amount of water):8000 60%
? 40%
Step 2- multiply the numbers along the diagonal and then divide by
the remaining number:
? = (8000/60)*40
=> The amount of water = 5333 litres.
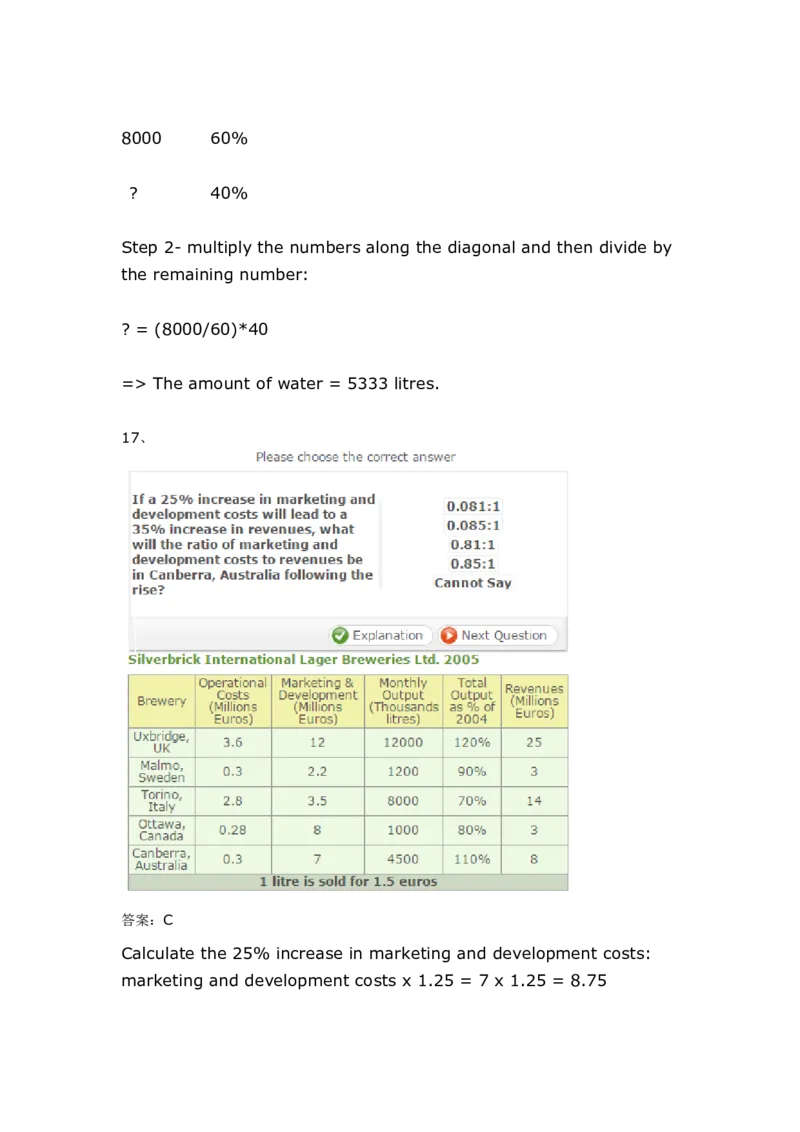
17、
答案:C
Calculate the 25% increase in marketing and development costs:
marketing and development costs x 1.25 = 7 x 1.25 = 8.75Calculate the 35% increase in revenues: revenues x 1.35 = 8 x
1.35 = 10.8
Calculate the new ratio for marketing and development costs to
revenues = 8.75 / 10.8 = 0.81
The answer is 0.81:1.
18、
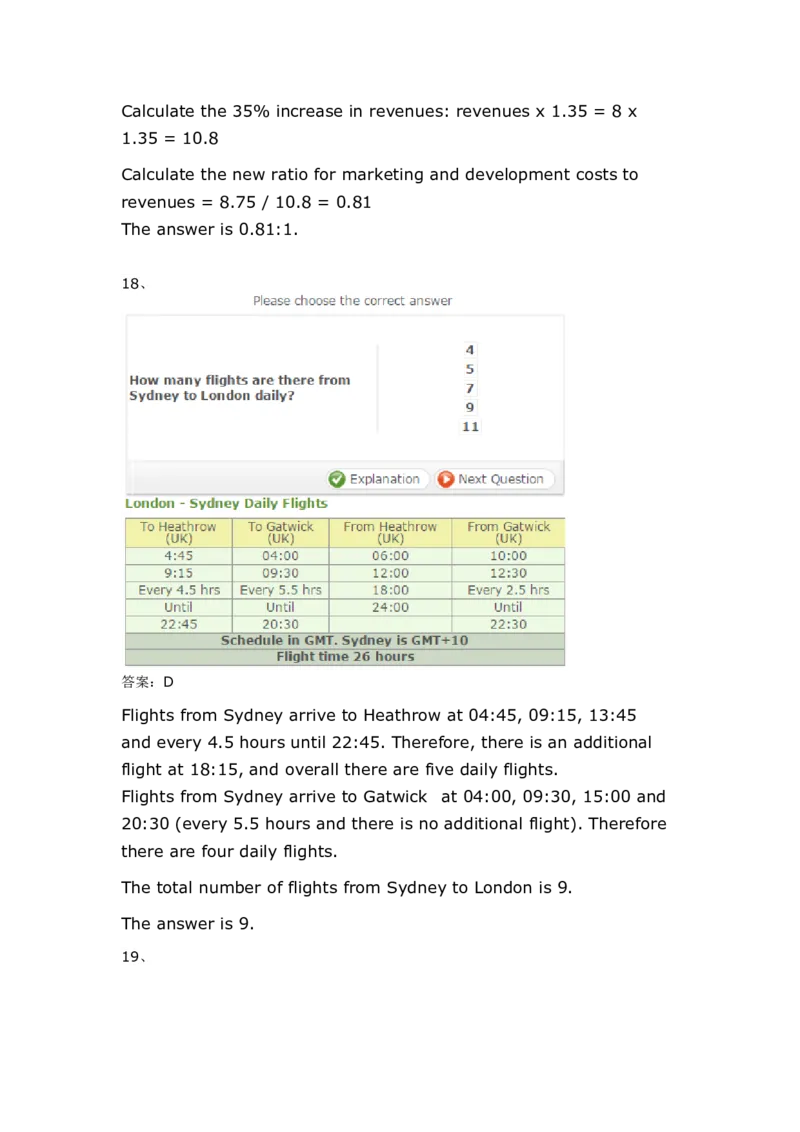
答案:D
Flights from Sydney arrive to Heathrow at 04:45, 09:15, 13:45
and every 4.5 hours until 22:45. Therefore, there is an additional
flight at 18:15, and overall there are five daily flights.
Flights from Sydney arrive to Gatwick at 04:00, 09:30, 15:00 and
20:30 (every 5.5 hours and there is no additional flight). Therefore
there are four daily flights.
The total number of flights from Sydney to London is 9.
The answer is 9.
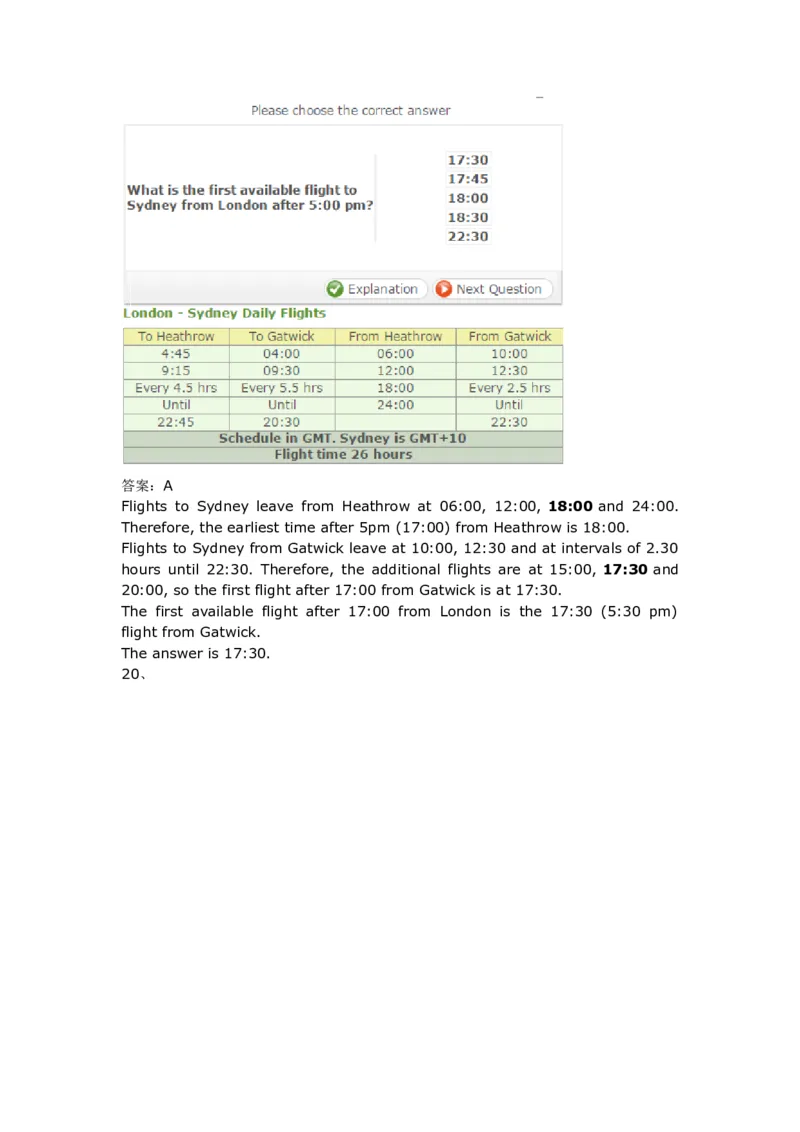
19、答案:A
Flights to Sydney leave from Heathrow at 06:00, 12:00, 18:00 and 24:00.
Therefore, the earliest time after 5pm (17:00) from Heathrow is 18:00.
Flights to Sydney from Gatwick leave at 10:00, 12:30 and at intervals of 2.30
hours until 22:30. Therefore, the additional flights are at 15:00, 17:30 and
20:00, so the first flight after 17:00 from Gatwick is at 17:30.
The first available flight after 17:00 from London is the 17:30 (5:30 pm)
flight from Gatwick.
The answer is 17:30.
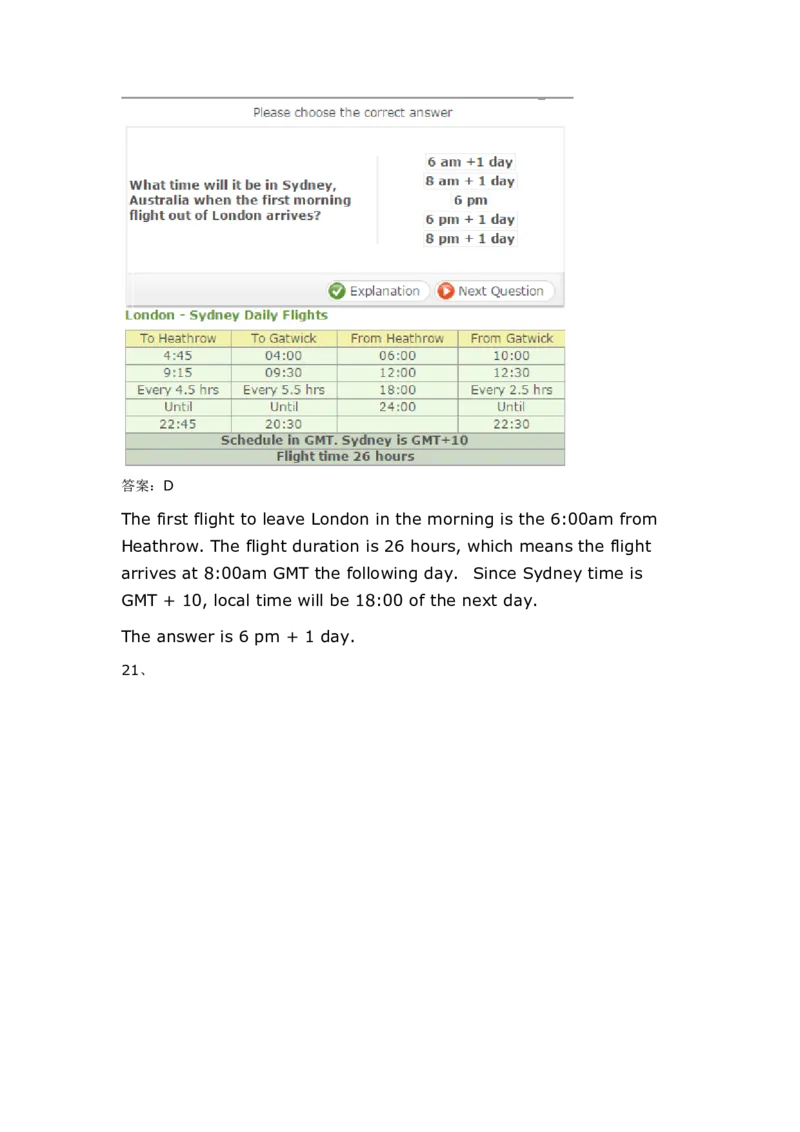
20、答案:D
The first flight to leave London in the morning is the 6:00am from
Heathrow. The flight duration is 26 hours, which means the flight
arrives at 8:00am GMT the following day. Since Sydney time is
GMT + 10, local time will be 18:00 of the next day.
The answer is 6 pm + 1 day.
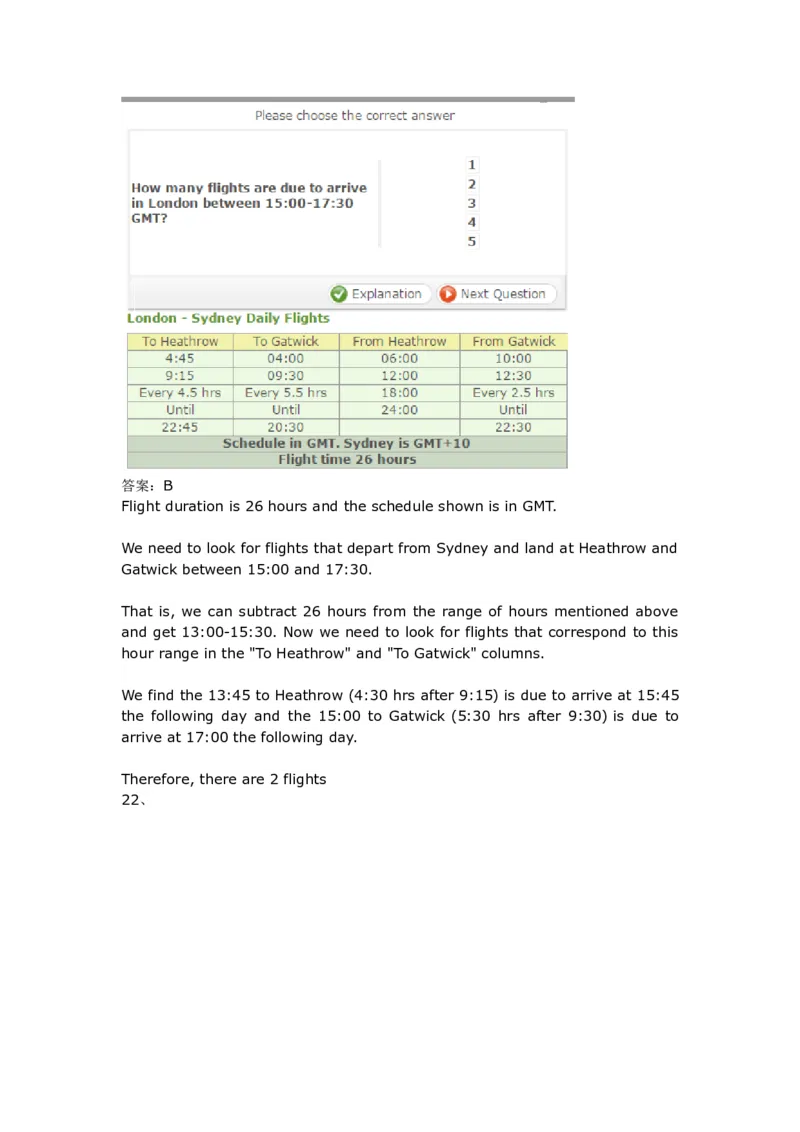
21、答案:B
Flight duration is 26 hours and the schedule shown is in GMT.
We need to look for flights that depart from Sydney and land at Heathrow and
Gatwick between 15:00 and 17:30.
That is, we can subtract 26 hours from the range of hours mentioned above
and get 13:00-15:30. Now we need to look for flights that correspond to this
hour range in the "To Heathrow" and "To Gatwick" columns.
We find the 13:45 to Heathrow (4:30 hrs after 9:15) is due to arrive at 15:45
the following day and the 15:00 to Gatwick (5:30 hrs after 9:30) is due to
arrive at 17:00 the following day.
Therefore, there are 2 flights
22、答案: E
Since the flight duration is more than 24 hours, there is no possibility of reaching
Australia the same day.
The answer is No Flight.
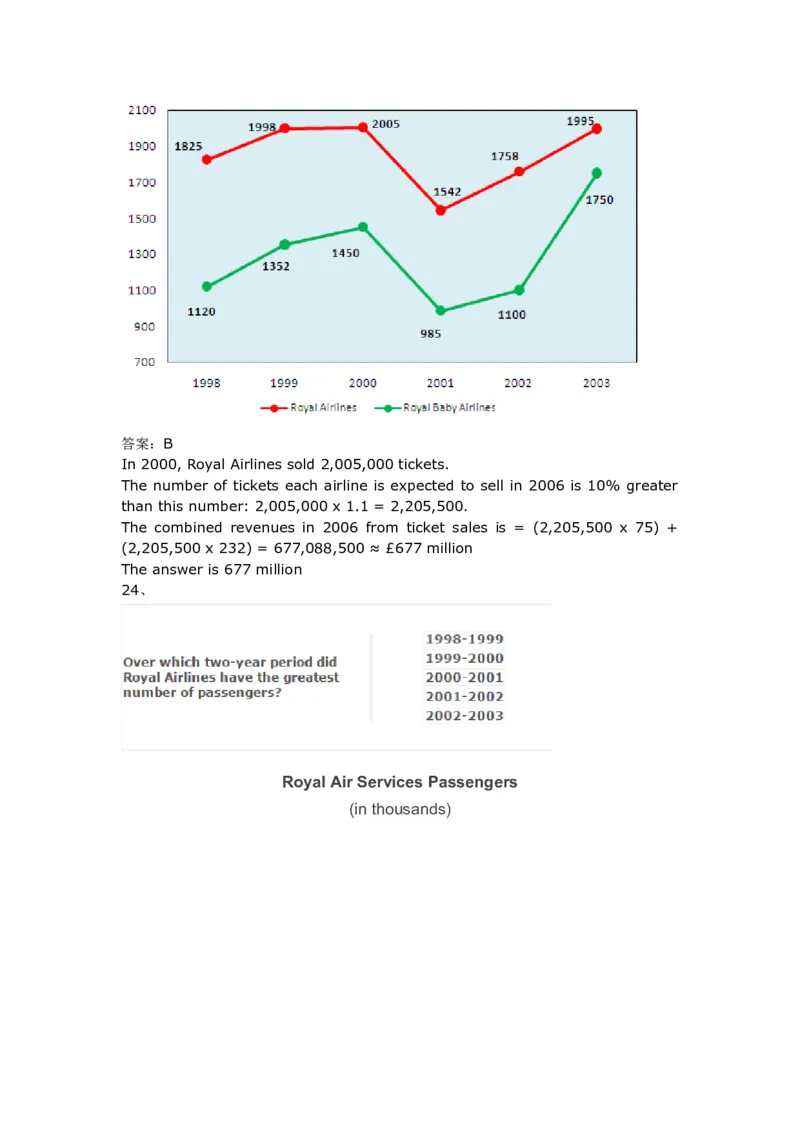
23、答案:B
In 2000, Royal Airlines sold 2,005,000 tickets.
The number of tickets each airline is expected to sell in 2006 is 10% greater
than this number: 2,005,000 x 1.1 = 2,205,500.
The combined revenues in 2006 from ticket sales is = (2,205,500 x 75) +
(2,205,500 x 232) = 677,088,500 ≈ £677 million
The answer is 677 million
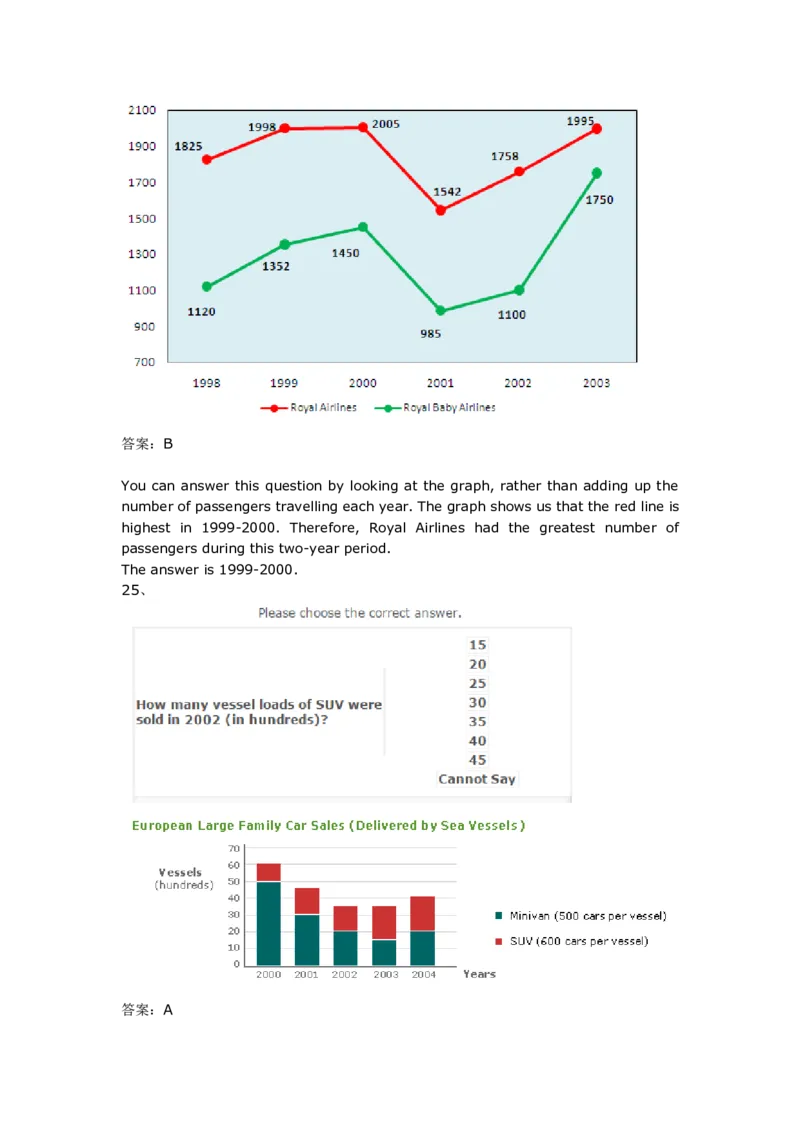
24、
Royal Air Services Passengers
(in thousands)答案:B
You can answer this question by looking at the graph, rather than adding up the
number of passengers travelling each year. The graph shows us that the red line is
highest in 1999-2000. Therefore, Royal Airlines had the greatest number of
passengers during this two-year period.
The answer is 1999-2000.
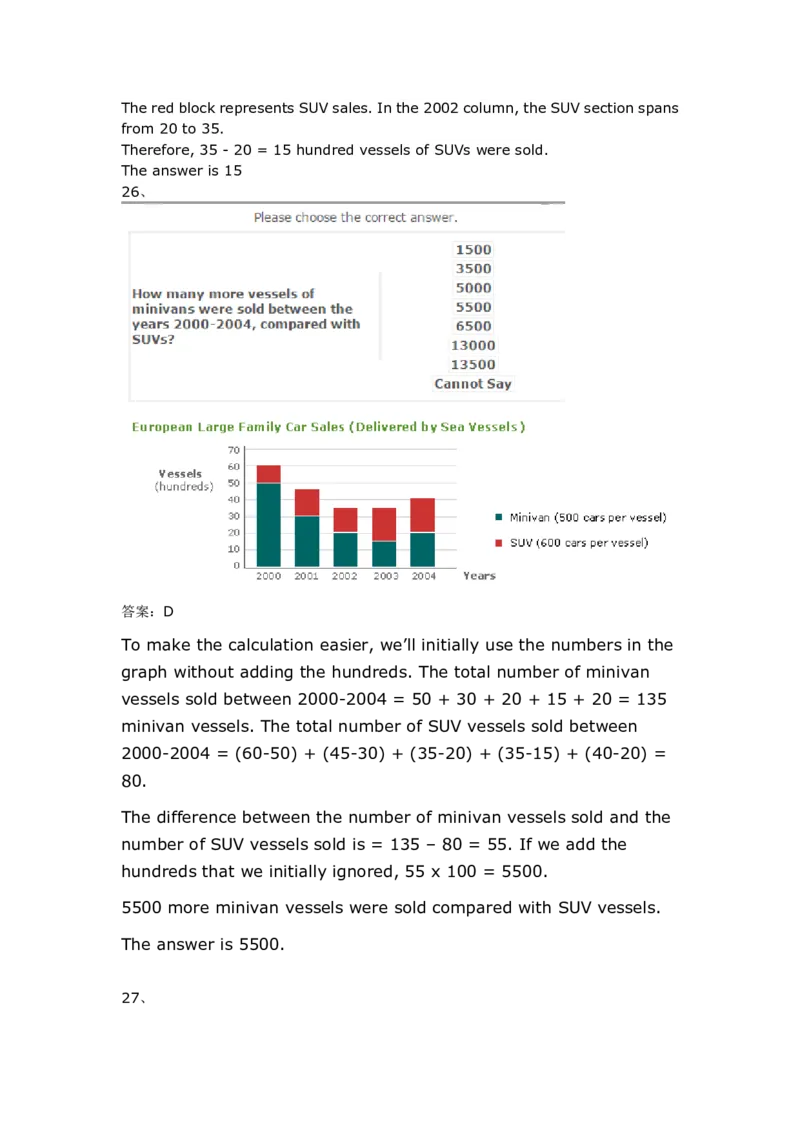
25、
答案:AThe red block represents SUV sales. In the 2002 column, the SUV section spans
from 20 to 35.
Therefore, 35 - 20 = 15 hundred vessels of SUVs were sold.
The answer is 15
26、
答案:D
To make the calculation easier, we’ll initially use the numbers in the
graph without adding the hundreds. The total number of minivan
vessels sold between 2000-2004 = 50 + 30 + 20 + 15 + 20 = 135
minivan vessels. The total number of SUV vessels sold between
2000-2004 = (60-50) + (45-30) + (35-20) + (35-15) + (40-20) =
80.
The difference between the number of minivan vessels sold and the
number of SUV vessels sold is = 135 – 80 = 55. If we add the
hundreds that we initially ignored, 55 x 100 = 5500.
5500 more minivan vessels were sold compared with SUV vessels.
The answer is 5500.
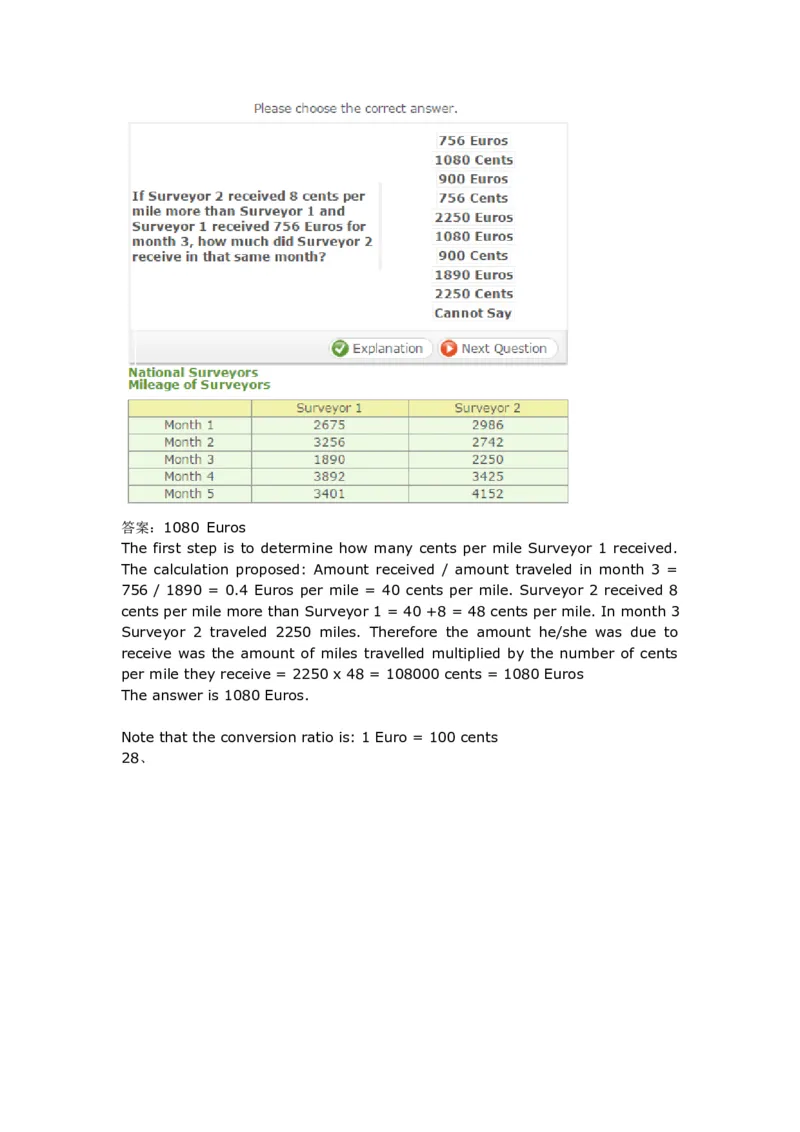
27、答案:1080 Euros
The first step is to determine how many cents per mile Surveyor 1 received.
The calculation proposed: Amount received / amount traveled in month 3 =
756 / 1890 = 0.4 Euros per mile = 40 cents per mile. Surveyor 2 received 8
cents per mile more than Surveyor 1 = 40 +8 = 48 cents per mile. In month 3
Surveyor 2 traveled 2250 miles. Therefore the amount he/she was due to
receive was the amount of miles travelled multiplied by the number of cents
per mile they receive = 2250 x 48 = 108000 cents = 1080 Euros
The answer is 1080 Euros.
Note that the conversion ratio is: 1 Euro = 100 cents
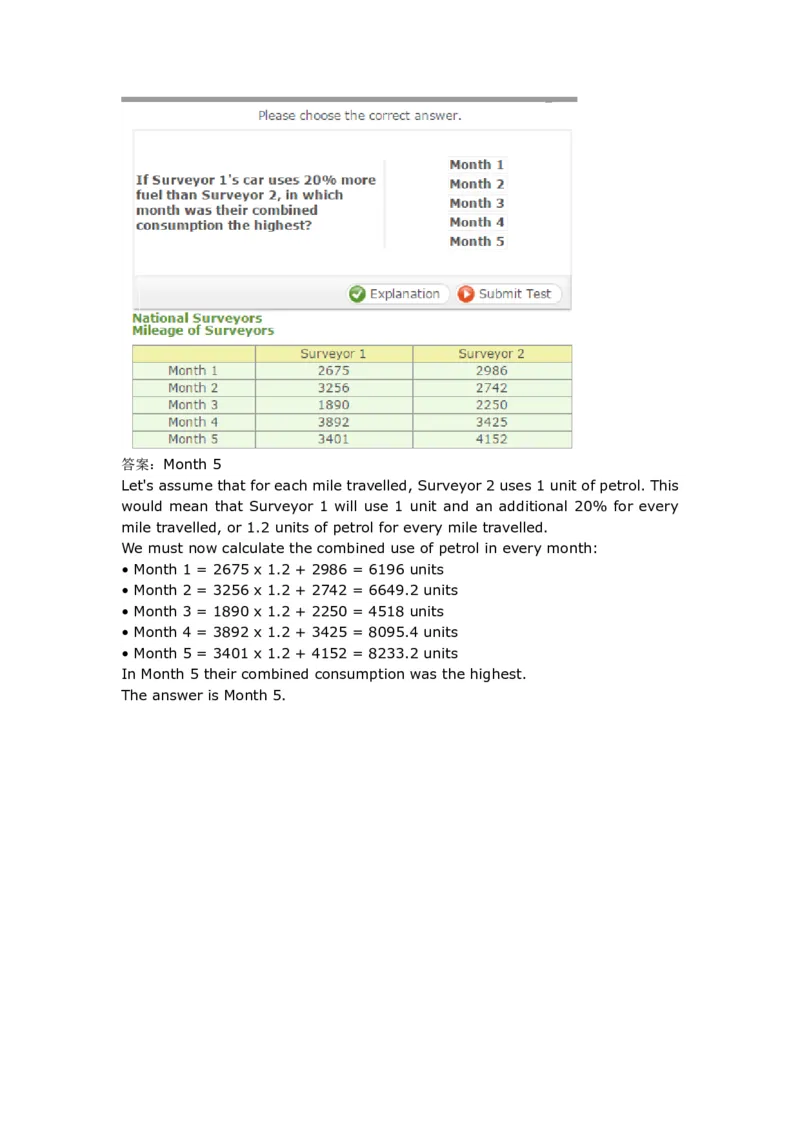
28、答案:Month 5
Let's assume that for each mile travelled, Surveyor 2 uses 1 unit of petrol. This
would mean that Surveyor 1 will use 1 unit and an additional 20% for every
mile travelled, or 1.2 units of petrol for every mile travelled.
We must now calculate the combined use of petrol in every month:
• Month 1 = 2675 x 1.2 + 2986 = 6196 units
• Month 2 = 3256 x 1.2 + 2742 = 6649.2 units
• Month 3 = 1890 x 1.2 + 2250 = 4518 units
• Month 4 = 3892 x 1.2 + 3425 = 8095.4 units
• Month 5 = 3401 x 1.2 + 4152 = 8233.2 units
In Month 5 their combined consumption was the highest.
The answer is Month 5.

