文档内容
1、
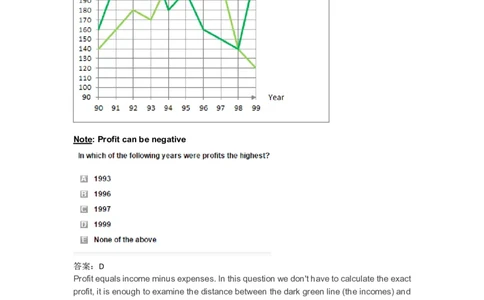
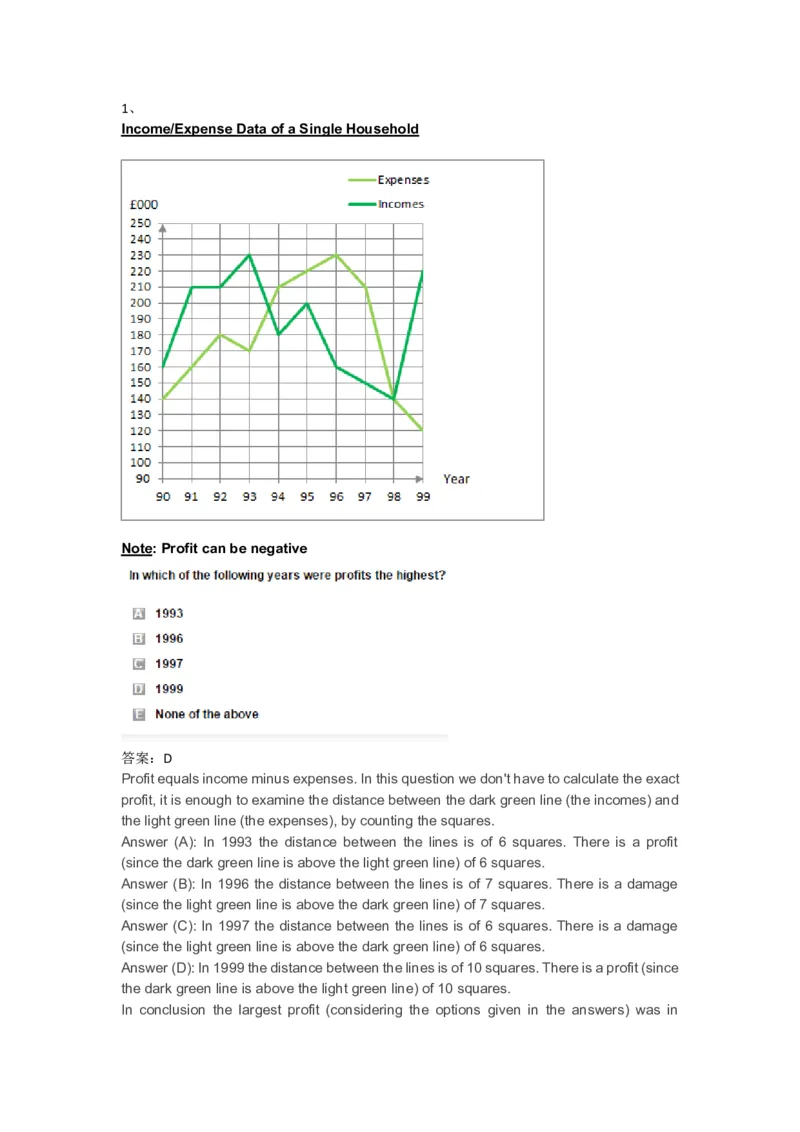
Income/Expense Data of a Single Household
Note: Profit can be negative
答案:D
Profit equals income minus expenses. In this question we don't have to calculate the exact
profit, it is enough to examine the distance between the dark green line (the incomes) and
the light green line (the expenses), by counting the squares.
Answer (A): In 1993 the distance between the lines is of 6 squares. There is a profit
(since the dark green line is above the light green line) of 6 squares.
Answer (B): In 1996 the distance between the lines is of 7 squares. There is a damage
(since the light green line is above the dark green line) of 7 squares.
Answer (C): In 1997 the distance between the lines is of 6 squares. There is a damage
(since the light green line is above the dark green line) of 6 squares.
Answer (D): In 1999 the distance between the lines is of 10 squares. There is a profit (since
the dark green line is above the light green line) of 10 squares.
In conclusion the largest profit (considering the options given in the answers) was in1999.
2、
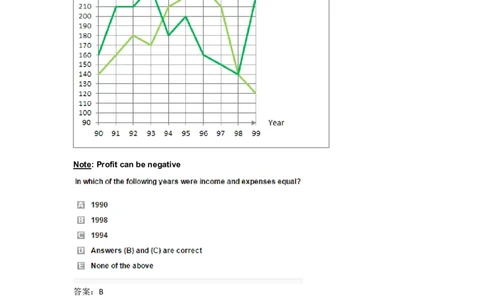
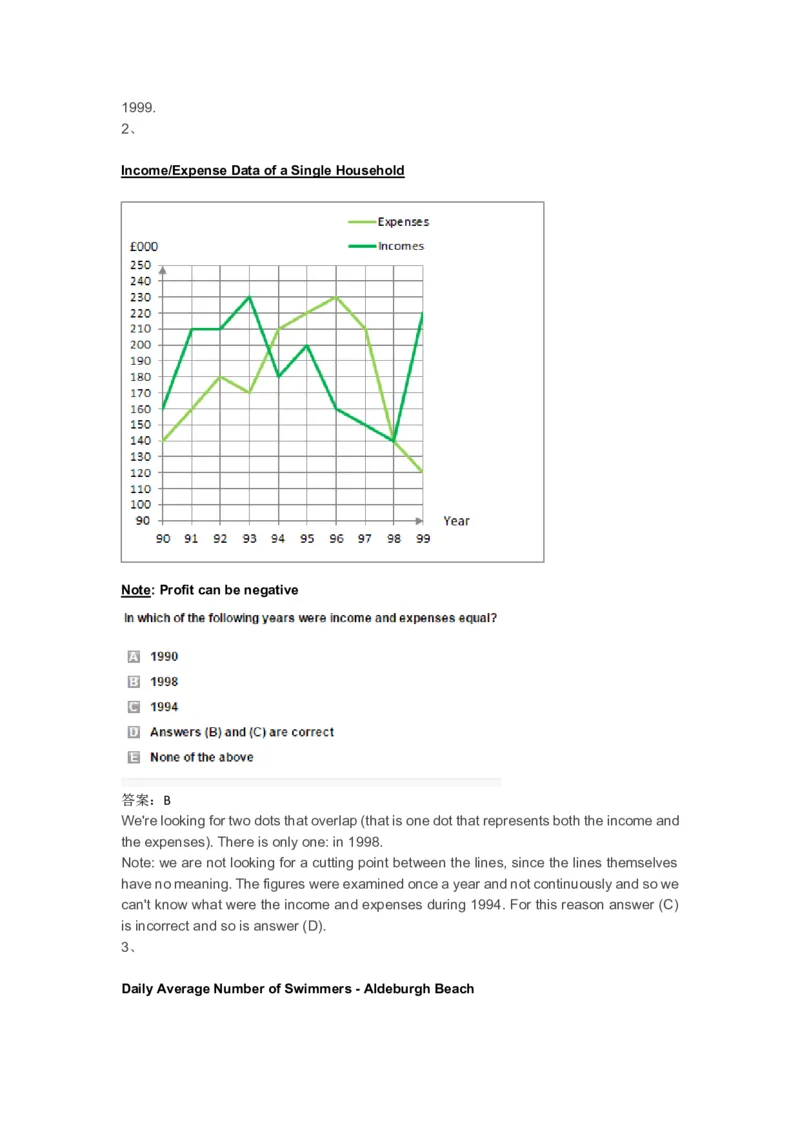
Income/Expense Data of a Single Household
Note: Profit can be negative
答案:B
We're looking for two dots that overlap (that is one dot that represents both the income and
the expenses). There is only one: in 1998.
Note: we are not looking for a cutting point between the lines, since the lines themselves
have no meaning. The figures were examined once a year and not continuously and so we
can't know what were the income and expenses during 1994. For this reason answer (C)
is incorrect and so is answer (D).
3、
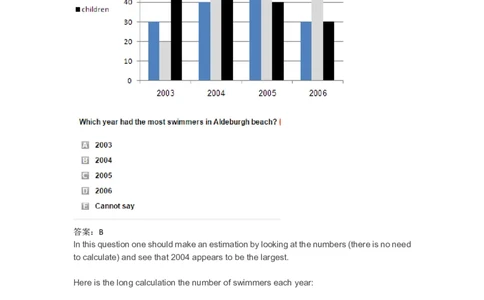
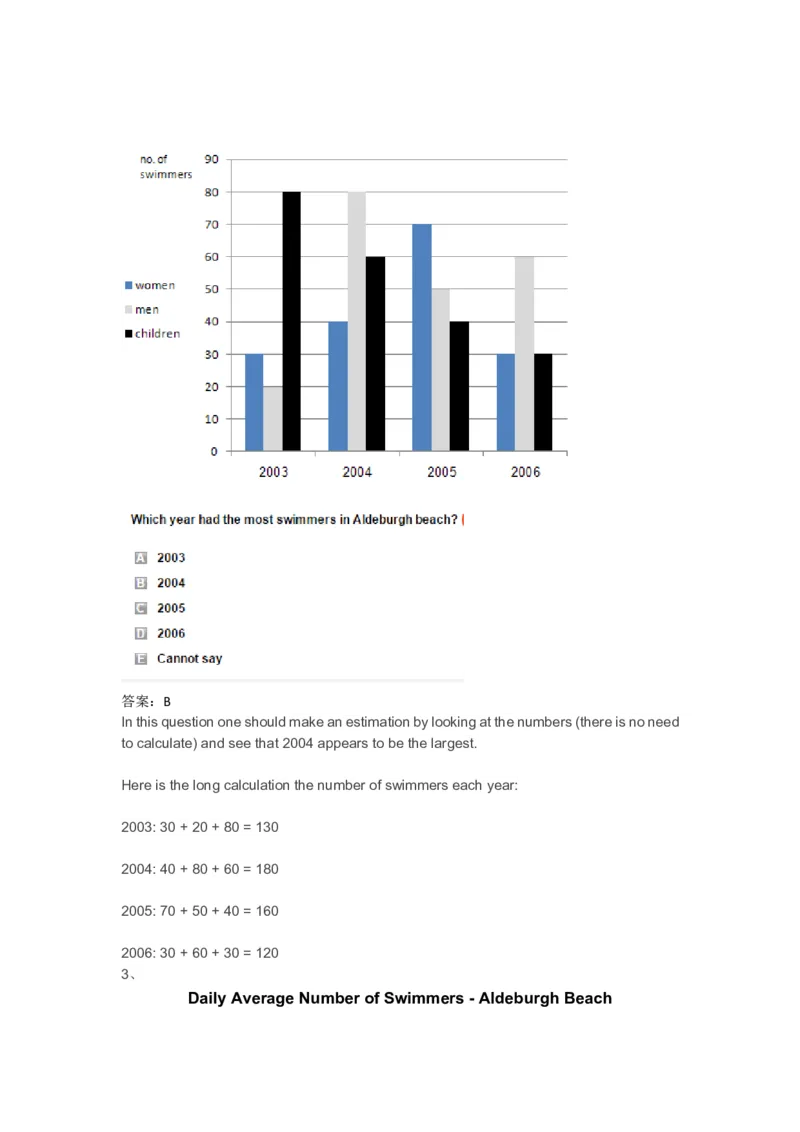
Daily Average Number of Swimmers - Aldeburgh Beach答案:B
In this question one should make an estimation by looking at the numbers (there is no need
to calculate) and see that 2004 appears to be the largest.
Here is the long calculation the number of swimmers each year:
2003: 30 + 20 + 80 = 130
2004: 40 + 80 + 60 = 180
2005: 70 + 50 + 40 = 160
2006: 30 + 60 + 30 = 120
3、
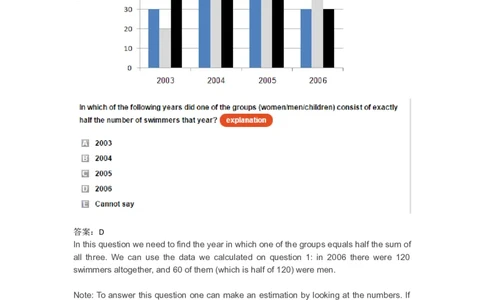
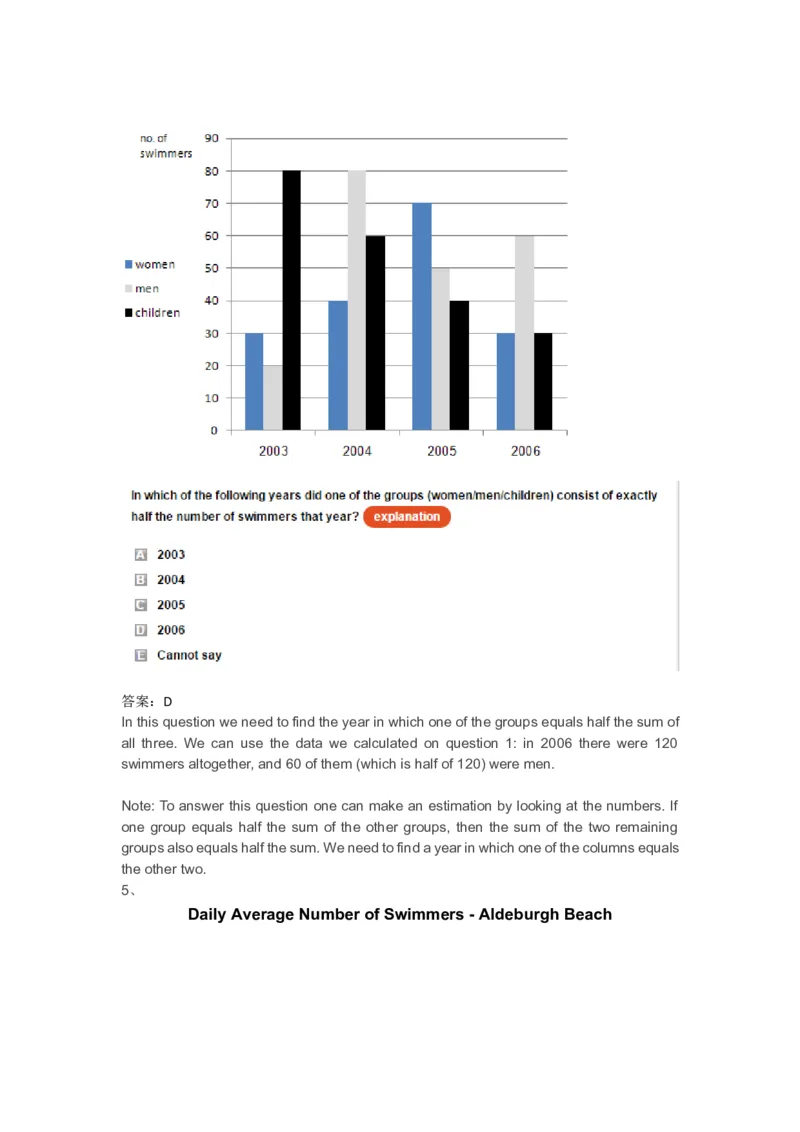
Daily Average Number of Swimmers - Aldeburgh Beach答案:D
In this question we need to find the year in which one of the groups equals half the sum of
all three. We can use the data we calculated on question 1: in 2006 there were 120
swimmers altogether, and 60 of them (which is half of 120) were men.
Note: To answer this question one can make an estimation by looking at the numbers. If
one group equals half the sum of the other groups, then the sum of the two remaining
groups also equals half the sum. We need to find a year in which one of the columns equals
the other two.
5、
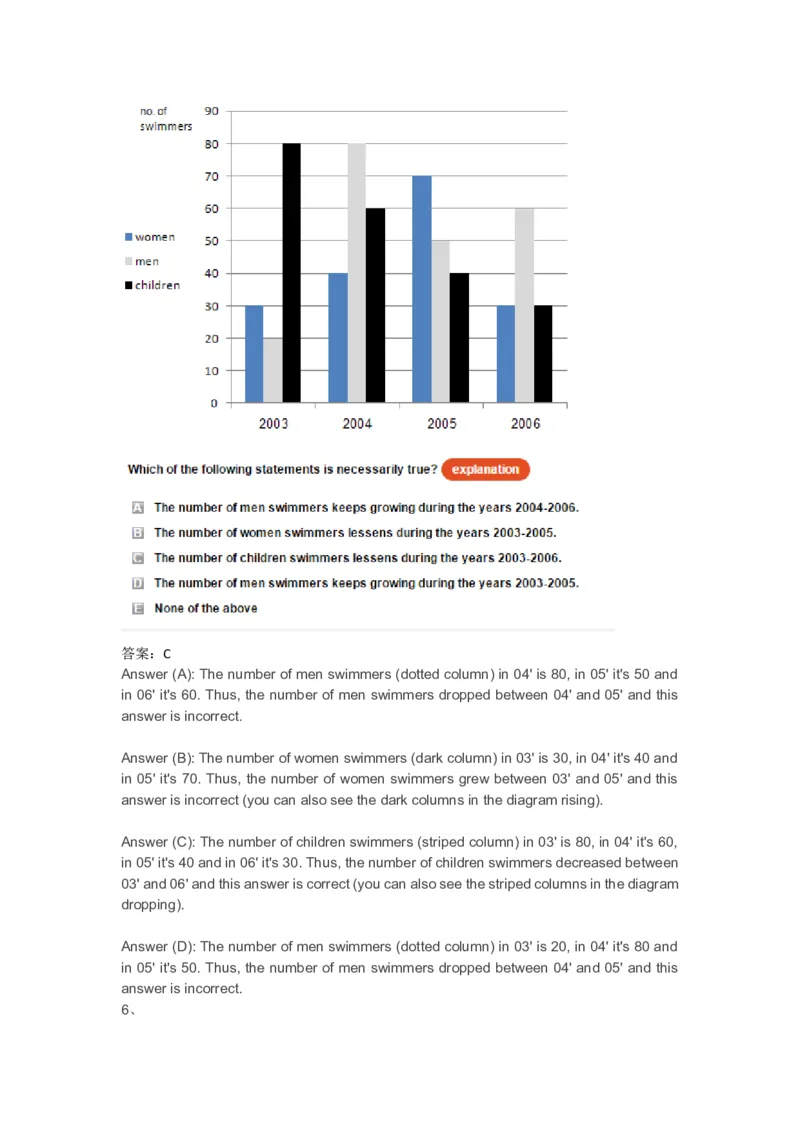
Daily Average Number of Swimmers - Aldeburgh Beach答案:C
Answer (A): The number of men swimmers (dotted column) in 04' is 80, in 05' it's 50 and
in 06' it's 60. Thus, the number of men swimmers dropped between 04' and 05' and this
answer is incorrect.
Answer (B): The number of women swimmers (dark column) in 03' is 30, in 04' it's 40 and
in 05' it's 70. Thus, the number of women swimmers grew between 03' and 05' and this
answer is incorrect (you can also see the dark columns in the diagram rising).
Answer (C): The number of children swimmers (striped column) in 03' is 80, in 04' it's 60,
in 05' it's 40 and in 06' it's 30. Thus, the number of children swimmers decreased between
03' and 06' and this answer is correct (you can also see the striped columns in the diagram
dropping).
Answer (D): The number of men swimmers (dotted column) in 03' is 20, in 04' it's 80 and
in 05' it's 50. Thus, the number of men swimmers dropped between 04' and 05' and this
answer is incorrect.
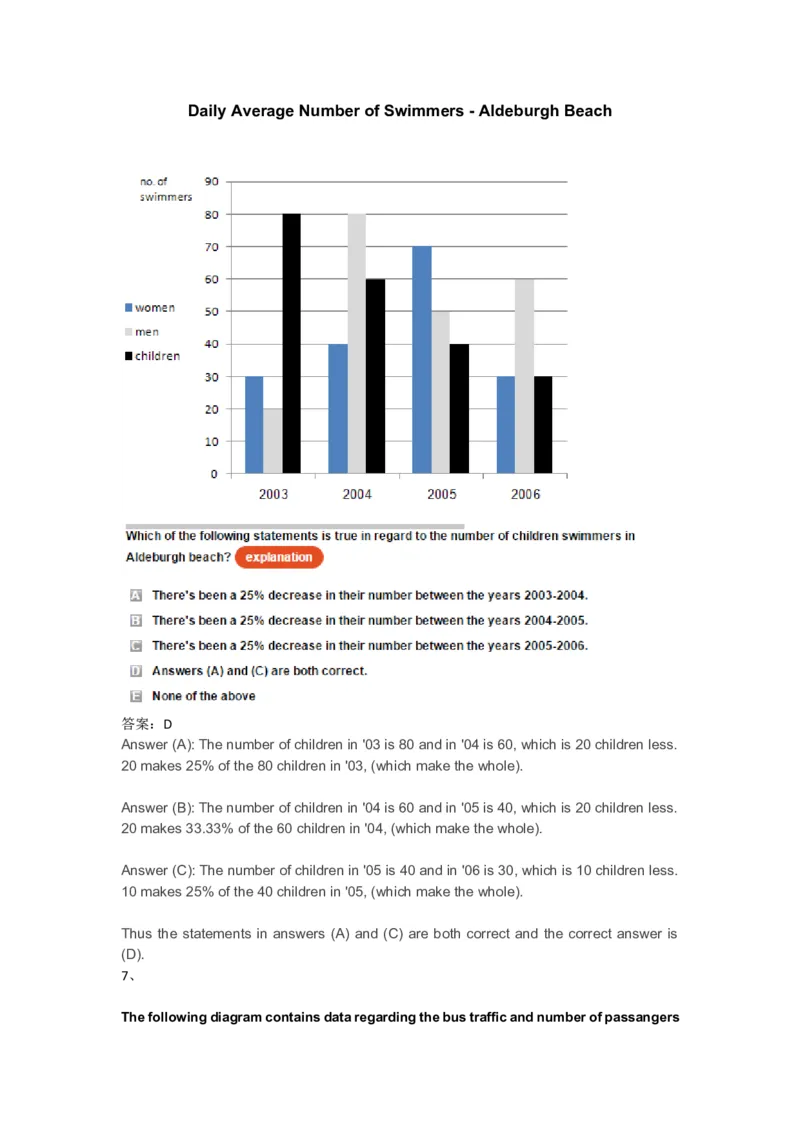
6、Daily Average Number of Swimmers - Aldeburgh Beach
答案:D
Answer (A): The number of children in '03 is 80 and in '04 is 60, which is 20 children less.
20 makes 25% of the 80 children in '03, (which make the whole).
Answer (B): The number of children in '04 is 60 and in '05 is 40, which is 20 children less.
20 makes 33.33% of the 60 children in '04, (which make the whole).
Answer (C): The number of children in '05 is 40 and in '06 is 30, which is 10 children less.
10 makes 25% of the 40 children in '05, (which make the whole).
Thus the statements in answers (A) and (C) are both correct and the correct answer is
(D).
7、
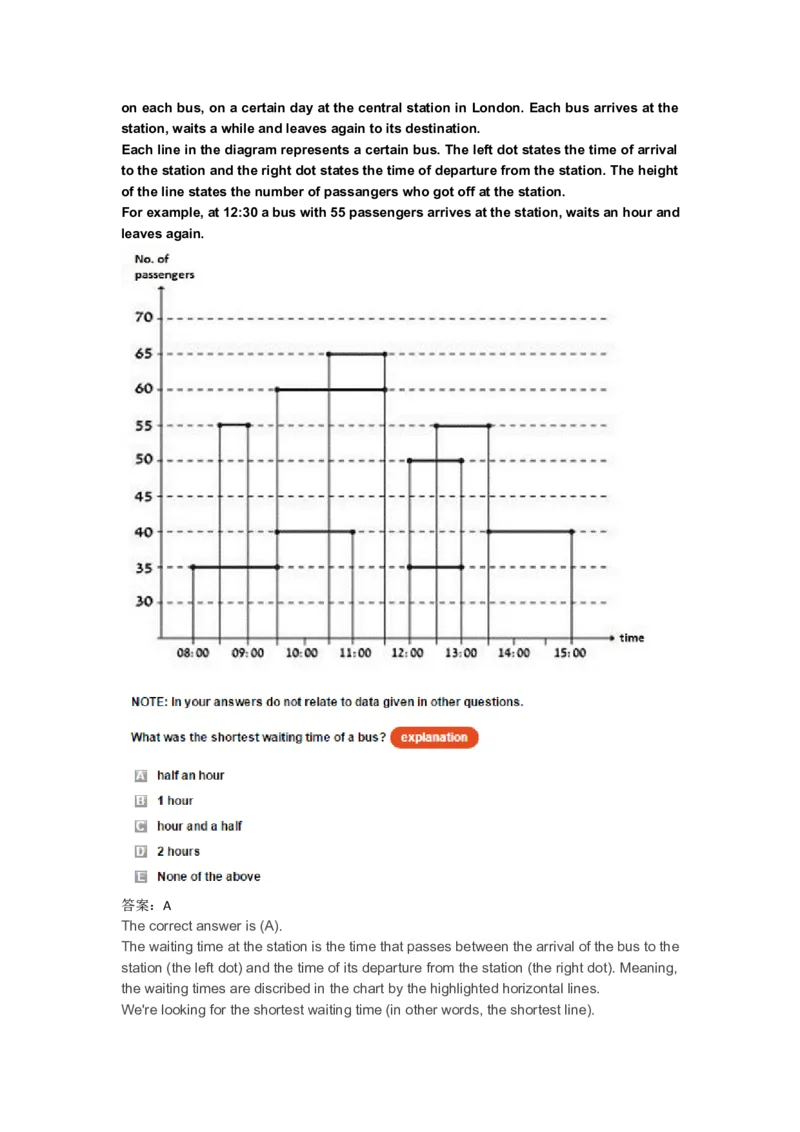
The following diagram contains data regarding the bus traffic and number of passangerson each bus, on a certain day at the central station in London. Each bus arrives at the
station, waits a while and leaves again to its destination.
Each line in the diagram represents a certain bus. The left dot states the time of arrival
to the station and the right dot states the time of departure from the station. The height
of the line states the number of passangers who got off at the station.
For example, at 12:30 a bus with 55 passengers arrives at the station, waits an hour and
leaves again.
答案:A
The correct answer is (A).
The waiting time at the station is the time that passes between the arrival of the bus to the
station (the left dot) and the time of its departure from the station (the right dot). Meaning,
the waiting times are discribed in the chart by the highlighted horizontal lines.
We're looking for the shortest waiting time (in other words, the shortest line).The shortest horizontal line is half an hour (the bus that arrived at the station at 8:30 and
left at 9:00).
8、
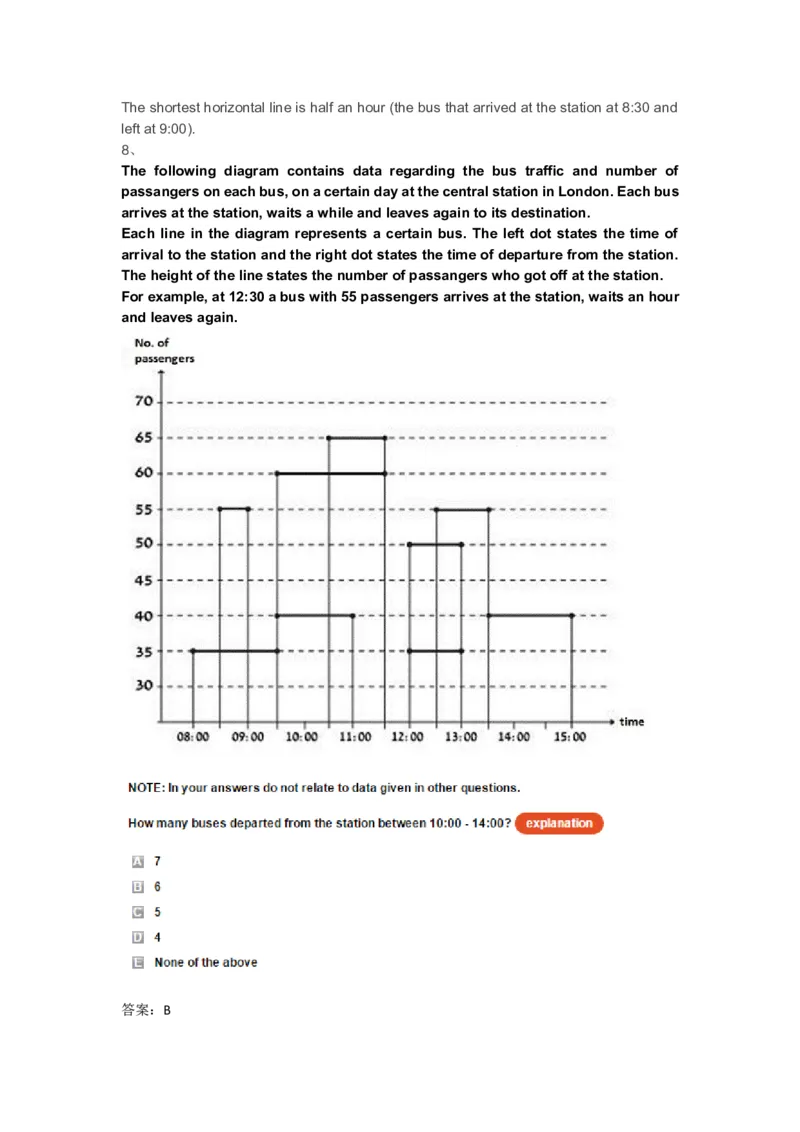
The following diagram contains data regarding the bus traffic and number of
passangers on each bus, on a certain day at the central station in London. Each bus
arrives at the station, waits a while and leaves again to its destination.
Each line in the diagram represents a certain bus. The left dot states the time of
arrival to the station and the right dot states the time of departure from the station.
The height of the line states the number of passangers who got off at the station.
For example, at 12:30 a bus with 55 passengers arrives at the station, waits an hour
and leaves again.
答案:BThe correct answer is (B).
The right dot of the highlighted line states a departure of a bus from the station and so in
order to find the number of buses that departed between 10:00 - 14:00, we need to look
for all the lines that have their right dot within the relevant hours.
We'll count the number of right dots between 10:00 - 14:00 and find six dots: one at 11:00,
two at 11:30, two at 13:00 and one at 13:30.
9、
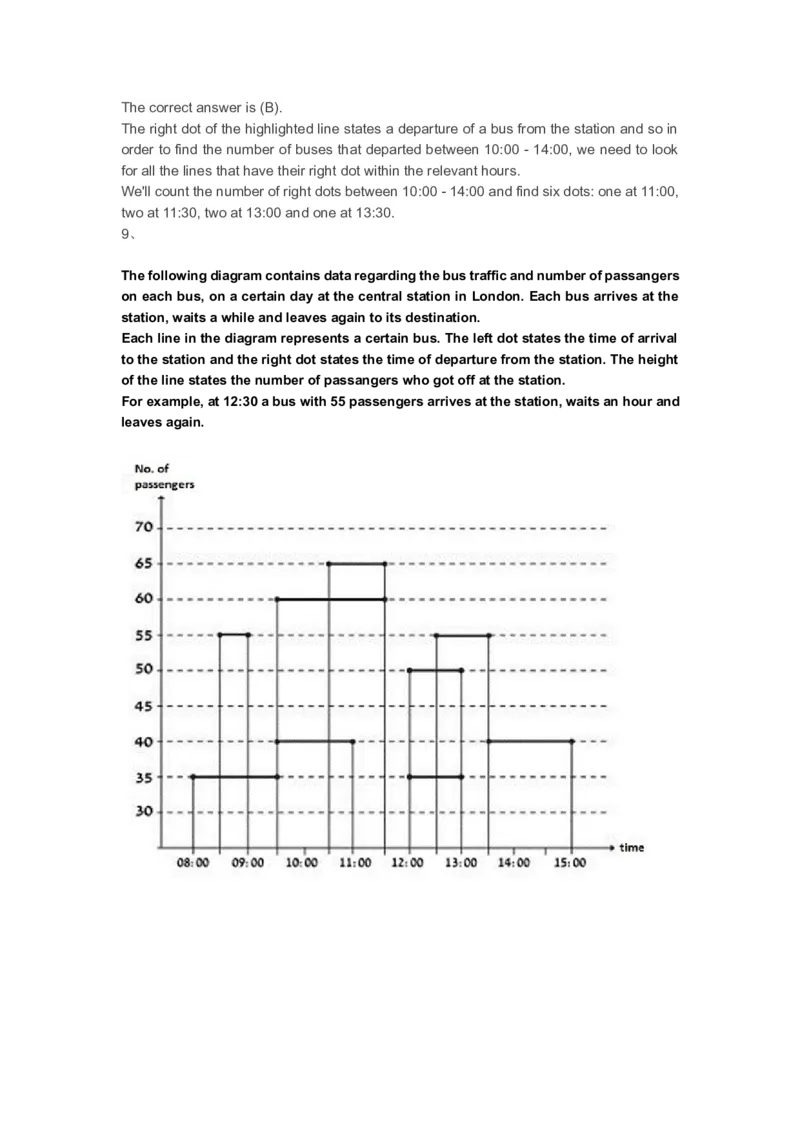
The following diagram contains data regarding the bus traffic and number of passangers
on each bus, on a certain day at the central station in London. Each bus arrives at the
station, waits a while and leaves again to its destination.
Each line in the diagram represents a certain bus. The left dot states the time of arrival
to the station and the right dot states the time of departure from the station. The height
of the line states the number of passangers who got off at the station.
For example, at 12:30 a bus with 55 passengers arrives at the station, waits an hour and
leaves again.答案:B
The correct answer is (B).
The refreshment stand is open when one bus or more is at the station, in other words, at
all hours that have an highlighted horizontal line in the chart. In the chart you can see
highlighted horizontal lines between 8:00 - 11:30 (3.5 hours) and again between 12:00 -
15:00 (3 hours). Meaning the stand was open 6.5 hours all together (3+3.5).
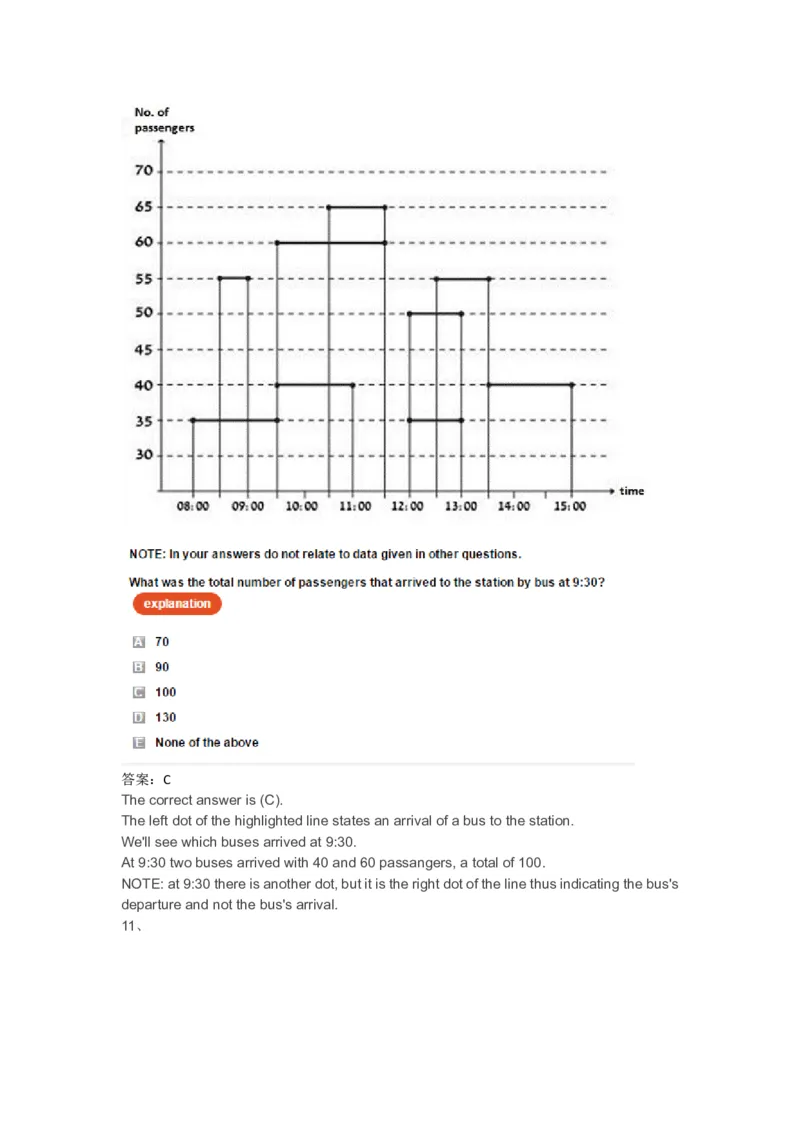
10、
The following diagram contains data regarding the bus traffic and number of passangers
on each bus, on a certain day at the central station in London. Each bus arrives at the
station, waits a while and leaves again to its destination.
Each line in the diagram represents a certain bus. The left dot states the time of arrival
to the station and the right dot states the time of departure from the station. The height
of the line states the number of passangers who got off at the station.
For example, at 12:30 a bus with 55 passengers arrives at the station, waits an hour and
leaves again.答案:C
The correct answer is (C).
The left dot of the highlighted line states an arrival of a bus to the station.
We'll see which buses arrived at 9:30.
At 9:30 two buses arrived with 40 and 60 passangers, a total of 100.
NOTE: at 9:30 there is another dot, but it is the right dot of the line thus indicating the bus's
departure and not the bus's arrival.
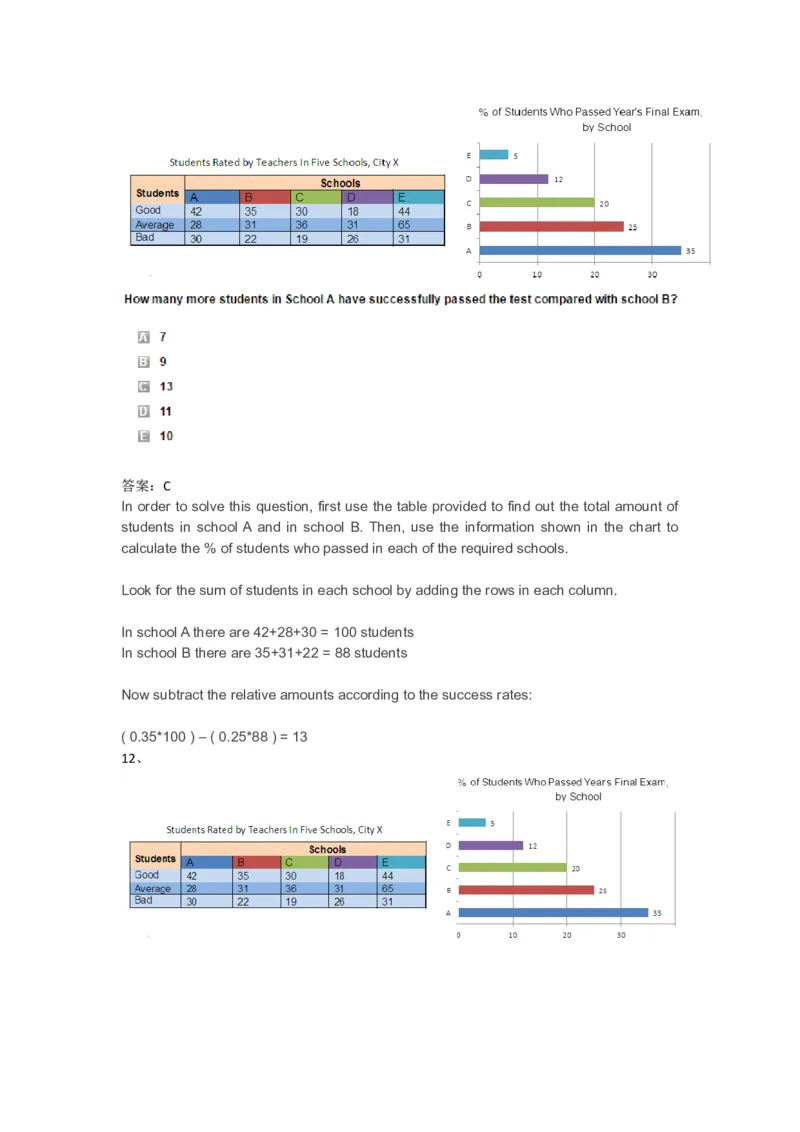
11、答案:C
In order to solve this question, first use the table provided to find out the total amount of
students in school A and in school B. Then, use the information shown in the chart to
calculate the % of students who passed in each of the required schools.
Look for the sum of students in each school by adding the rows in each column.
In school A there are 42+28+30 = 100 students
In school B there are 35+31+22 = 88 students
Now subtract the relative amounts according to the success rates:
( 0.35*100 ) – ( 0.25*88 ) = 13
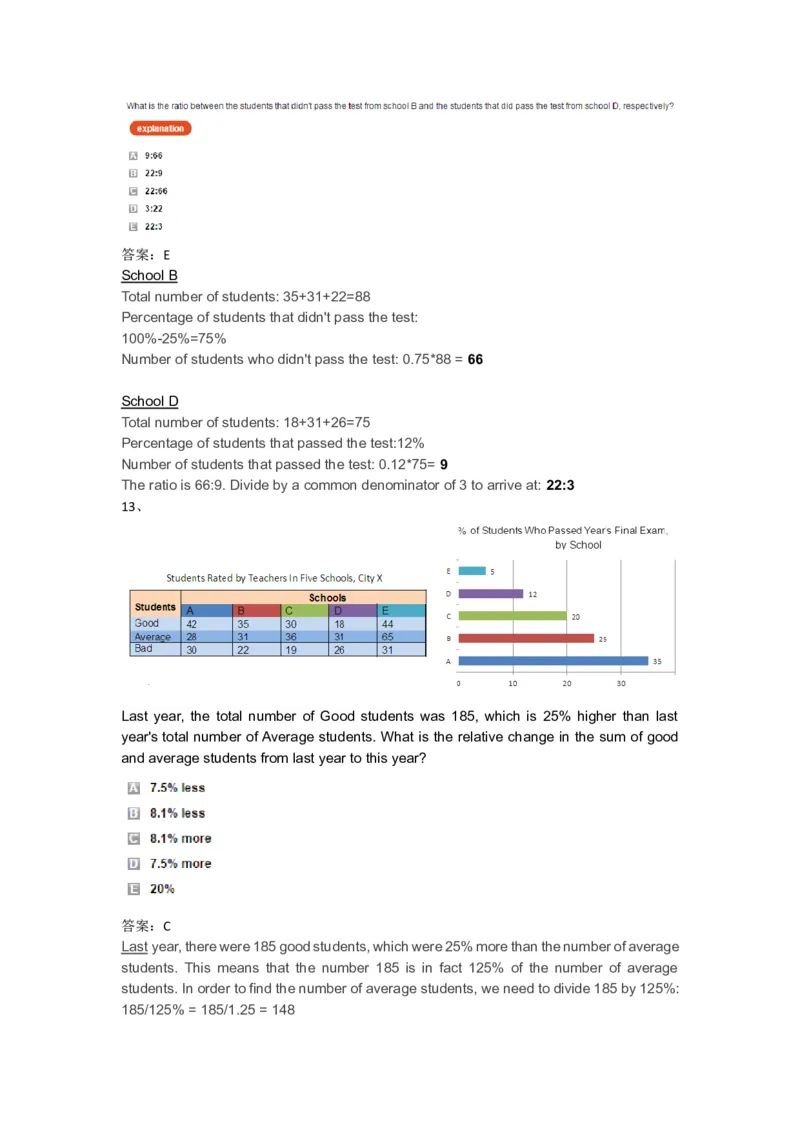
12、答案:E
School B
Total number of students: 35+31+22=88
Percentage of students that didn't pass the test:
100%-25%=75%
Number of students who didn't pass the test: 0.75*88 = 66
School D
Total number of students: 18+31+26=75
Percentage of students that passed the test:12%
Number of students that passed the test: 0.12*75= 9
The ratio is 66:9. Divide by a common denominator of 3 to arrive at: 22:3
13、
Last year, the total number of Good students was 185, which is 25% higher than last
year's total number of Average students. What is the relative change in the sum of good
and average students from last year to this year?
答案:C
Last year, there were 185 good students, which were 25% more than the number of average
students. This means that the number 185 is in fact 125% of the number of average
students. In order to find the number of average students, we need to divide 185 by 125%:
185/125% = 185/1.25 = 148In total, last year there were 185+148 = 333 good and average students.
This year, there are 169 good students and 191 average students, 360 in total.
With the shortcut percentage formula, we calculate:
(360/333)-1= 0.081, which is 8.1%
This year the number of good and average students was higher by 8.1%.
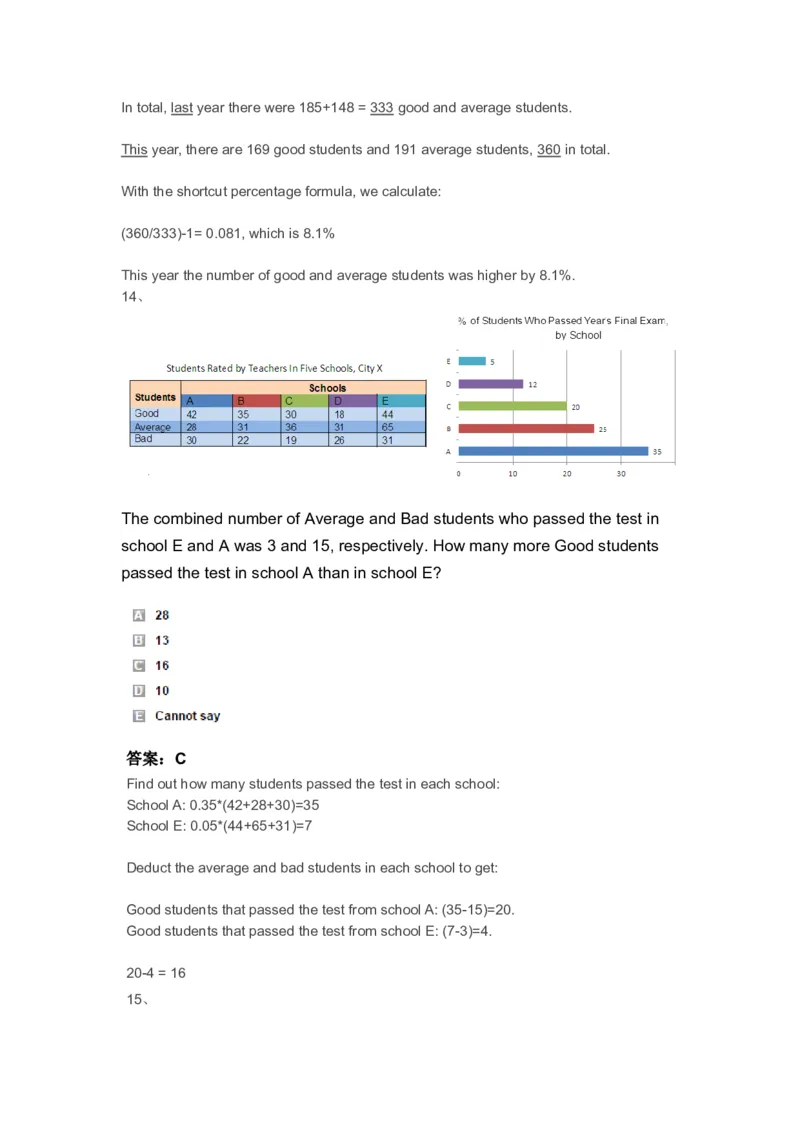
14、
The combined number of Average and Bad students who passed the test in
school E and A was 3 and 15, respectively. How many more Good students
passed the test in school A than in school E?
答案:C
Find out how many students passed the test in each school:
School A: 0.35*(42+28+30)=35
School E: 0.05*(44+65+31)=7
Deduct the average and bad students in each school to get:
Good students that passed the test from school A: (35-15)=20.
Good students that passed the test from school E: (7-3)=4.
20-4 = 16
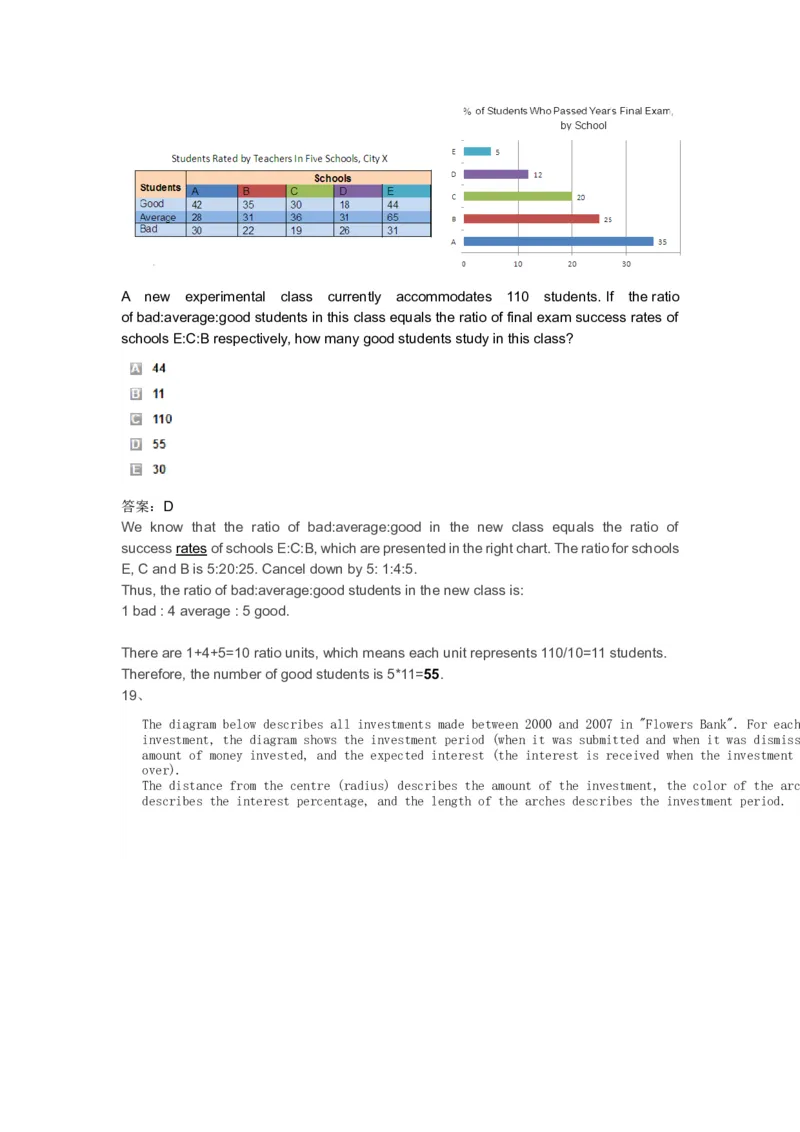
15、A new experimental class currently accommodates 110 students. If the ratio
of bad:average:good students in this class equals the ratio of final exam success rates of
schools E:C:B respectively, how many good students study in this class?
答案:D
We know that the ratio of bad:average:good in the new class equals the ratio of
success rates of schools E:C:B, which are presented in the right chart. The ratio for schools
E, C and B is 5:20:25. Cancel down by 5: 1:4:5.
Thus, the ratio of bad:average:good students in the new class is:
1 bad : 4 average : 5 good.
There are 1+4+5=10 ratio units, which means each unit represents 110/10=11 students.
Therefore, the number of good students is 5*11=55.
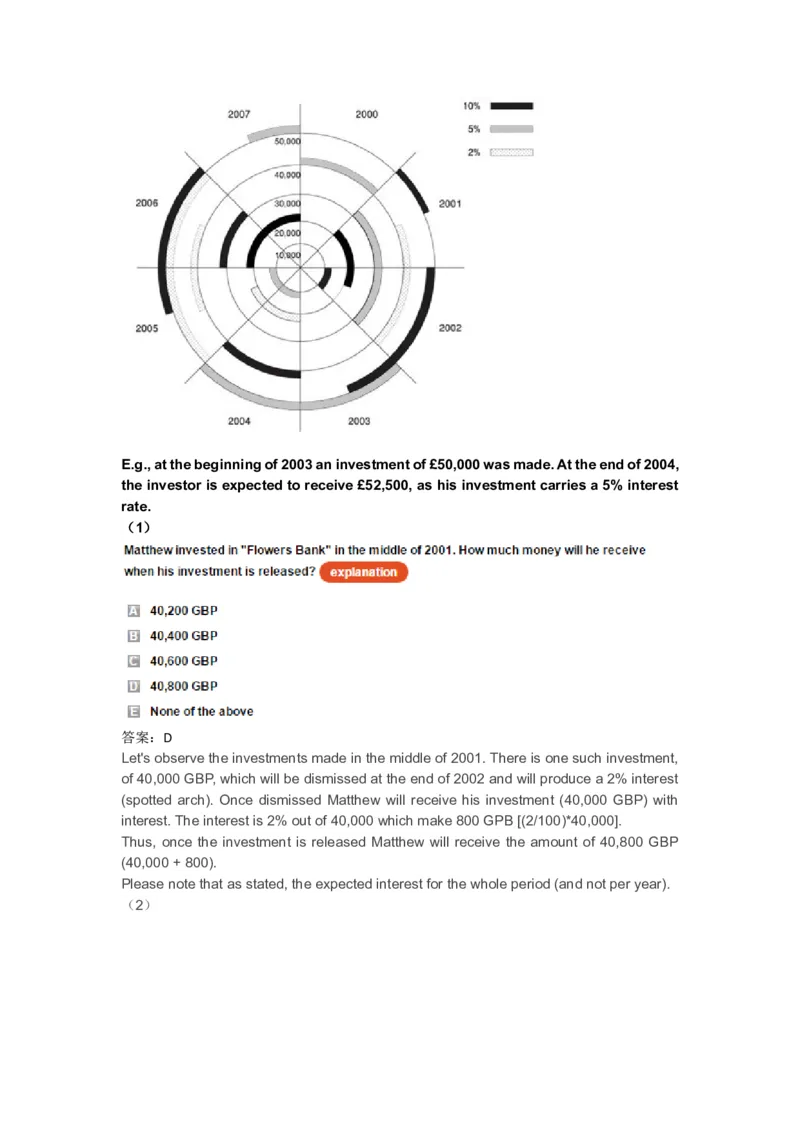
19、
The diagram below describes all investments made between 2000 and 2007 in "Flowers Bank". For each
investment, the diagram shows the investment period (when it was submitted and when it was dismissed), the
amount of money invested, and the expected interest (the interest is received when the investment period is
over).
The distance from the centre (radius) describes the amount of the investment, the color of the arches
describes the interest percentage, and the length of the arches describes the investment period.E.g., at the beginning of 2003 an investment of £50,000 was made. At the end of 2004,
the investor is expected to receive £52,500, as his investment carries a 5% interest
rate.
(1)
答案:D
Let's observe the investments made in the middle of 2001. There is one such investment,
of 40,000 GBP, which will be dismissed at the end of 2002 and will produce a 2% interest
(spotted arch). Once dismissed Matthew will receive his investment (40,000 GBP) with
interest. The interest is 2% out of 40,000 which make 800 GPB [(2/100)*40,000].
Thus, once the investment is released Matthew will receive the amount of 40,800 GBP
(40,000 + 800).
Please note that as stated, the expected interest for the whole period (and not per year).
(2)答案:B
Two investments will be dismissed at the end of 2004:
1. The amount of 40,000 GBP producing 10% interest (black arch). Once dismissed the
investor will receive his investment plus interest. The interest is 10% out of 40,000 which
make 4,000 GBP [(10/100)*40,000].
Therefore, once the investment is dismissed the investor will receive 44,000 GBP (40,000 +
4,000).
2. The amount of 50,000 GBP producing 5% interest for the investment period (grey arch).
Once dismissed the investor will receive his investment plus interest. The interest is 5%
out of 50,000 which make 2,500 GBP [(5/100)*50,000].
Therefore, once the investment is dismissed the investor will receive 52,500 GBP (50,000 +
2,500).
All together, at the end of 2004 96,500 GBP (44,000 + 52,500) will be released from the
"Flowers Bank".
(3)
At the beginning of year 2000 the bank manager decided to give theater tickets to
any customer investing for any period over a year or investing over 30,000 GBP.
If one can only receive a single ticket for each investment, how many tickets did the
bank give away by the end of 2007?
答案:C
First, we'll count the number of investments over 30,000 GBP: there are 4 investments of
40,000 GBP and 6 investments of 50,000 - all together 10 investments (4+6).
Second, we'll count the number of investments of 30,000 GBP or less which were madefor a period of over a year (this in order not to count the same investment twice since it was
stated that every investment can only receive a single ticket).
There is one investment for over a year in the amount of 30,000 GBP, there are 3
investments for over a year in the amount of 20,000 GBP and there is one investment for
over a year in the amount of 10,000 GBP. All together - 5 tickets (1+3+1).
The total number of tickets given is 15 (10+5).
Note that we can't separately count the number of investments made for over a year and
the number of investments over 30,000 GBP and then simply add, since some investments
might be counted twice (once for being over a year and once for being over 30,000).
(4)
An investment's "worth" is the interest percentage it produces divided by the period
of the investment.
A customer chose the investment with the highest worth. Which of the following amounts
will he receive once it's released?
答案:A
First we'll find the investment with the highest worth.
Investment's worth is: (interest percentage) / (the period of investment), we will look for the
investment with the highest interest (largest numerator) and shortest investment period
(smallest denominator): this is an investment of 50,000 GBP made at the beginning of 2001
for a six months period that produced an interest of 10%. This investment's worth is 20
(10/0.5=10*2).
The interest this customer will receive is 5,000 GBP (10% out of 50,000 GBP).
Once the investment is released the customer will receive 55,000 GBP (50,000 + 5,000).

