


文档内容
Numerical Test 11
Solutions Booklet
Instructions
This numerical reasoning test comprises 30 questions, and you will have 30 minutes in
which to correctly answer as many as you can. Calculators are permitted for this test, and it is
recommended you have some rough paper to work on.
You will have to work quickly and accurately to perform well in this test. If you don't know the
answer to a question, leave it and come back to it if you have time. Each question will have
five possible answers, one of which is correct. You may click Back and Next during the test to
review or skip questions.
You can submit your test at any time. If the time limit is up before you click submit the test will
automatically be submitted with the answers you have selected. It is recommended to keep
working until the time limit is up.
Try to find a time and place where you will not be interrupted during the test. The test will
begin on the next page.
AssessmentDay
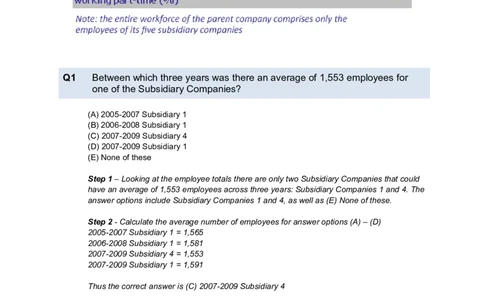
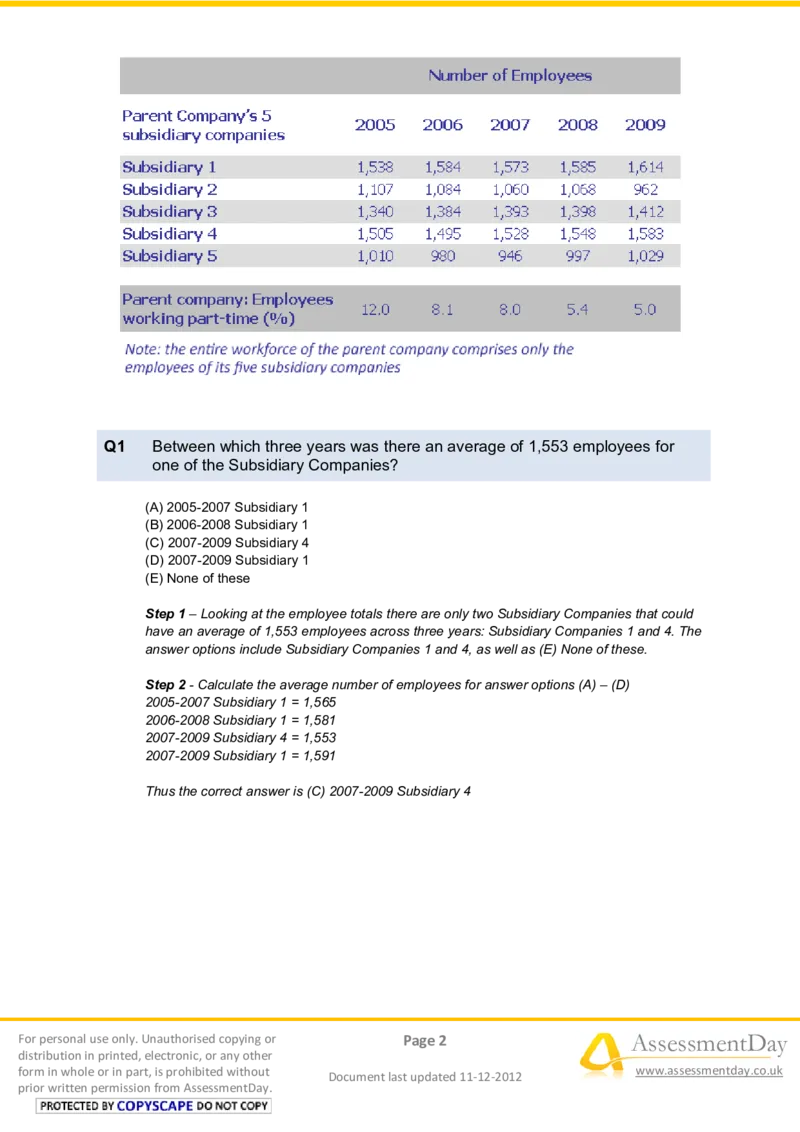
Practice Aptitude TestsQ1 Between which three years was there an average of 1,553 employees for
one of the Subsidiary Companies?
(A) 2005-2007 Subsidiary 1
(B) 2006-2008 Subsidiary 1
(C) 2007-2009 Subsidiary 4
(D) 2007-2009 Subsidiary 1
(E) None of these
Step 1 – Looking at the employee totals there are only two Subsidiary Companies that could
have an average of 1,553 employees across three years: Subsidiary Companies 1 and 4. The
answer options include Subsidiary Companies 1 and 4, as well as (E) None of these.
Step 2 - Calculate the average number of employees for answer options (A) – (D)
2005-2007 Subsidiary 1 = 1,565
2006-2008 Subsidiary 1 = 1,581
2007-2009 Subsidiary 4 = 1,553
2007-2009 Subsidiary 1 = 1,591
Thus the correct answer is (C) 2007-2009 Subsidiary 4
For personal use only. Unauthorised copying or Page 2 AssessmentDay
distribution in printed, electronic, or any other
form in whole or in part, is prohibited without
Document last updated 11-12-2012
www.assessmentday.co.uk
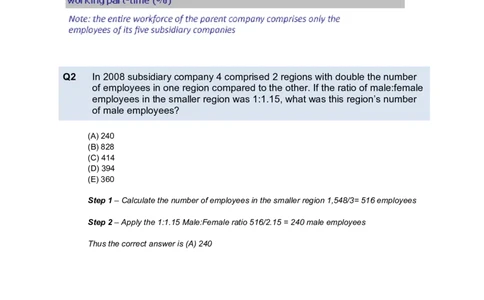
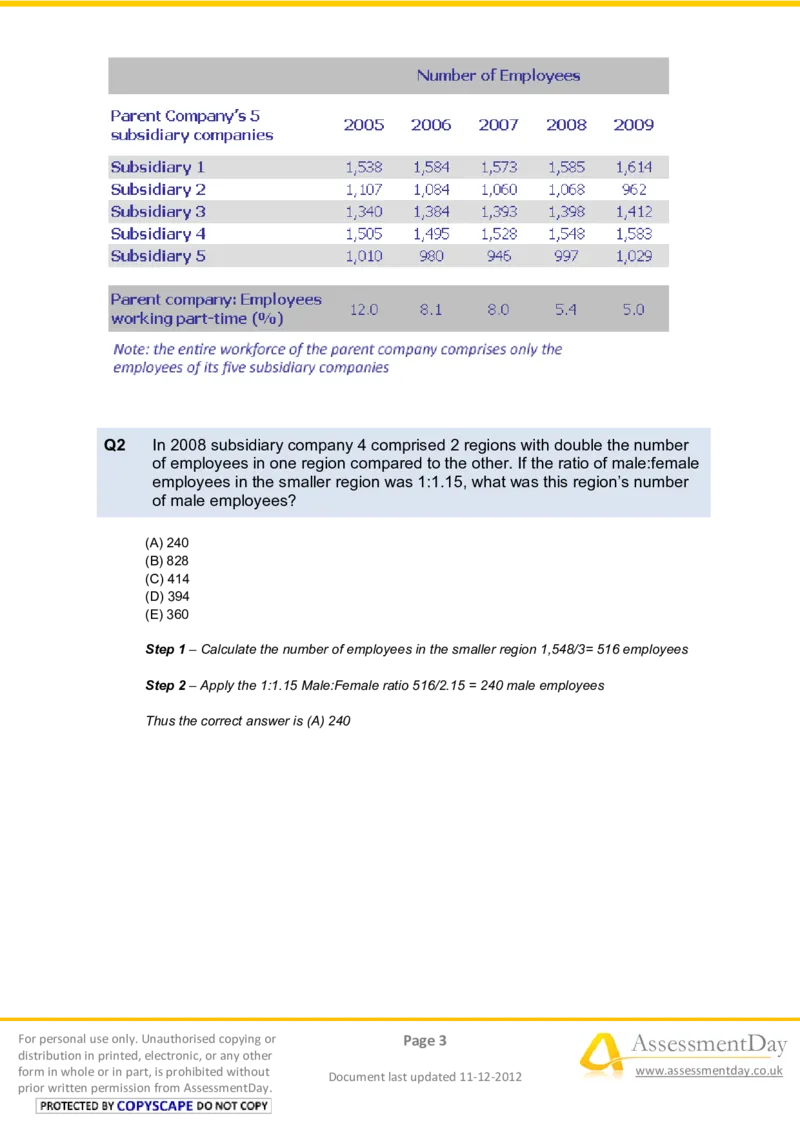
prior written permission from AssessmentDay.Q2 In 2008 subsidiary company 4 comprised 2 regions with double the number
of employees in one region compared to the other. If the ratio of male:female
employees in the smaller region was 1:1.15, what was this region’s number
of male employees?
(A) 240
(B) 828
(C) 414
(D) 394
(E) 360
Step 1 – Calculate the number of employees in the smaller region 1,548/3= 516 employees
Step 2 – Apply the 1:1.15 Male:Female ratio 516/2.15 = 240 male employees
Thus the correct answer is (A) 240
For personal use only. Unauthorised copying or Page 3 AssessmentDay
distribution in printed, electronic, or any other
form in whole or in part, is prohibited without
Document last updated 11-12-2012
www.assessmentday.co.uk
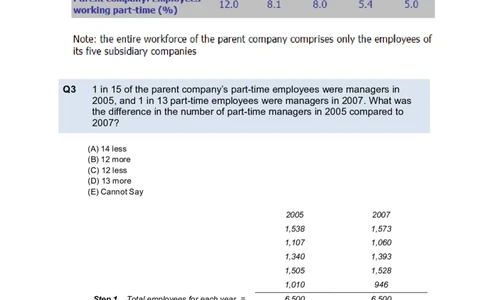
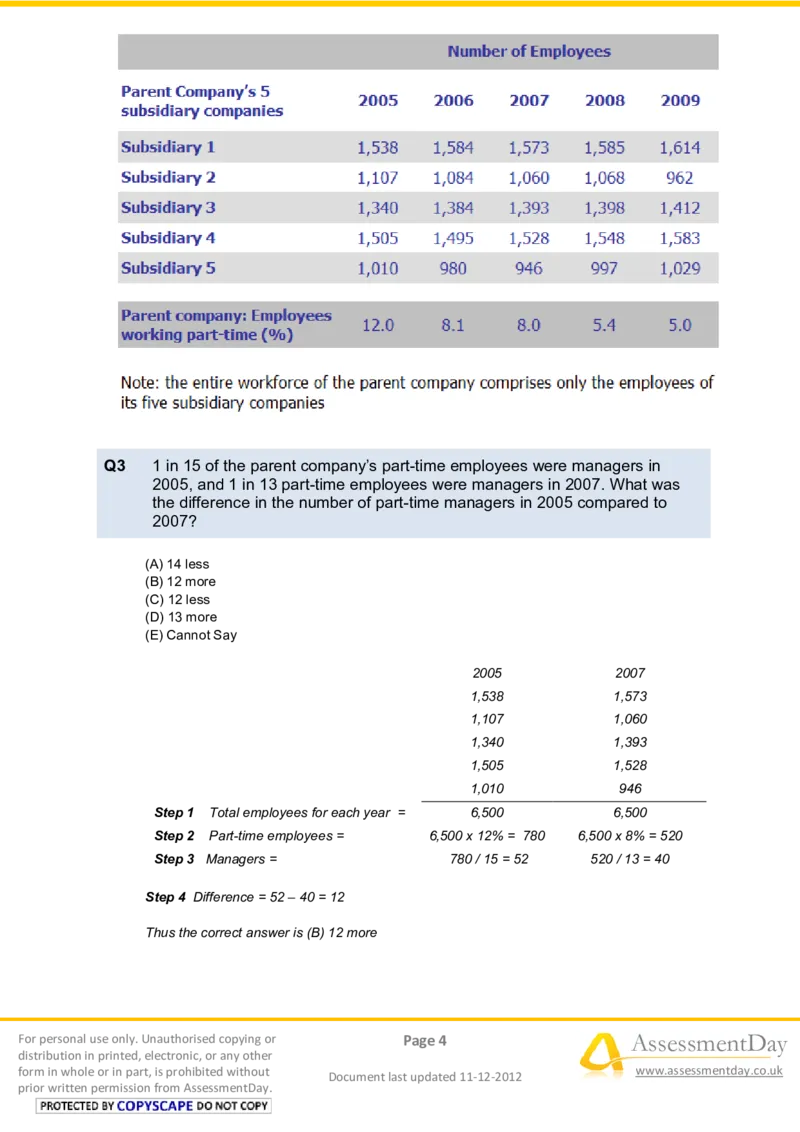
prior written permission from AssessmentDay.Q3 1 in 15 of the parent company’s part-time employees were managers in
2005, and 1 in 13 part-time employees were managers in 2007. What was
the difference in the number of part-time managers in 2005 compared to
2007?
(A) 14 less
(B) 12 more
(C) 12 less
(D) 13 more
(E) Cannot Say
2005 2007
1,538 1,573
1,107 1,060
1,340 1,393
1,505 1,528
1,010 946
Step 1 Total employees for each year = 6,500 6,500
Step 2 Part-time employees = 6,500 x 12% = 780 6,500 x 8% = 520
Step 3 Managers = 780 / 15 = 52 520 / 13 = 40
Step 4 Difference = 52 – 40 = 12
Thus the correct answer is (B) 12 more
For personal use only. Unauthorised copying or Page 4 AssessmentDay
distribution in printed, electronic, or any other
form in whole or in part, is prohibited without
Document last updated 11-12-2012
www.assessmentday.co.uk
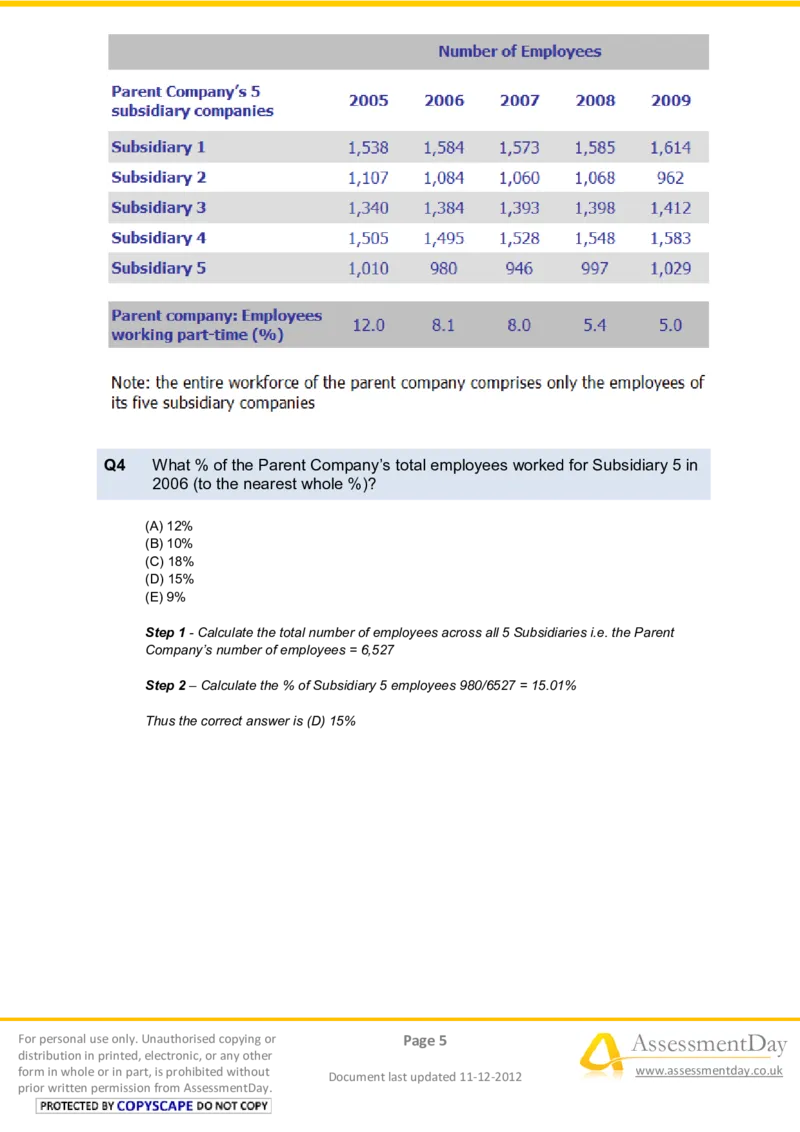
prior written permission from AssessmentDay.Q4 What % of the Parent Company’s total employees worked for Subsidiary 5 in
2006 (to the nearest whole %)?
(A) 12%
(B) 10%
(C) 18%
(D) 15%
(E) 9%
Step 1 - Calculate the total number of employees across all 5 Subsidiaries i.e. the Parent
Company’s number of employees = 6,527
Step 2 – Calculate the % of Subsidiary 5 employees 980/6527 = 15.01%
Thus the correct answer is (D) 15%
For personal use only. Unauthorised copying or Page 5 AssessmentDay
distribution in printed, electronic, or any other
form in whole or in part, is prohibited without
Document last updated 11-12-2012
www.assessmentday.co.uk
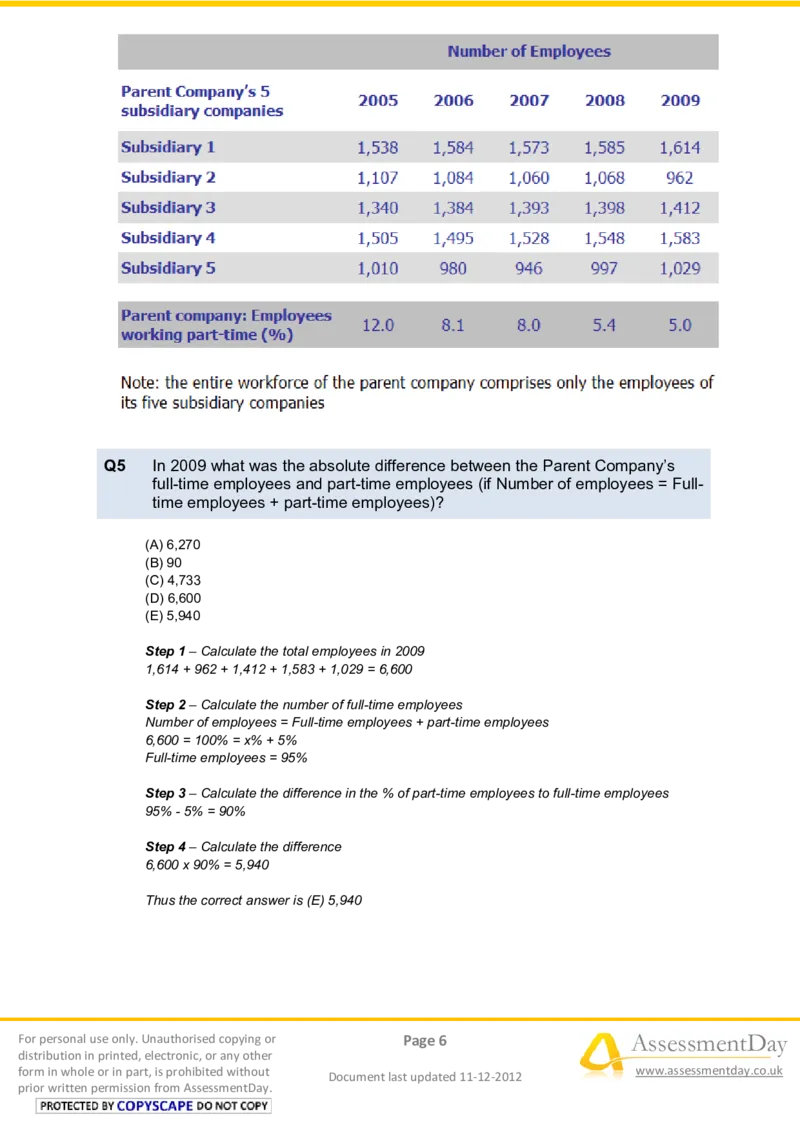
prior written permission from AssessmentDay.Q5 In 2009 what was the absolute difference between the Parent Company’s
full-time employees and part-time employees (if Number of employees = Full-
time employees + part-time employees)?
(A) 6,270
(B) 90
(C) 4,733
(D) 6,600
(E) 5,940
Step 1 – Calculate the total employees in 2009
1,614 + 962 + 1,412 + 1,583 + 1,029 = 6,600
Step 2 – Calculate the number of full-time employees
Number of employees = Full-time employees + part-time employees
6,600 = 100% = x% + 5%
Full-time employees = 95%
Step 3 – Calculate the difference in the % of part-time employees to full-time employees
95% - 5% = 90%
Step 4 – Calculate the difference
6,600 x 90% = 5,940
Thus the correct answer is (E) 5,940
For personal use only. Unauthorised copying or Page 6 AssessmentDay
distribution in printed, electronic, or any other
form in whole or in part, is prohibited without
Document last updated 11-12-2012
www.assessmentday.co.uk
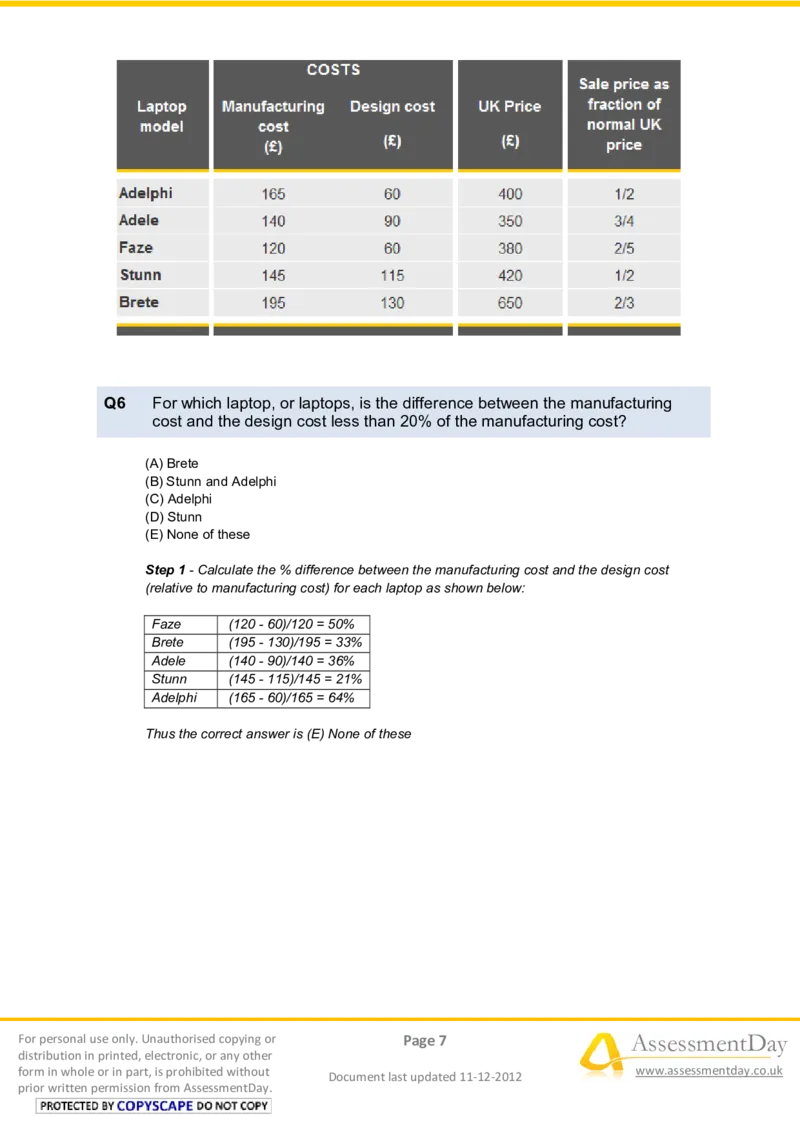
prior written permission from AssessmentDay.Q6 For which laptop, or laptops, is the difference between the manufacturing
cost and the design cost less than 20% of the manufacturing cost?
(A) Brete
(B) Stunn and Adelphi
(C) Adelphi
(D) Stunn
(E) None of these
Step 1 - Calculate the % difference between the manufacturing cost and the design cost
(relative to manufacturing cost) for each laptop as shown below:
Faze (120 - 60)/120 = 50%
Brete (195 - 130)/195 = 33%
Adele (140 - 90)/140 = 36%
Stunn (145 - 115)/145 = 21%
Adelphi (165 - 60)/165 = 64%
Thus the correct answer is (E) None of these
For personal use only. Unauthorised copying or Page 7 AssessmentDay
distribution in printed, electronic, or any other
form in whole or in part, is prohibited without
Document last updated 11-12-2012
www.assessmentday.co.uk
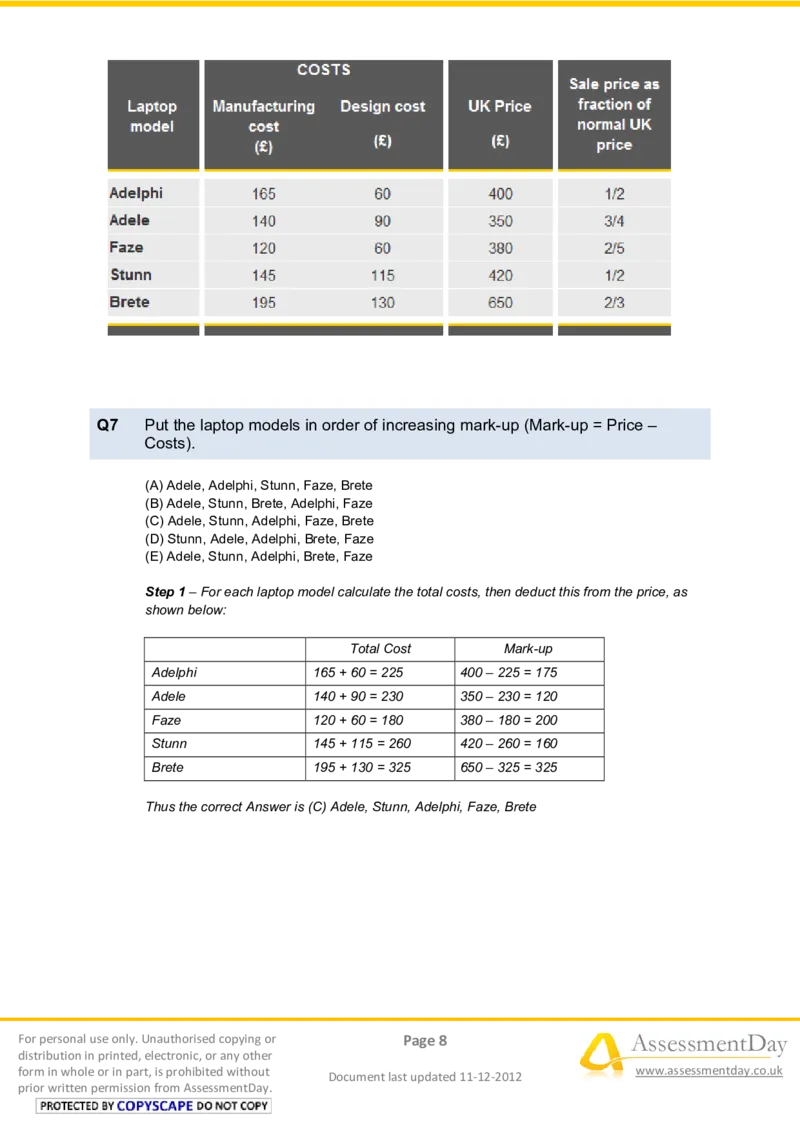
prior written permission from AssessmentDay.Q7 Put the laptop models in order of increasing mark-up (Mark-up = Price –
Costs).
(A) Adele, Adelphi, Stunn, Faze, Brete
(B) Adele, Stunn, Brete, Adelphi, Faze
(C) Adele, Stunn, Adelphi, Faze, Brete
(D) Stunn, Adele, Adelphi, Brete, Faze
(E) Adele, Stunn, Adelphi, Brete, Faze
Step 1 – For each laptop model calculate the total costs, then deduct this from the price, as
shown below:
Total Cost Mark-up
Adelphi 165 + 60 = 225 400 – 225 = 175
Adele 140 + 90 = 230 350 – 230 = 120
Faze 120 + 60 = 180 380 – 180 = 200
Stunn 145 + 115 = 260 420 – 260 = 160
Brete 195 + 130 = 325 650 – 325 = 325
Thus the correct Answer is (C) Adele, Stunn, Adelphi, Faze, Brete
For personal use only. Unauthorised copying or Page 8 AssessmentDay
distribution in printed, electronic, or any other
form in whole or in part, is prohibited without
Document last updated 11-12-2012
www.assessmentday.co.uk
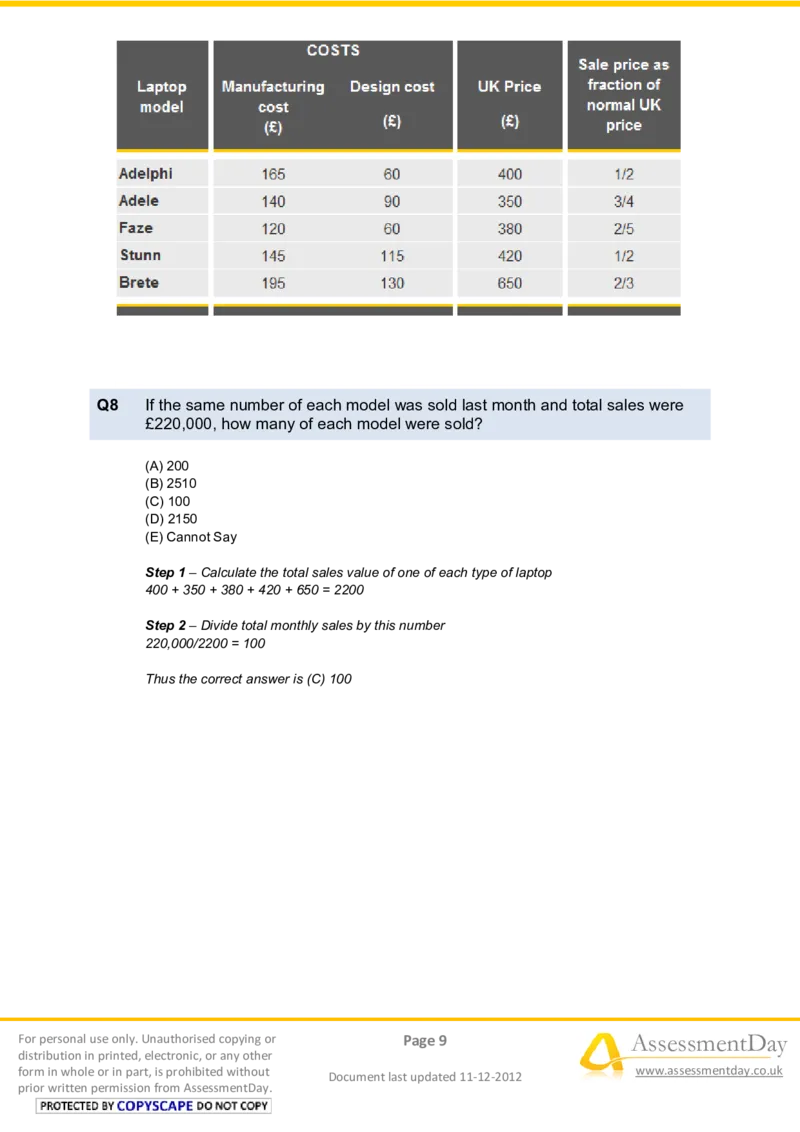
prior written permission from AssessmentDay.Q8 If the same number of each model was sold last month and total sales were
£220,000, how many of each model were sold?
(A) 200
(B) 2510
(C) 100
(D) 2150
(E) Cannot Say
Step 1 – Calculate the total sales value of one of each type of laptop
400 + 350 + 380 + 420 + 650 = 2200
Step 2 – Divide total monthly sales by this number
220,000/2200 = 100
Thus the correct answer is (C) 100
For personal use only. Unauthorised copying or Page 9 AssessmentDay
distribution in printed, electronic, or any other
form in whole or in part, is prohibited without
Document last updated 11-12-2012
www.assessmentday.co.uk
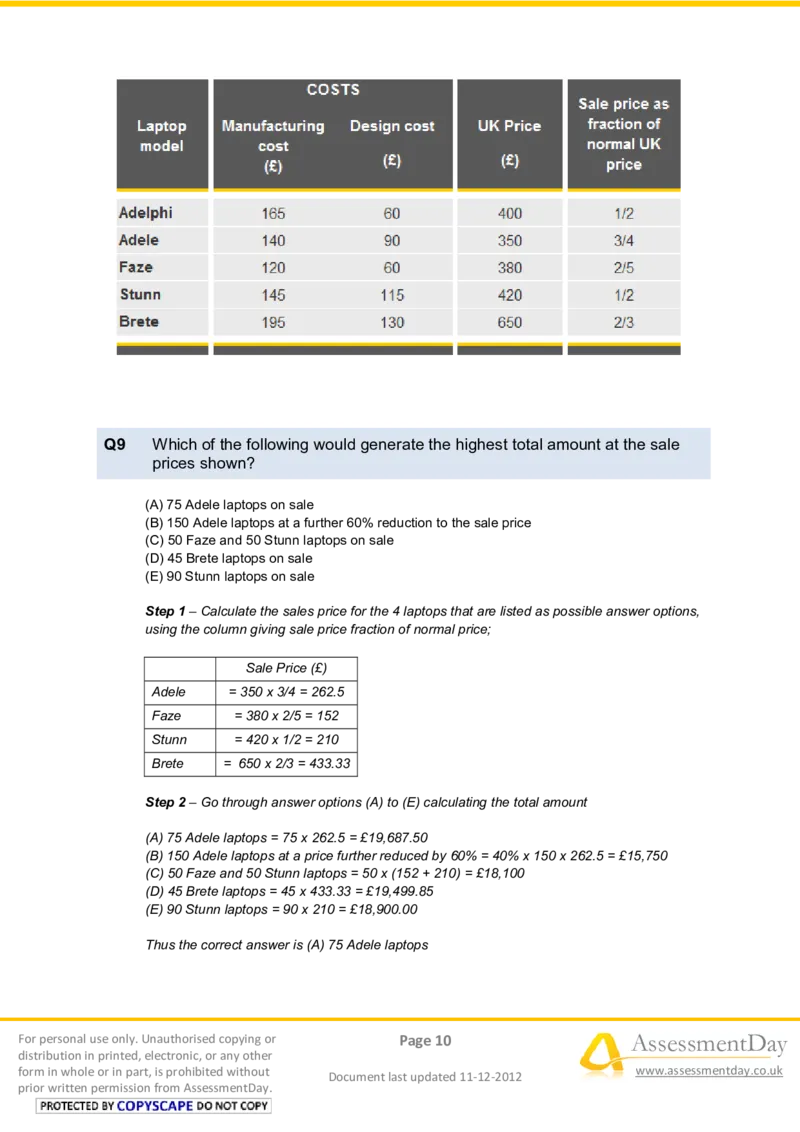
prior written permission from AssessmentDay.Q9 Which of the following would generate the highest total amount at the sale
prices shown?
(A) 75 Adele laptops on sale
(B) 150 Adele laptops at a further 60% reduction to the sale price
(C) 50 Faze and 50 Stunn laptops on sale
(D) 45 Brete laptops on sale
(E) 90 Stunn laptops on sale
Step 1 – Calculate the sales price for the 4 laptops that are listed as possible answer options,
using the column giving sale price fraction of normal price;
Sale Price (£)
Adele = 350 x 3/4 = 262.5
Faze = 380 x 2/5 = 152
Stunn = 420 x 1/2 = 210
Brete = 650 x 2/3 = 433.33
Step 2 – Go through answer options (A) to (E) calculating the total amount
(A) 75 Adele laptops = 75 x 262.5 = £19,687.50
(B) 150 Adele laptops at a price further reduced by 60% = 40% x 150 x 262.5 = £15,750
(C) 50 Faze and 50 Stunn laptops = 50 x (152 + 210) = £18,100
(D) 45 Brete laptops = 45 x 433.33 = £19,499.85
(E) 90 Stunn laptops = 90 x 210 = £18,900.00
Thus the correct answer is (A) 75 Adele laptops
For personal use only. Unauthorised copying or Page 10 AssessmentDay
distribution in printed, electronic, or any other
form in whole or in part, is prohibited without
Document last updated 11-12-2012
www.assessmentday.co.uk
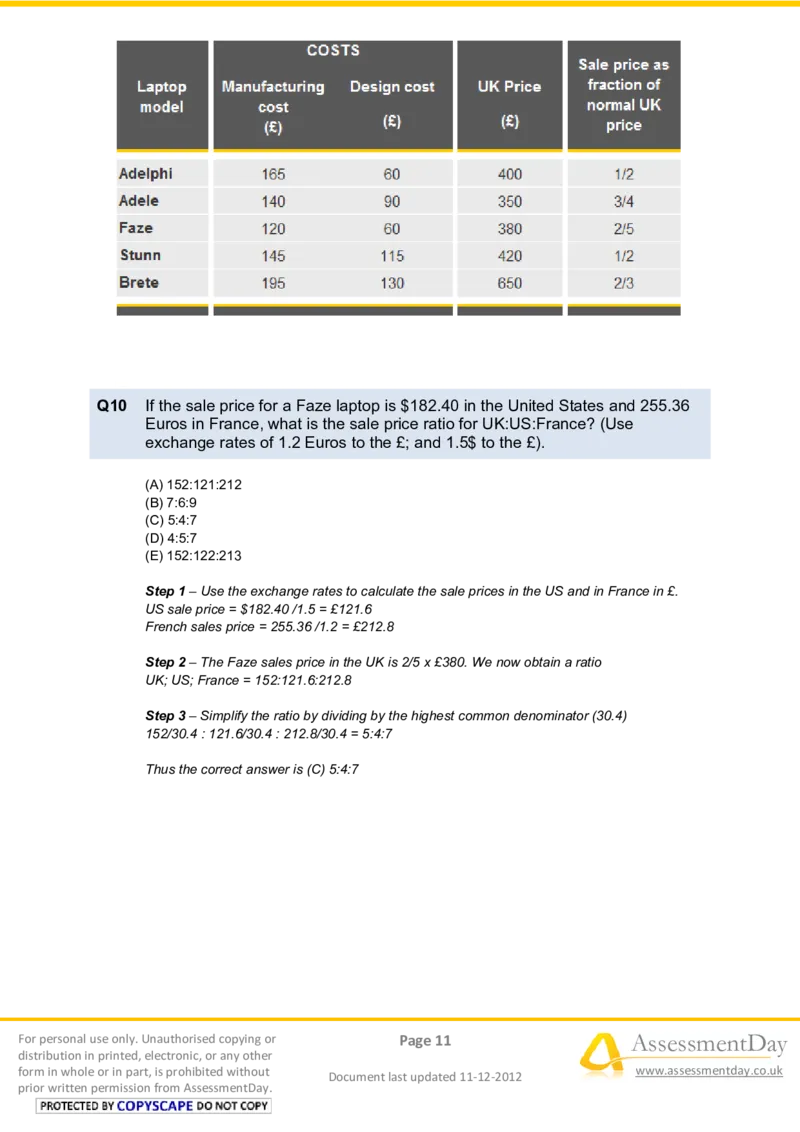
prior written permission from AssessmentDay.Q10 If the sale price for a Faze laptop is $182.40 in the United States and 255.36
Euros in France, what is the sale price ratio for UK:US:France? (Use
exchange rates of 1.2 Euros to the £; and 1.5$ to the £).
(A) 152:121:212
(B) 7:6:9
(C) 5:4:7
(D) 4:5:7
(E) 152:122:213
Step 1 – Use the exchange rates to calculate the sale prices in the US and in France in £.
US sale price = $182.40 /1.5 = £121.6
French sales price = 255.36 /1.2 = £212.8
Step 2 – The Faze sales price in the UK is 2/5 x £380. We now obtain a ratio
UK; US; France = 152:121.6:212.8
Step 3 – Simplify the ratio by dividing by the highest common denominator (30.4)
152/30.4 : 121.6/30.4 : 212.8/30.4 = 5:4:7
Thus the correct answer is (C) 5:4:7
For personal use only. Unauthorised copying or Page 11 AssessmentDay
distribution in printed, electronic, or any other
form in whole or in part, is prohibited without
Document last updated 11-12-2012
www.assessmentday.co.uk
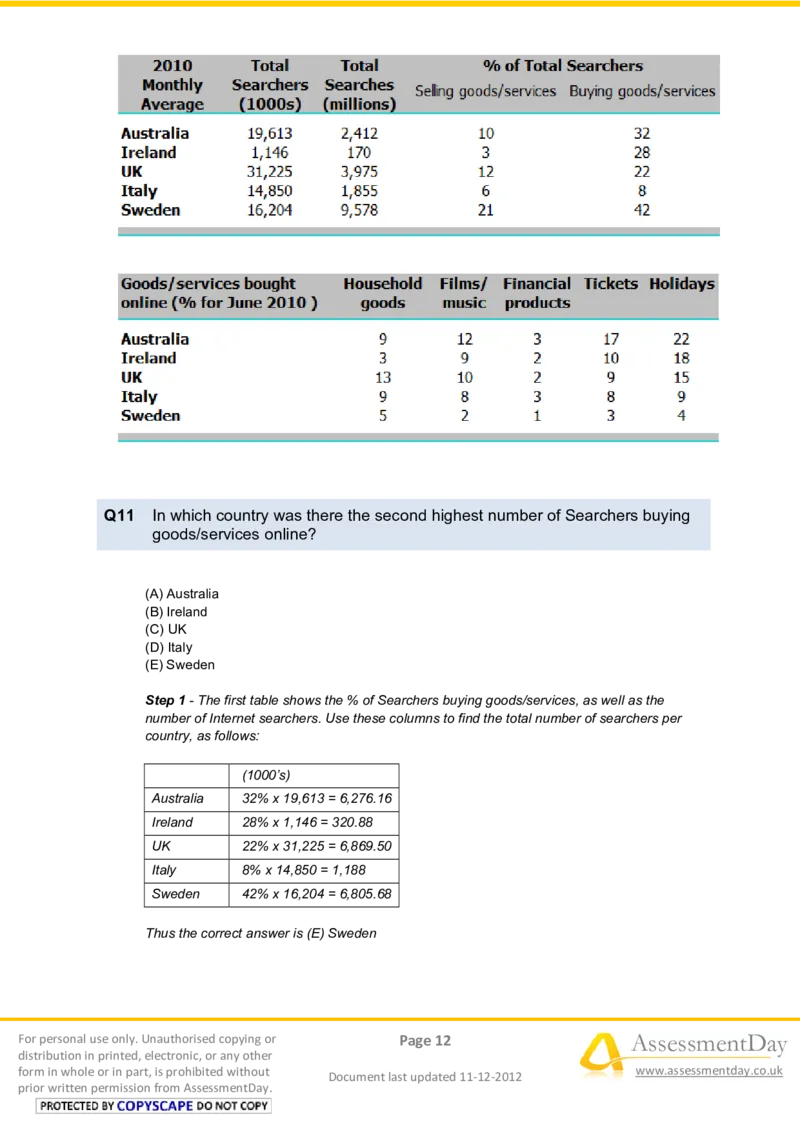
prior written permission from AssessmentDay.Q11 In which country was there the second highest number of Searchers buying
goods/services online?
(A) Australia
(B) Ireland
(C) UK
(D) Italy
(E) Sweden
Step 1 - The first table shows the % of Searchers buying goods/services, as well as the
number of Internet searchers. Use these columns to find the total number of searchers per
country, as follows:
(1000’s)
Australia 32% x 19,613 = 6,276.16
Ireland 28% x 1,146 = 320.88
UK 22% x 31,225 = 6,869.50
Italy 8% x 14,850 = 1,188
Sweden 42% x 16,204 = 6,805.68
Thus the correct answer is (E) Sweden
For personal use only. Unauthorised copying or Page 12 AssessmentDay
distribution in printed, electronic, or any other
form in whole or in part, is prohibited without
Document last updated 11-12-2012
www.assessmentday.co.uk
prior written permission from AssessmentDay.Q12 In which country was there the second lowest number of Searchers selling
goods/services online?
(A) Australia
(B) Ireland
(C) UK
(D) Italy
(E) Sweden
Step 1 - The first table shows the % of Searchers selling goods/services, as well as the
number of Internet searchers. Use these columns to find the total number of searchers per
country – whilst ensuring that - unlike the previous question – you provide the second lowest
number of Searchers.
(1000’s)
Australia 10% x 19,613 = 1,961.30
Ireland 3% x 1,146 = 34.38
UK 12% x 31,225 = 3,747.00
Italy 6% x 14,850 = 891.00
Sweden 21% x 16,204 = 3,402.84
Thus the correct answer is (D) Italy
For personal use only. Unauthorised copying or Page 13 AssessmentDay
distribution in printed, electronic, or any other
form in whole or in part, is prohibited without
Document last updated 11-12-2012
www.assessmentday.co.uk
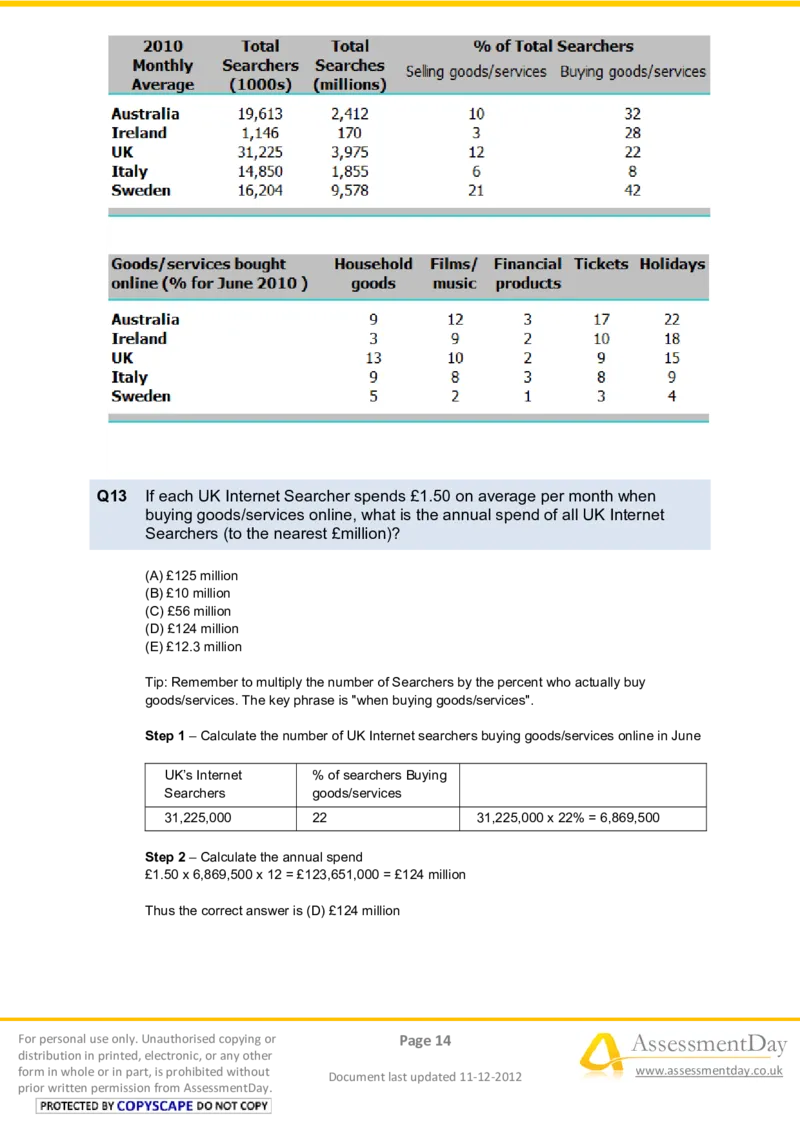
prior written permission from AssessmentDay.Q13 If each UK Internet Searcher spends £1.50 on average per month when
buying goods/services online, what is the annual spend of all UK Internet
Searchers (to the nearest £million)?
(A) £125 million
(B) £10 million
(C) £56 million
(D) £124 million
(E) £12.3 million
Tip: Remember to multiply the number of Searchers by the percent who actually buy
goods/services. The key phrase is "when buying goods/services".
Step 1 – Calculate the number of UK Internet searchers buying goods/services online in June
UK’s Internet % of searchers Buying
Searchers goods/services
31,225,000 22 31,225,000 x 22% = 6,869,500
Step 2 – Calculate the annual spend
£1.50 x 6,869,500 x 12 = £123,651,000 = £124 million
Thus the correct answer is (D) £124 million
For personal use only. Unauthorised copying or Page 14 AssessmentDay
distribution in printed, electronic, or any other
form in whole or in part, is prohibited without
Document last updated 11-12-2012
www.assessmentday.co.uk
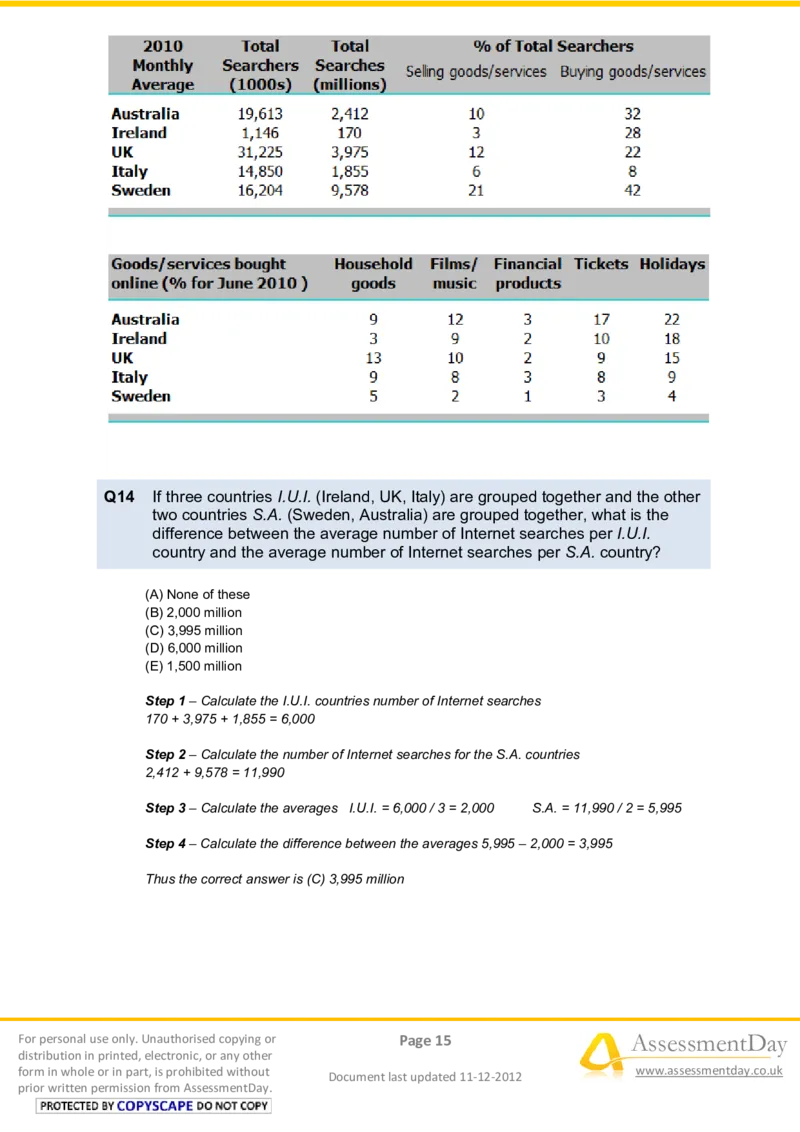
prior written permission from AssessmentDay.Q14 If three countries I.U.I. (Ireland, UK, Italy) are grouped together and the other
two countries S.A. (Sweden, Australia) are grouped together, what is the
difference between the average number of Internet searches per I.U.I.
country and the average number of Internet searches per S.A. country?
(A) None of these
(B) 2,000 million
(C) 3,995 million
(D) 6,000 million
(E) 1,500 million
Step 1 – Calculate the I.U.I. countries number of Internet searches
170 + 3,975 + 1,855 = 6,000
Step 2 – Calculate the number of Internet searches for the S.A. countries
2,412 + 9,578 = 11,990
Step 3 – Calculate the averages I.U.I. = 6,000 / 3 = 2,000 S.A. = 11,990 / 2 = 5,995
Step 4 – Calculate the difference between the averages 5,995 – 2,000 = 3,995
Thus the correct answer is (C) 3,995 million
For personal use only. Unauthorised copying or Page 15 AssessmentDay
distribution in printed, electronic, or any other
form in whole or in part, is prohibited without
Document last updated 11-12-2012
www.assessmentday.co.uk
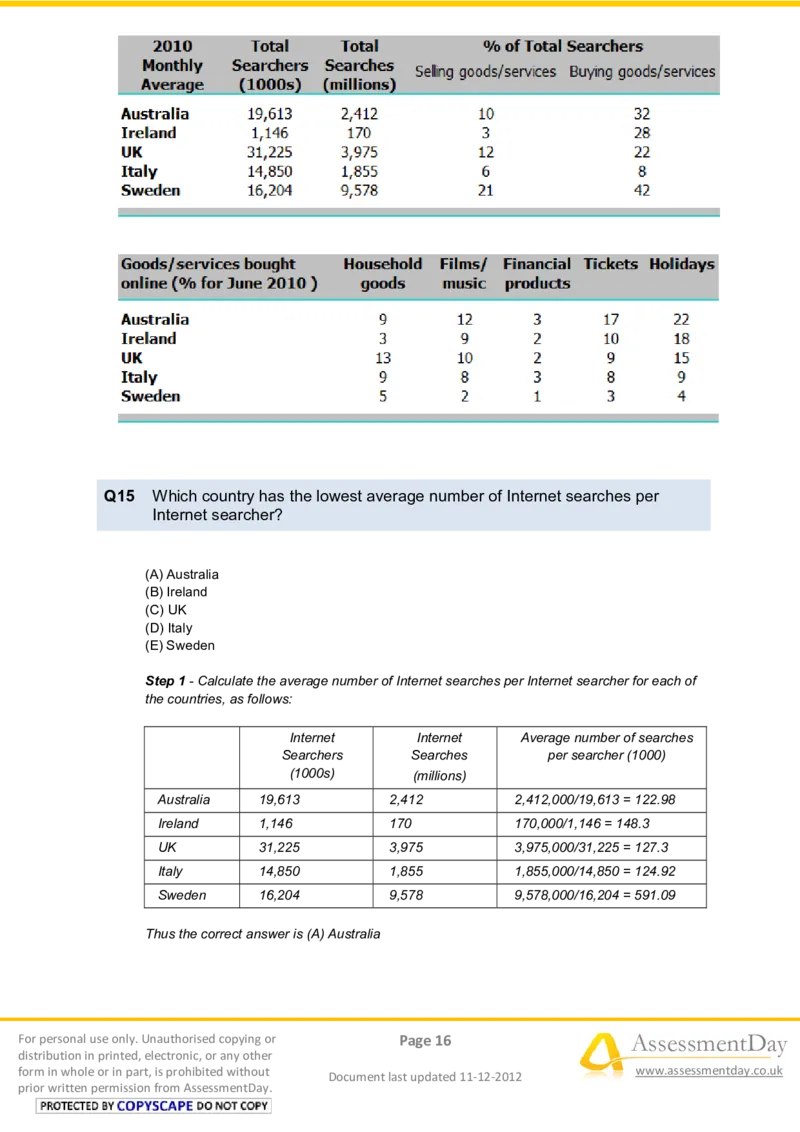
prior written permission from AssessmentDay.Q15 Which country has the lowest average number of Internet searches per
Internet searcher?
(A) Australia
(B) Ireland
(C) UK
(D) Italy
(E) Sweden
Step 1 - Calculate the average number of Internet searches per Internet searcher for each of
the countries, as follows:
Internet Internet Average number of searches
Searchers Searches per searcher (1000)
(1000s) (millions)
Australia 19,613 2,412 2,412,000/19,613 = 122.98
Ireland 1,146 170 170,000/1,146 = 148.3
UK 31,225 3,975 3,975,000/31,225 = 127.3
Italy 14,850 1,855 1,855,000/14,850 = 124.92
Sweden 16,204 9,578 9,578,000/16,204 = 591.09
Thus the correct answer is (A) Australia
For personal use only. Unauthorised copying or Page 16 AssessmentDay
distribution in printed, electronic, or any other
form in whole or in part, is prohibited without
Document last updated 11-12-2012
www.assessmentday.co.uk
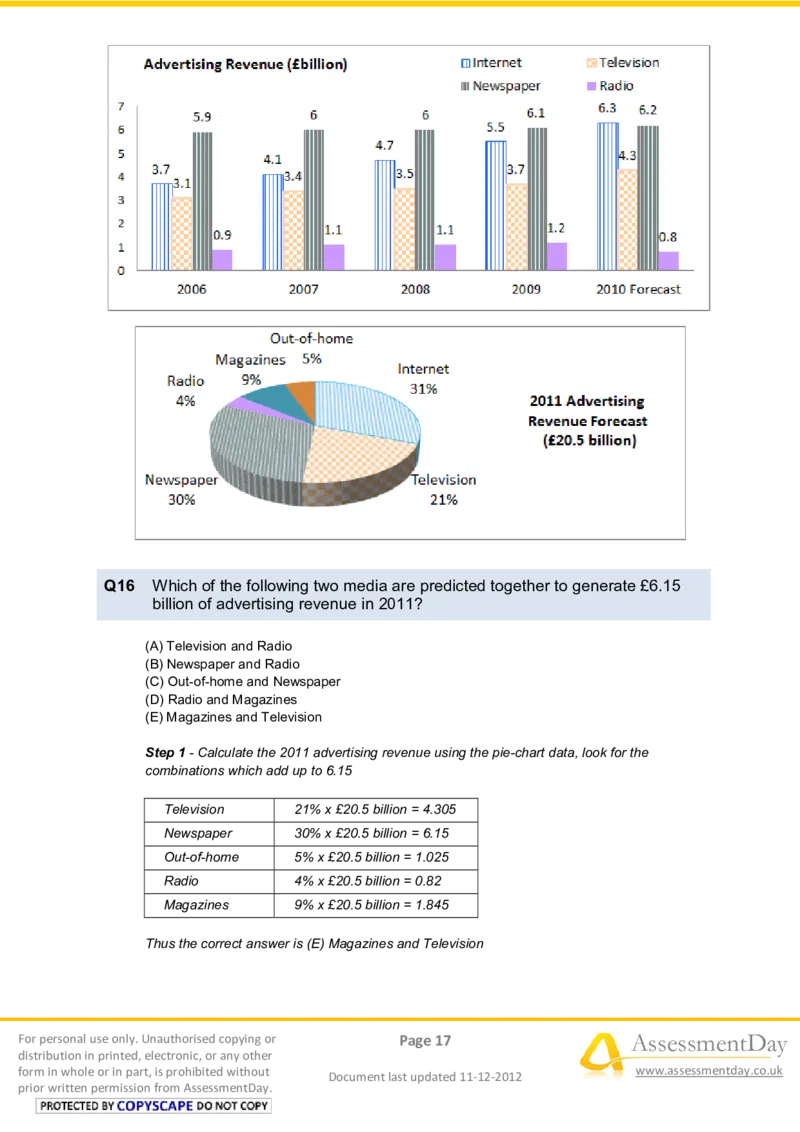
prior written permission from AssessmentDay.Q16 Which of the following two media are predicted together to generate £6.15
billion of advertising revenue in 2011?
(A) Television and Radio
(B) Newspaper and Radio
(C) Out-of-home and Newspaper
(D) Radio and Magazines
(E) Magazines and Television
Step 1 - Calculate the 2011 advertising revenue using the pie-chart data, look for the
combinations which add up to 6.15
Television 21% x £20.5 billion = 4.305
Newspaper 30% x £20.5 billion = 6.15
Out-of-home 5% x £20.5 billion = 1.025
Radio 4% x £20.5 billion = 0.82
Magazines 9% x £20.5 billion = 1.845
Thus the correct answer is (E) Magazines and Television
For personal use only. Unauthorised copying or Page 17 AssessmentDay
distribution in printed, electronic, or any other
form in whole or in part, is prohibited without
Document last updated 11-12-2012
www.assessmentday.co.uk
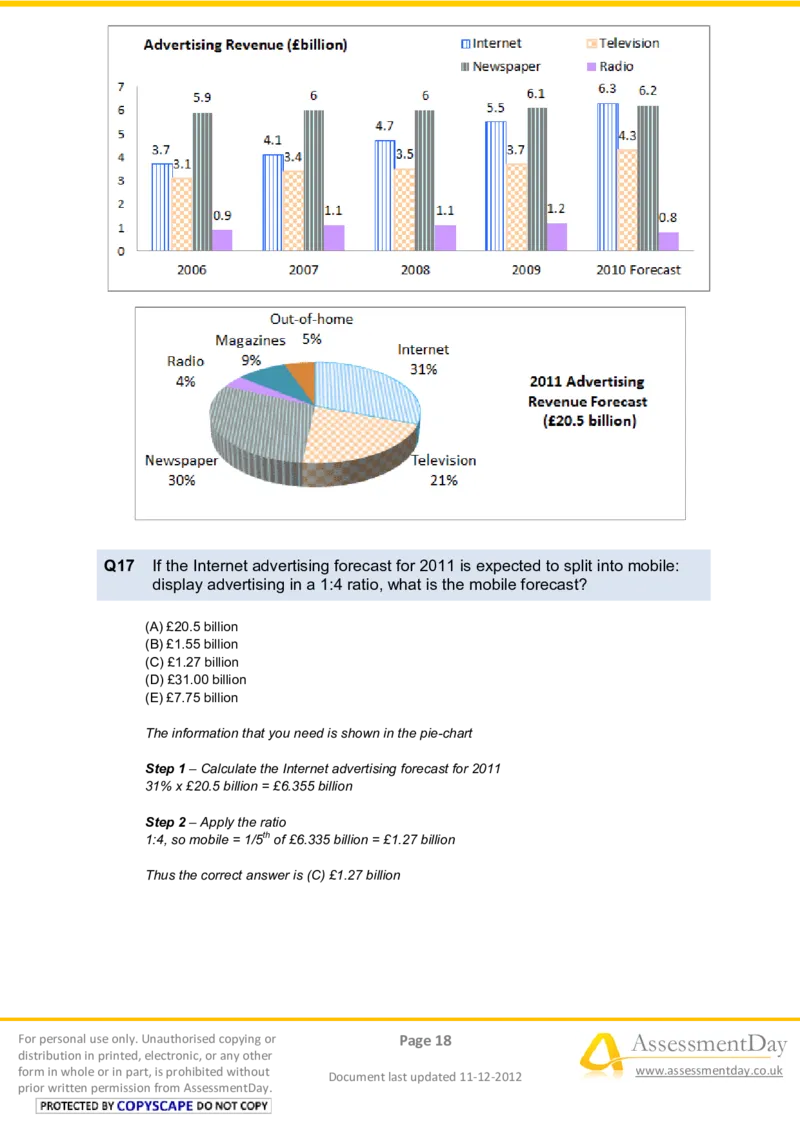
prior written permission from AssessmentDay.Q17 If the Internet advertising forecast for 2011 is expected to split into mobile:
display advertising in a 1:4 ratio, what is the mobile forecast?
(A) £20.5 billion
(B) £1.55 billion
(C) £1.27 billion
(D) £31.00 billion
(E) £7.75 billion
The information that you need is shown in the pie-chart
Step 1 – Calculate the Internet advertising forecast for 2011
31% x £20.5 billion = £6.355 billion
Step 2 – Apply the ratio
1:4, so mobile = 1/5th of £6.335 billion = £1.27 billion
Thus the correct answer is (C) £1.27 billion
For personal use only. Unauthorised copying or Page 18 AssessmentDay
distribution in printed, electronic, or any other
form in whole or in part, is prohibited without
Document last updated 11-12-2012
www.assessmentday.co.uk
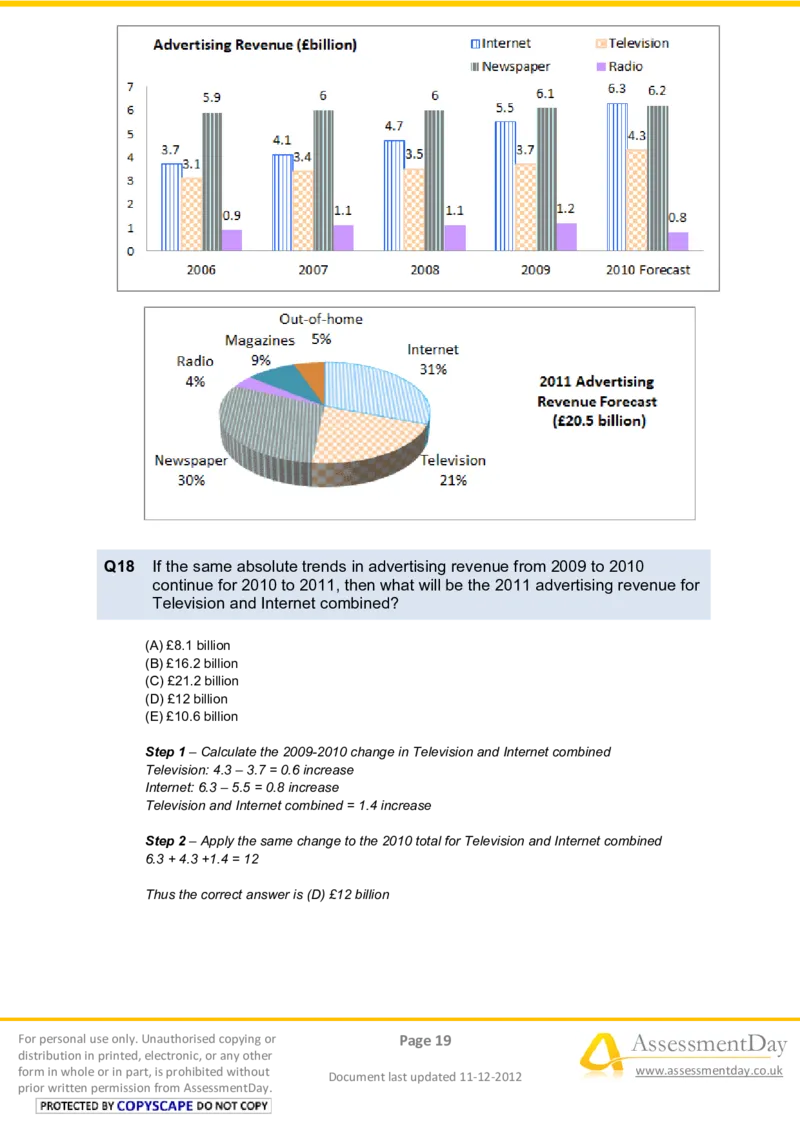
prior written permission from AssessmentDay.Q18 If the same absolute trends in advertising revenue from 2009 to 2010
continue for 2010 to 2011, then what will be the 2011 advertising revenue for
Television and Internet combined?
(A) £8.1 billion
(B) £16.2 billion
(C) £21.2 billion
(D) £12 billion
(E) £10.6 billion
Step 1 – Calculate the 2009-2010 change in Television and Internet combined
Television: 4.3 – 3.7 = 0.6 increase
Internet: 6.3 – 5.5 = 0.8 increase
Television and Internet combined = 1.4 increase
Step 2 – Apply the same change to the 2010 total for Television and Internet combined
6.3 + 4.3 +1.4 = 12
Thus the correct answer is (D) £12 billion
For personal use only. Unauthorised copying or Page 19 AssessmentDay
distribution in printed, electronic, or any other
form in whole or in part, is prohibited without
Document last updated 11-12-2012
www.assessmentday.co.uk
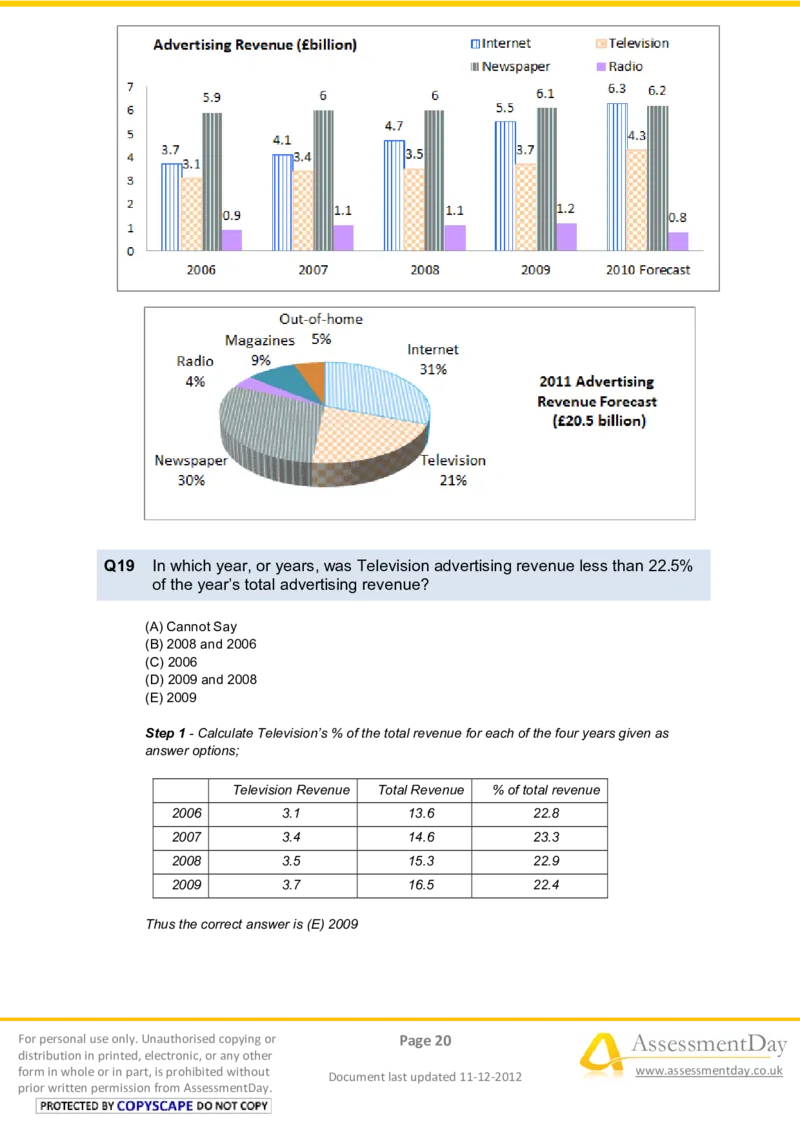
prior written permission from AssessmentDay.Q19 In which year, or years, was Television advertising revenue less than 22.5%
of the year’s total advertising revenue?
(A) Cannot Say
(B) 2008 and 2006
(C) 2006
(D) 2009 and 2008
(E) 2009
Step 1 - Calculate Television’s % of the total revenue for each of the four years given as
answer options;
Television Revenue Total Revenue % of total revenue
2006 3.1 13.6 22.8
2007 3.4 14.6 23.3
2008 3.5 15.3 22.9
2009 3.7 16.5 22.4
Thus the correct answer is (E) 2009
For personal use only. Unauthorised copying or Page 20 AssessmentDay
distribution in printed, electronic, or any other
form in whole or in part, is prohibited without
Document last updated 11-12-2012
www.assessmentday.co.uk
prior written permission from AssessmentDay.Q20 If in 2009 an external market force had reduced the year’s advertising
revenue from Newspapers by 10% and from the Internet by 20%, then what
was the total 2009 advertising revenue?
(A) None of these
(B) £9.89 billion
(C) £11.6 billion
(D) £10.44 billion
(E) £14.79 billion
Step 1 – Calculate the adjusted Newspaper revenue
6.1 x 90% = 5.49
Step 2 – Calculate the adjusted Internet revenue
5.5 x 80% = 4.4
Step 3 – Calculate the adjusted total 2009 advertising revenue
5.49 + 4.4 + 3.7 (television) + 1.2 (radio) = 14.79
Thus the correct answer is (E) £14.79 billion
For personal use only. Unauthorised copying or Page 21 AssessmentDay
distribution in printed, electronic, or any other
form in whole or in part, is prohibited without
Document last updated 11-12-2012
www.assessmentday.co.uk
prior written permission from AssessmentDay.Q21 Of the regions shown what was the difference between the highest and the
lowest trade balance in 2008?
(A) None of these
(B) $5,100 million
(C) $510 million
(D) $5,400 million
(E) $5,600 million
Step 1 - Use the graph (i.e. 2008 figures) to calculate the trading balance (exports – imports)
for each region
Exports – imports ($million)
China 30,000 – 22,800 = 7,200
United Kingdom 30,600 – 28,500 = 2,100
Japan 29,400 – 24,500 = 4,900
South America 32,000 – 30,400 = 1,600
Russia 31,300 – 29,500 = 1,800
Step 2 – Calculate the difference between the highest and the lowest trading balance
7,200 – 1,600 = $5,600 million
Thus the correct answer is (E) $5,600 million
For personal use only. Unauthorised copying or Page 22 AssessmentDay
distribution in printed, electronic, or any other
form in whole or in part, is prohibited without
Document last updated 11-12-2012
www.assessmentday.co.uk
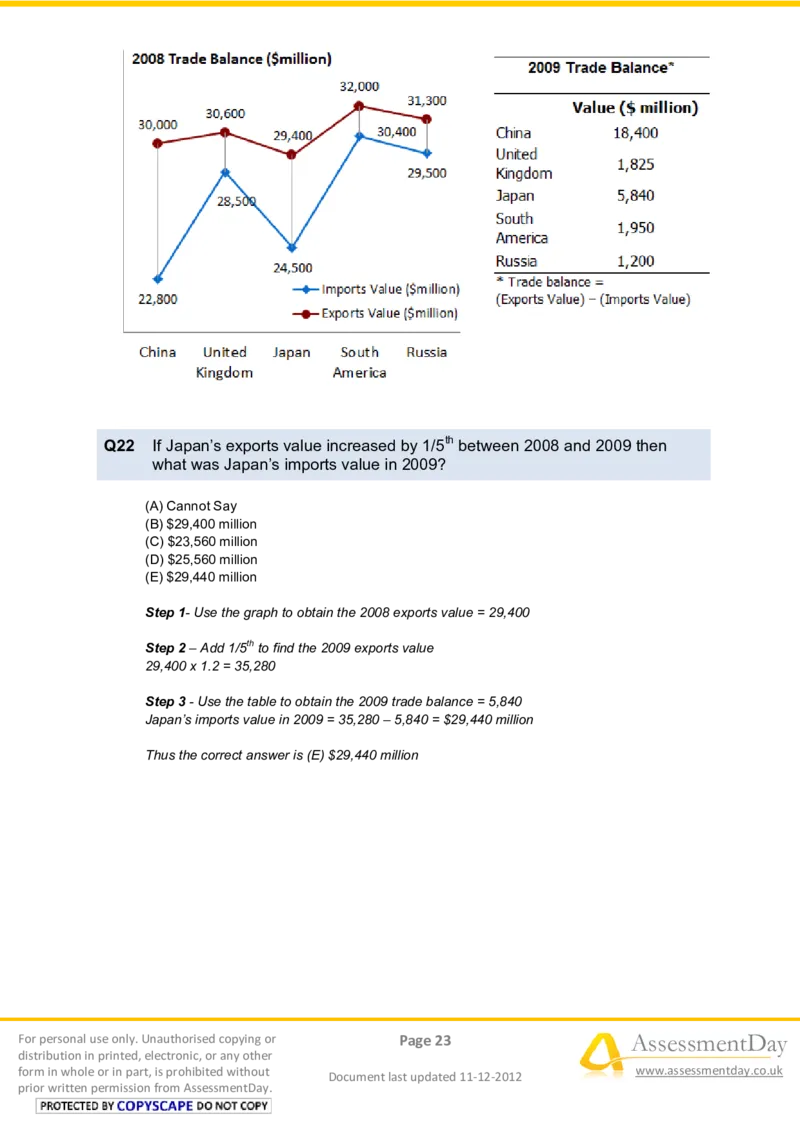
prior written permission from AssessmentDay.Q22 If Japan’s exports value increased by 1/5th between 2008 and 2009 then
what was Japan’s imports value in 2009?
(A) Cannot Say
(B) $29,400 million
(C) $23,560 million
(D) $25,560 million
(E) $29,440 million
Step 1- Use the graph to obtain the 2008 exports value = 29,400
Step 2 – Add 1/5th to find the 2009 exports value
29,400 x 1.2 = 35,280
Step 3 - Use the table to obtain the 2009 trade balance = 5,840
Japan’s imports value in 2009 = 35,280 – 5,840 = $29,440 million
Thus the correct answer is (E) $29,440 million
For personal use only. Unauthorised copying or Page 23 AssessmentDay
distribution in printed, electronic, or any other
form in whole or in part, is prohibited without
Document last updated 11-12-2012
www.assessmentday.co.uk
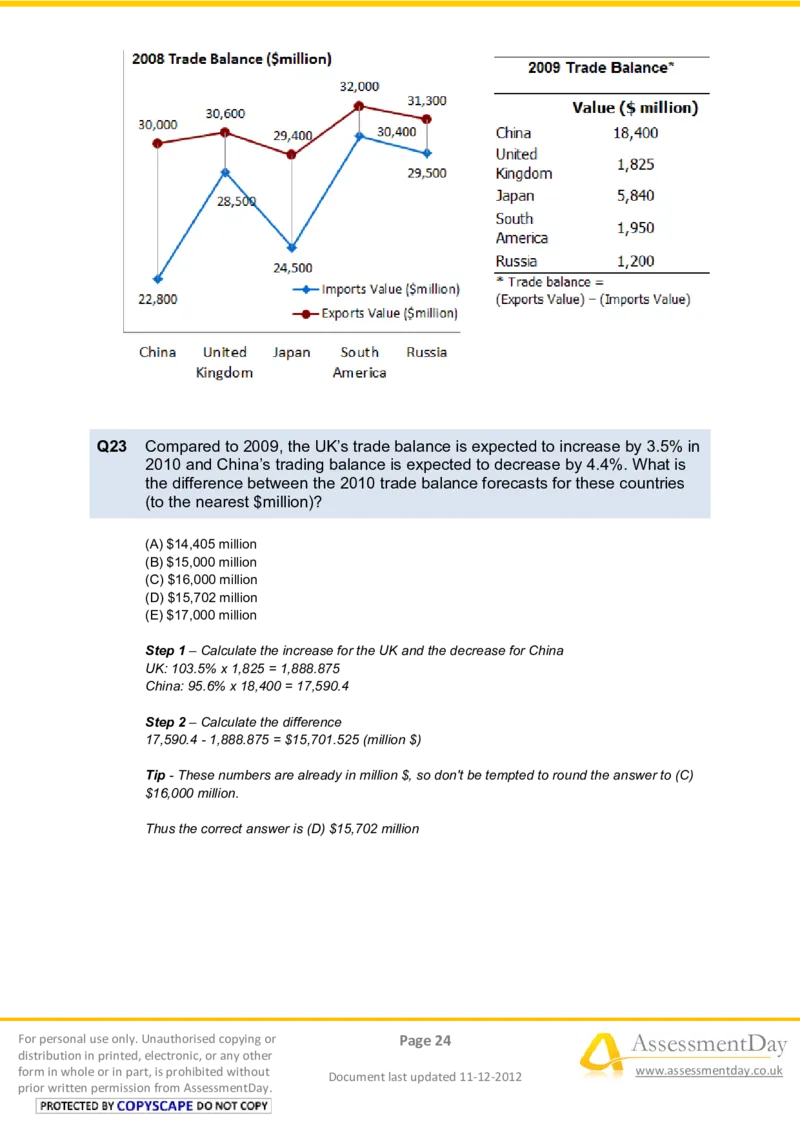
prior written permission from AssessmentDay.Q23 Compared to 2009, the UK’s trade balance is expected to increase by 3.5% in
2010 and China’s trading balance is expected to decrease by 4.4%. What is
the difference between the 2010 trade balance forecasts for these countries
(to the nearest $million)?
(A) $14,405 million
(B) $15,000 million
(C) $16,000 million
(D) $15,702 million
(E) $17,000 million
Step 1 – Calculate the increase for the UK and the decrease for China
UK: 103.5% x 1,825 = 1,888.875
China: 95.6% x 18,400 = 17,590.4
Step 2 – Calculate the difference
17,590.4 - 1,888.875 = $15,701.525 (million $)
Tip - These numbers are already in million $, so don't be tempted to round the answer to (C)
$16,000 million.
Thus the correct answer is (D) $15,702 million
For personal use only. Unauthorised copying or Page 24 AssessmentDay
distribution in printed, electronic, or any other
form in whole or in part, is prohibited without
Document last updated 11-12-2012
www.assessmentday.co.uk
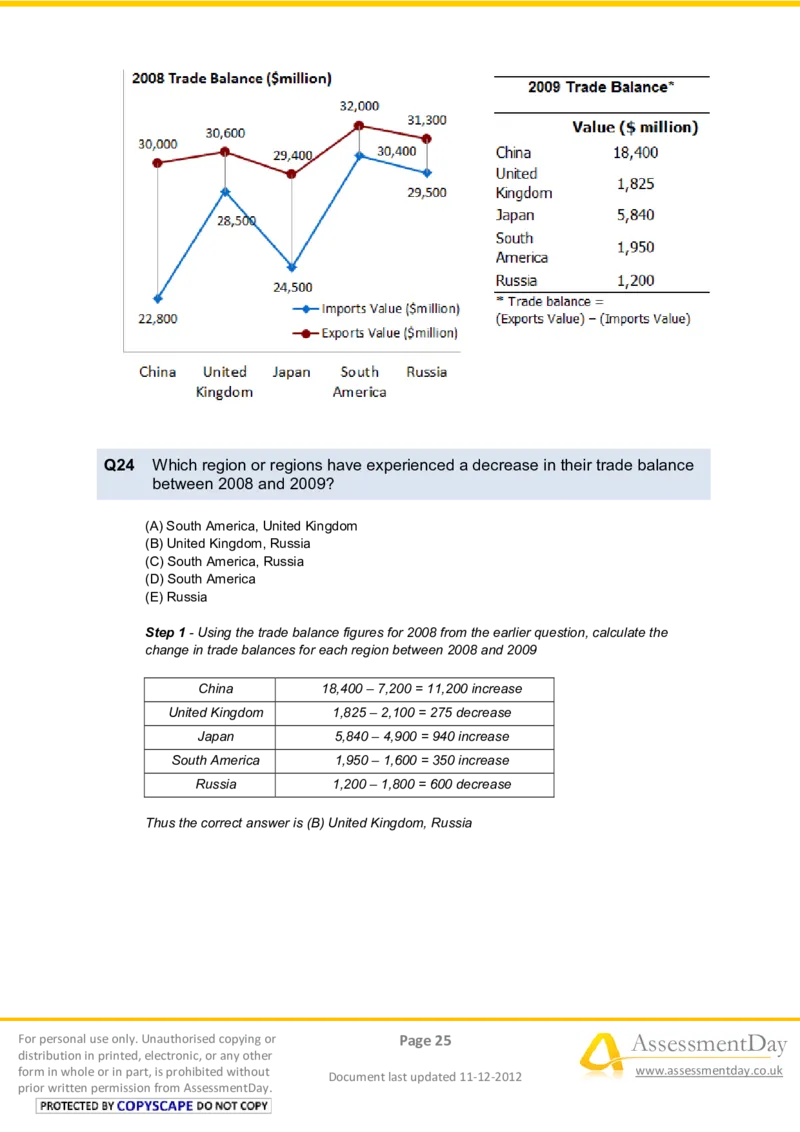
prior written permission from AssessmentDay.Q24 Which region or regions have experienced a decrease in their trade balance
between 2008 and 2009?
(A) South America, United Kingdom
(B) United Kingdom, Russia
(C) South America, Russia
(D) South America
(E) Russia
Step 1 - Using the trade balance figures for 2008 from the earlier question, calculate the
change in trade balances for each region between 2008 and 2009
China 18,400 – 7,200 = 11,200 increase
United Kingdom 1,825 – 2,100 = 275 decrease
Japan 5,840 – 4,900 = 940 increase
South America 1,950 – 1,600 = 350 increase
Russia 1,200 – 1,800 = 600 decrease
Thus the correct answer is (B) United Kingdom, Russia
For personal use only. Unauthorised copying or Page 25 AssessmentDay
distribution in printed, electronic, or any other
form in whole or in part, is prohibited without
Document last updated 11-12-2012
www.assessmentday.co.uk
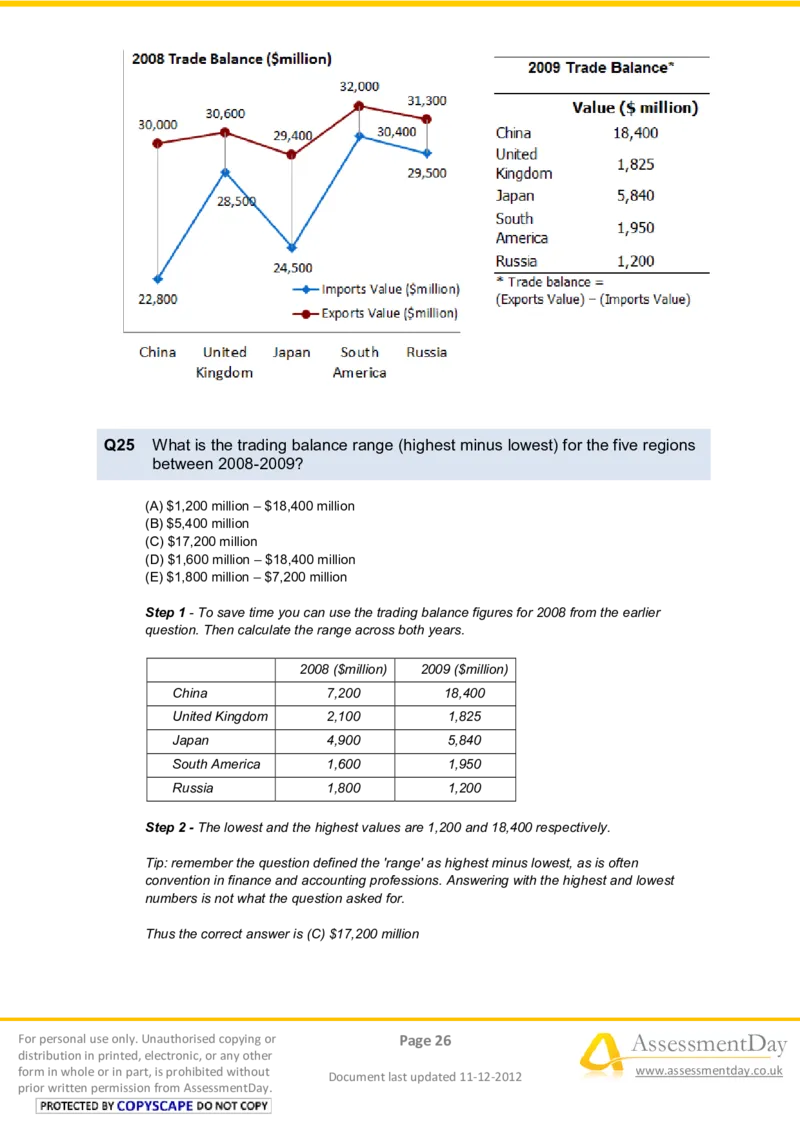
prior written permission from AssessmentDay.Q25 What is the trading balance range (highest minus lowest) for the five regions
between 2008-2009?
(A) $1,200 million – $18,400 million
(B) $5,400 million
(C) $17,200 million
(D) $1,600 million – $18,400 million
(E) $1,800 million – $7,200 million
Step 1 - To save time you can use the trading balance figures for 2008 from the earlier
question. Then calculate the range across both years.
2008 ($million) 2009 ($million)
China 7,200 18,400
United Kingdom 2,100 1,825
Japan 4,900 5,840
South America 1,600 1,950
Russia 1,800 1,200
Step 2 - The lowest and the highest values are 1,200 and 18,400 respectively.
Tip: remember the question defined the 'range' as highest minus lowest, as is often
convention in finance and accounting professions. Answering with the highest and lowest
numbers is not what the question asked for.
Thus the correct answer is (C) $17,200 million
For personal use only. Unauthorised copying or Page 26 AssessmentDay
distribution in printed, electronic, or any other
form in whole or in part, is prohibited without
Document last updated 11-12-2012
www.assessmentday.co.uk
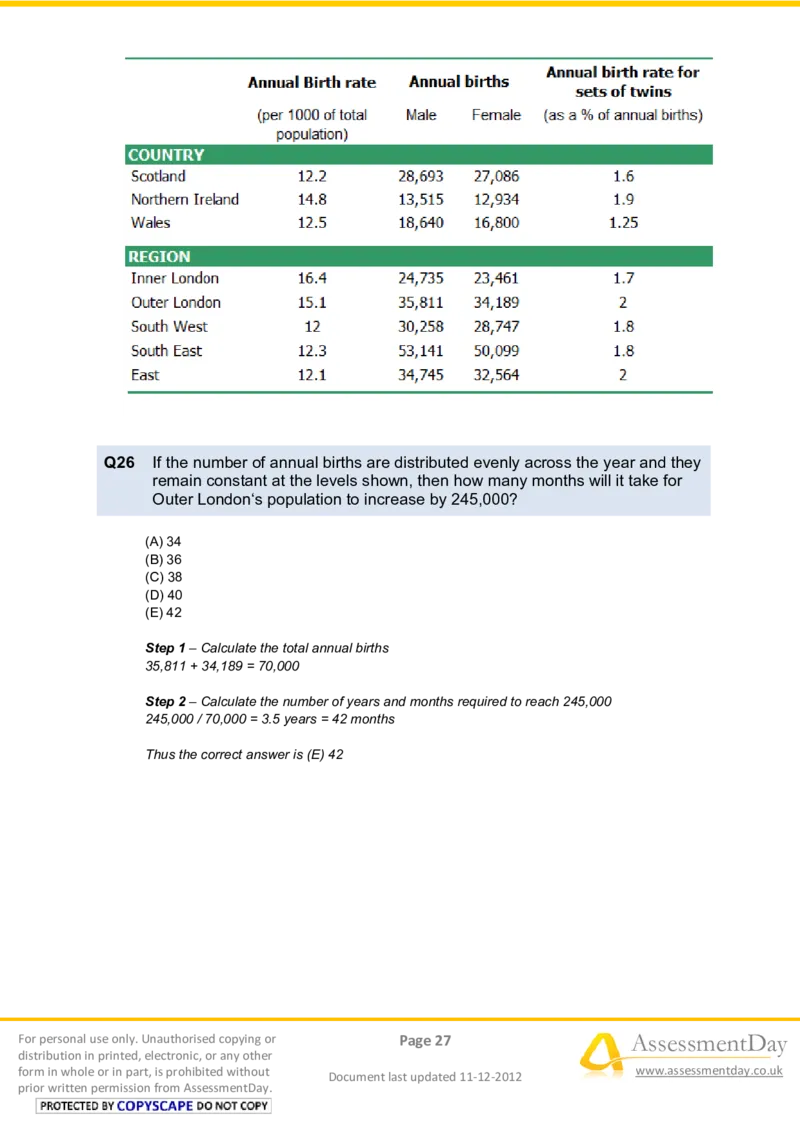
prior written permission from AssessmentDay.Q26 If the number of annual births are distributed evenly across the year and they
remain constant at the levels shown, then how many months will it take for
Outer London‘s population to increase by 245,000?
(A) 34
(B) 36
(C) 38
(D) 40
(E) 42
Step 1 – Calculate the total annual births
35,811 + 34,189 = 70,000
Step 2 – Calculate the number of years and months required to reach 245,000
245,000 / 70,000 = 3.5 years = 42 months
Thus the correct answer is (E) 42
For personal use only. Unauthorised copying or Page 27 AssessmentDay
distribution in printed, electronic, or any other
form in whole or in part, is prohibited without
Document last updated 11-12-2012
www.assessmentday.co.uk
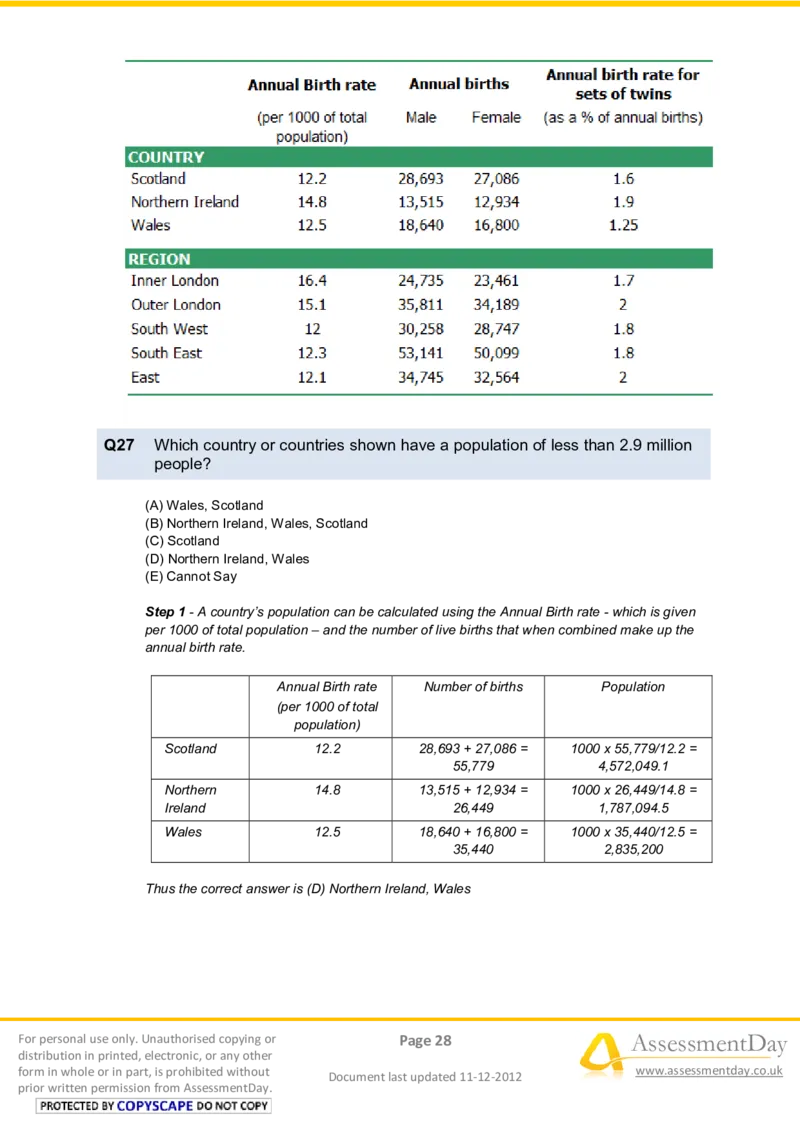
prior written permission from AssessmentDay.Q27 Which country or countries shown have a population of less than 2.9 million
people?
(A) Wales, Scotland
(B) Northern Ireland, Wales, Scotland
(C) Scotland
(D) Northern Ireland, Wales
(E) Cannot Say
Step 1 - A country’s population can be calculated using the Annual Birth rate - which is given
per 1000 of total population – and the number of live births that when combined make up the
annual birth rate.
Annual Birth rate Number of births Population
(per 1000 of total
population)
Scotland 12.2 28,693 + 27,086 = 1000 x 55,779/12.2 =
55,779 4,572,049.1
Northern 14.8 13,515 + 12,934 = 1000 x 26,449/14.8 =
Ireland 26,449 1,787,094.5
Wales 12.5 18,640 + 16,800 = 1000 x 35,440/12.5 =
35,440 2,835,200
Thus the correct answer is (D) Northern Ireland, Wales
For personal use only. Unauthorised copying or Page 28 AssessmentDay
distribution in printed, electronic, or any other
form in whole or in part, is prohibited without
Document last updated 11-12-2012
www.assessmentday.co.uk
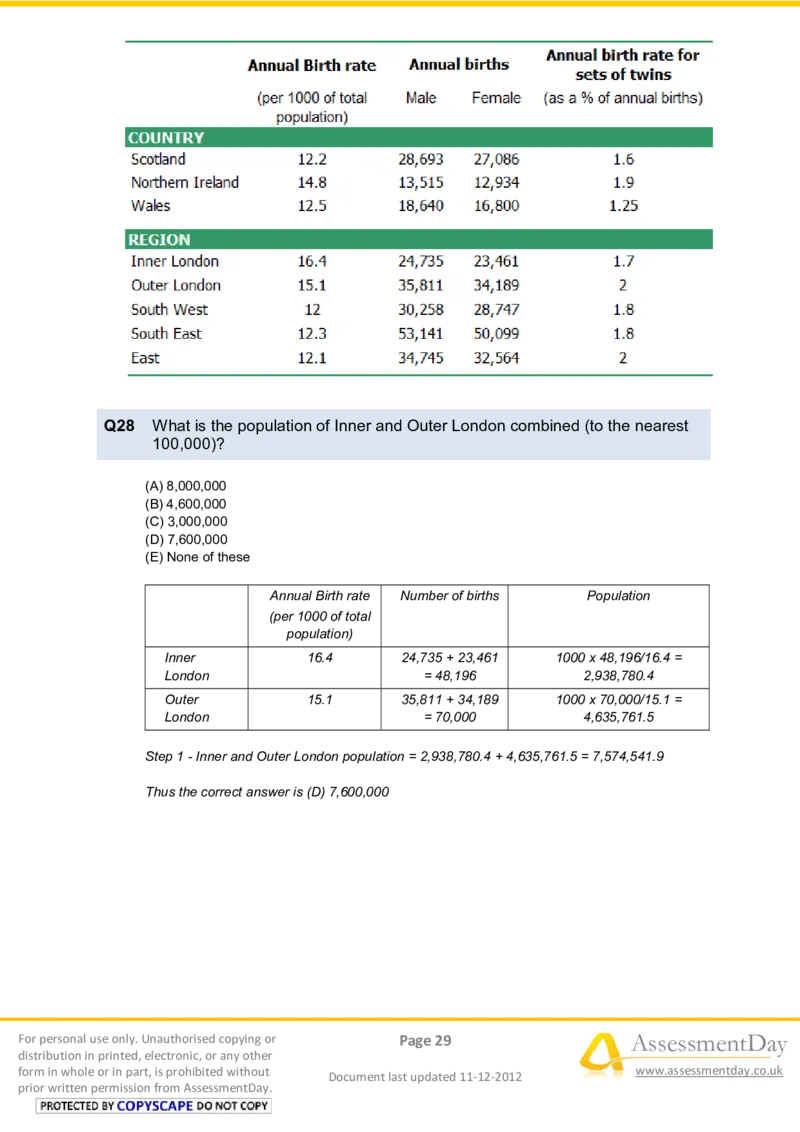
prior written permission from AssessmentDay.Q28 What is the population of Inner and Outer London combined (to the nearest
100,000)?
(A) 8,000,000
(B) 4,600,000
(C) 3,000,000
(D) 7,600,000
(E) None of these
Annual Birth rate Number of births Population
(per 1000 of total
population)
Inner 16.4 24,735 + 23,461 1000 x 48,196/16.4 =
London = 48,196 2,938,780.4
Outer 15.1 35,811 + 34,189 1000 x 70,000/15.1 =
London = 70,000 4,635,761.5
Step 1 - Inner and Outer London population = 2,938,780.4 + 4,635,761.5 = 7,574,541.9
Thus the correct answer is (D) 7,600,000
For personal use only. Unauthorised copying or Page 29 AssessmentDay
distribution in printed, electronic, or any other
form in whole or in part, is prohibited without
Document last updated 11-12-2012
www.assessmentday.co.uk
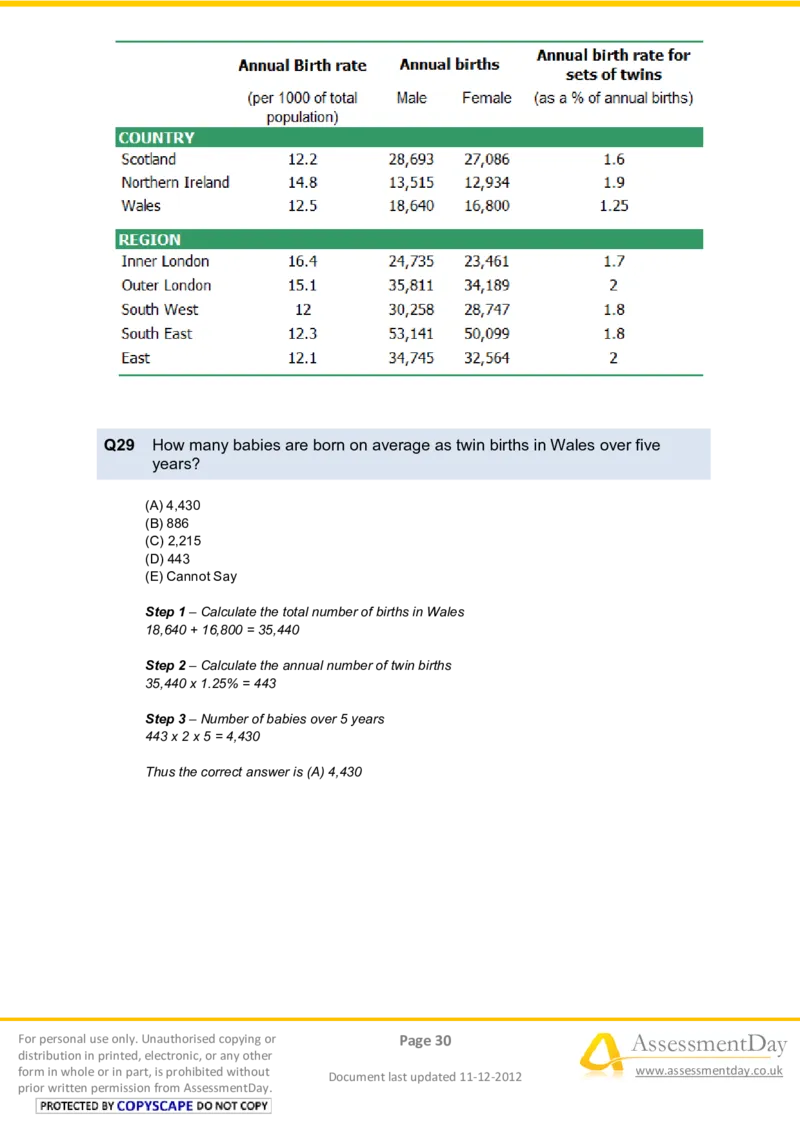
prior written permission from AssessmentDay.Q29 How many babies are born on average as twin births in Wales over five
years?
(A) 4,430
(B) 886
(C) 2,215
(D) 443
(E) Cannot Say
Step 1 – Calculate the total number of births in Wales
18,640 + 16,800 = 35,440
Step 2 – Calculate the annual number of twin births
35,440 x 1.25% = 443
Step 3 – Number of babies over 5 years
443 x 2 x 5 = 4,430
Thus the correct answer is (A) 4,430
For personal use only. Unauthorised copying or Page 30 AssessmentDay
distribution in printed, electronic, or any other
form in whole or in part, is prohibited without
Document last updated 11-12-2012
www.assessmentday.co.uk
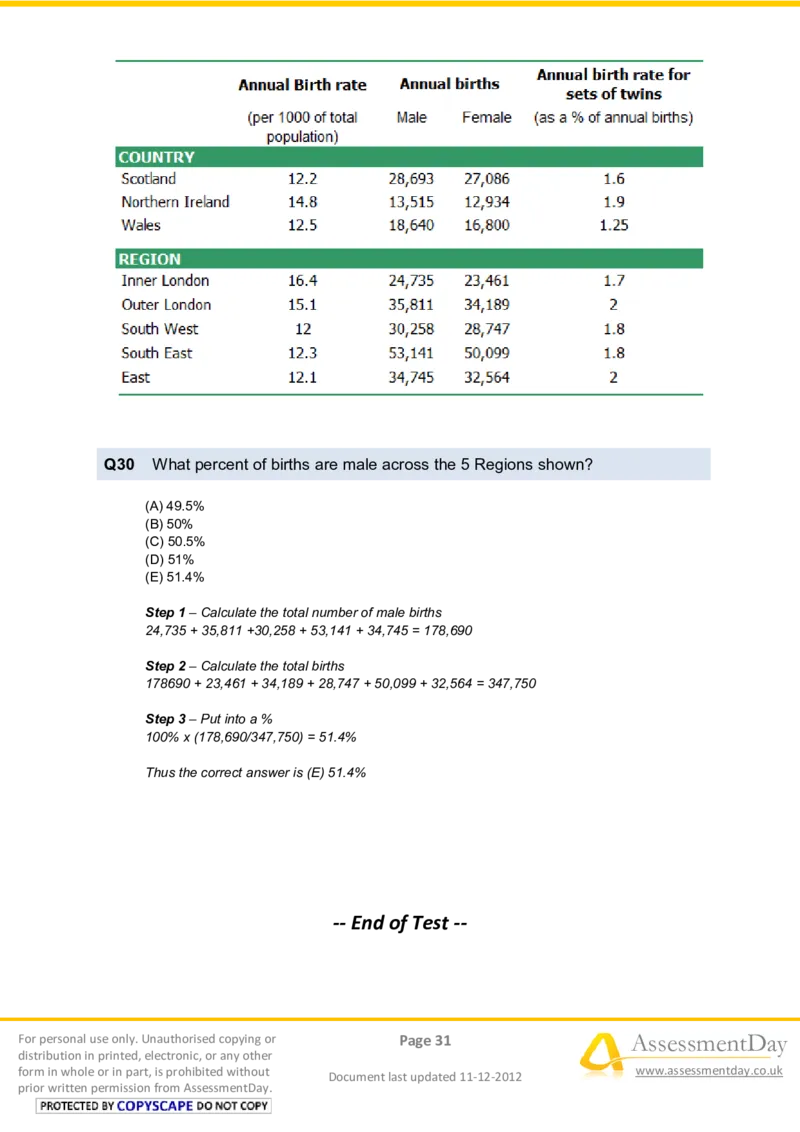
prior written permission from AssessmentDay.Q30 What percent of births are male across the 5 Regions shown?
(A) 49.5%
(B) 50%
(C) 50.5%
(D) 51%
(E) 51.4%
Step 1 – Calculate the total number of male births
24,735 + 35,811 +30,258 + 53,141 + 34,745 = 178,690
Step 2 – Calculate the total births
178690 + 23,461 + 34,189 + 28,747 + 50,099 + 32,564 = 347,750
Step 3 – Put into a %
100% x (178,690/347,750) = 51.4%
Thus the correct answer is (E) 51.4%
-- End of Test --
For personal use only. Unauthorised copying or Page 31 AssessmentDay
distribution in printed, electronic, or any other
form in whole or in part, is prohibited without
Document last updated 11-12-2012
www.assessmentday.co.uk
prior written permission from AssessmentDay.

