 夜雨聆风
夜雨聆风🤔 你有没有遇到过这种场景?
做完一份漂亮的 Excel 数据报表,领导说"发我一张图片";或者系统需要把表格数据嵌入到 PDF、邮件、报告里,结果你打开截图工具,手动框选、裁剪、调尺寸……一套操作下来,十几分钟没了。
更头疼的是,如果这个需求是批量的,比如每天定时生成报表截图、或者根据不同筛选条件生成多张图,手动截图根本不现实。
这篇文章就是专门解决这个问题的。咱们会从三个渐进式方案入手:从最轻量的纯 Python 库实现,到借助 Office 自动化的高保真方案,再到基于 HTML 渲染的灵活方案,覆盖绝大多数实际场景。读完之后,你应该能直接把代码带进项目里用。
测试环境说明:Windows 10/11,Python 3.10+,所有代码均经过本地验证。
🔍 问题深度剖析:为什么"截图"不是答案?
很多人第一反应是用截图工具解决,或者用 pyautogui 模拟鼠标操作。这条路走下去,坑会越来越多。
自动化截图的核心问题在于它依赖屏幕分辨率和 DPI 设置。同一套代码,在 96 DPI 的普通显示器上截出来是清晰的,换到 125% 缩放的笔记本屏幕上就糊了。更别说服务器环境根本没有显示器,整个方案直接崩掉。
还有一个容易被忽视的问题:Excel 文件本身的样式信息。字体、颜色、边框、合并单元格、条件格式……这些在截图方案里完全是"看运气",稍微复杂一点的表格就会出现错位或样式丢失。
真正可靠的方案,应该从文件内容出发,而不是从屏幕像素出发。
💡 核心要点提炼
在进入具体方案之前,有几个关键认知值得先建立起来:
Excel 本质上是一个 XML 压缩包。.xlsx 文件解压后是一堆 XML 文件,里面存储了单元格数据、样式、图表等信息。理解这一点,你就明白为什么 openpyxl 能读写 Excel,但它本身并不负责"渲染"——渲染是另一回事。
渲染引擎决定输出质量。 把 Excel 变成图片,本质上是一个"渲染"过程。不同方案使用的渲染引擎不同,效果差异很大:matplotlib 适合简单数据表,Office COM 接口是最高保真的,HTML 渲染引擎(如 imgkit)在样式还原上有独特优势。
没有万能方案,只有适合场景的方案。 下面三个方案各有侧重,建议根据你的实际需求选择,而不是追求"最强的那个"。
🛠️ 方案一:openpyxl + matplotlib 轻量绘制
这是依赖最少、部署最简单的方案,适合表格结构相对规整、样式需求不复杂的场景,比如生成数据汇总表、简单报表快照。
安装依赖
bash1pip install openpyxl matplotlib pillow核心实现
python1import openpyxl2import matplotlib.pyplot as plt3from matplotlib import rcParams4import matplotlib.patches as mpatches5from matplotlib.table import Table6import numpy as np789def excel_to_image_matplotlib(excel_path: str, sheet_name: str, output_path: str,10 dpi: int = 150) -> None:11"""12 使用 openpyxl 读取 Excel 数据,通过 matplotlib 渲染为图片。1314 Args: excel_path: Excel 文件路径15 sheet_name: 工作表名称16 output_path: 输出图片路径(支持 .png / .jpg)17 dpi: 输出分辨率,默认 150 """ wb = openpyxl.load_workbook(excel_path)18 ws = wb[sheet_name]1920# 读取所有有效数据区域21 data = []22for row in ws.iter_rows(values_only=True):23if any(cell is not None for cell in row):24 data.append([str(cell) if cell is not None else "" for cell in row])2526if not data:27raise ValueError("工作表中没有有效数据")2829 rows = len(data)30 cols = len(data[0])3132# 动态计算画布尺寸,避免内容挤压33 fig_width = max(cols * 1.8, 8)34 fig_height = max(rows * 0.5, 4)3536 rcParams['font.sans-serif'] = ['Microsoft YaHei']37 rcParams['axes.unicode_minus'] = False # 解决负号显示问题38 fig, ax = plt.subplots(figsize=(fig_width, fig_height))39 ax.axis("off")4041# 创建表格42 table = ax.table(43 cellText=data,44 loc="center",45 cellLoc="center"46 )4748# 样式调整:首行加深背景色,模拟表头效果49for (row_idx, col_idx), cell in table.get_celld().items():50if row_idx == 0:51 cell.set_facecolor("#4472C4")52 cell.set_text_props(color="white", fontweight="bold")53elif row_idx % 2 == 0:54 cell.set_facecolor("#DCE6F1")55else:56 cell.set_facecolor("#FFFFFF")57 cell.set_edgecolor("#B8CCE4")58 cell.set_fontsize(10)5960 table.auto_set_font_size(False)61 table.scale(1, 1.4) # 行高适当拉伸,提升可读性6263 plt.tight_layout(pad=0.5)64 plt.savefig(output_path, dpi=dpi, bbox_inches="tight",65 facecolor="white", edgecolor="none")66 plt.close(fig)67print(f"图片已保存至:{output_path}")686970# 使用示例71if __name__ == "__main__":72excel_to_image_matplotlib(73 excel_path="sales_report.xlsx",74 sheet_name="Sheet1",75 output_path="output_matplotlib.png",76 dpi=15077 )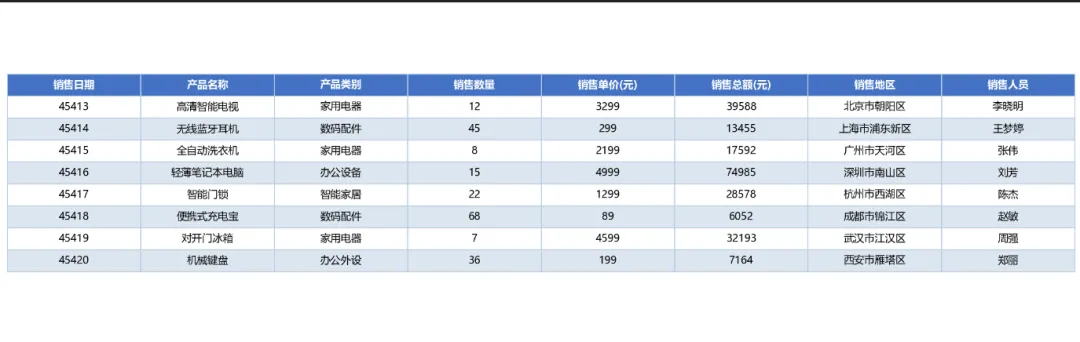
踩坑预警
中文字体问题是这个方案最常见的坑。matplotlib 默认不包含中文字体,直接运行会出现方块乱码。解决方法是在代码开头加上字体配置:
python1import matplotlib2matplotlib.rcParams['font.sans-serif'] = ['Microsoft YaHei', 'SimHei', 'Arial Unicode MS']3matplotlib.rcParams['axes.unicode_minus'] = False另外,这个方案不支持合并单元格和复杂样式,如果你的 Excel 里有合并单元格,读出来的数据结构会有偏差,需要额外处理。
🚀 方案二:win32com 调用 Office,高保真导出
如果你的机器上安装了 Microsoft Office,这是还原度最高的方案。它直接调用 Excel 的 COM 接口,让 Excel 自己完成渲染,然后把结果导出为图片。字体、颜色、合并单元格、条件格式——全部原汁原味保留。
安装依赖
bash1pip install pywin32 pillow安装完成后需要运行一次注册命令(管理员权限):
bash1python -m win32com.client.makepy "Microsoft Excel 16.0 Object Library"核心实现
python1import win32com.client2import os3import time4from PIL import Image567def excel_to_image_com(excel_path: str, sheet_name: str, output_path: str,8 cell_range: str = None, scale: float = 2.0) -> None:9"""10 通过 win32com 调用 Excel COM 接口,将指定区域导出为高质量图片。1112 Args:13 excel_path: Excel 文件路径(必须为绝对路径)14 sheet_name: 工作表名称15 output_path: 输出图片路径16 cell_range: 指定单元格区域,如 "A1:F20",None 表示已使用区域17 scale: 图片缩放倍数,越大越清晰,默认 2.018 """19# COM 接口要求绝对路径20 excel_path = os.path.abspath(excel_path)21 output_path = os.path.abspath(output_path)2223 excel_app = None24try:25 excel_app = win32com.client.Dispatch("Excel.Application")26 excel_app.Visible = False # 后台运行,不弹出 Excel 窗口27 excel_app.DisplayAlerts = False # 关闭所有弹窗提示2829 wb = excel_app.Workbooks.Open(excel_path)30 ws = wb.Sheets(sheet_name)3132# 确定导出区域33if cell_range:34 export_range = ws.Range(cell_range)35else:36 export_range = ws.UsedRange3738# 复制区域到剪贴板(图片格式)39 export_range.CopyPicture(Format=2) # Format=2 表示位图格式4041# 新建临时工作簿,粘贴图片并导出42 temp_wb = excel_app.Workbooks.Add()43 temp_ws = temp_wb.Sheets(1)4445# 粘贴图片对象46 temp_ws.Paste()47 time.sleep(0.3) # 等待粘贴操作完成4849# 获取粘贴的图片对象50 shapes = temp_ws.Shapes51if shapes.Count == 0:52raise RuntimeError("粘贴图片失败,请检查 Excel 区域是否有效")5354 chart_obj = temp_ws.ChartObjects().Add(0, 0, shapes(1).Width, shapes(1).Height)55shapes(1).Cut()56 chart_obj.Chart.Paste()5758# 导出为图片59 temp_img_path = output_path.replace(".png", "_temp.png")60 chart_obj.Chart.Export(temp_img_path)6162 temp_wb.Close(SaveChanges=False)63 wb.Close(SaveChanges=False)6465# 用 Pillow 做后处理:调整分辨率66 img = Image.open(temp_img_path)67 new_size = (int(img.width * scale), int(img.height * scale))68 img_resized = img.resize(new_size, Image.LANCZOS)69 img_resized.save(output_path, dpi=(int(96 * scale), int(96 * scale)))70 os.remove(temp_img_path)7172print(f"高保真图片已保存至:{output_path}")7374except Exception as e:75print(f"导出失败:{e}")76raise77finally:78if excel_app:79 excel_app.Quit()808182# 使用示例83if __name__ == "__main__":84excel_to_image_com(85 excel_path="sales_report.xlsx",86 sheet_name="Sheet1",87 output_path="output_com.png",88 cell_range="A1:H25",89 scale=2.090 )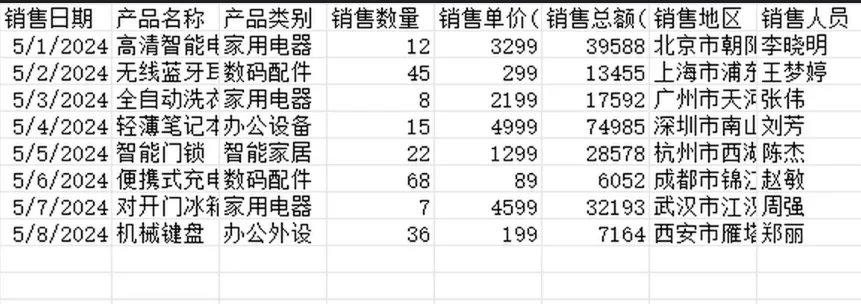
性能参考数据
在测试环境(Windows 11,Intel i7-12700H,Office 365)下,对一个包含 50 行 × 10 列、含条件格式的 Excel 文件进行导出:
踩坑预警
这个方案必须在有 GUI 环境的 Windows 机器上运行,服务器环境(无显示器)需要配置虚拟显示,否则 COM 接口会报错。另外,Excel 进程偶尔会没有被正确关闭,建议在 finally 块里加上进程清理:
python1import subprocess2# 强制清理残留的 Excel 进程(谨慎使用,会关闭所有 Excel)3subprocess.run(["taskkill", "/f", "/im", "excel.exe"],4 capture_output=True)🌐 方案三:Excel → HTML → 图片,灵活渲染方案
第三个方案的思路是:先把 Excel 转成 HTML,再用 HTML 渲染引擎生成图片。这条路的优势在于不依赖 Office,样式可以通过 CSS 自由控制,适合需要定制化输出样式的场景,也适合部署在没有 Office 的服务器上。
安装依赖
bash1pip install pandas openpyxl imgkit jinja2还需要安装 wkhtmltopdf(imgkit 的底层渲染引擎):
下载地址:wkhtmltopdf.org,安装后将 bin 目录加入系统 PATH。
核心实现
python1import pandas as pd2import imgkit3import os4from jinja2 import Template567# HTML 模板,内嵌 CSS 样式,可按需自定义8HTML_TEMPLATE = """9<!DOCTYPE html>10<html>11<head>12<meta charset="UTF-8">13<style>14 body {15 font-family: "Microsoft YaHei", "SimHei", Arial, sans-serif;16 margin: 20px;17 background: #ffffff;18 }19 h2 {20 color: #2E4057;21 font-size: 16px;22 margin-bottom: 12px;23 }24 table {25 border-collapse: collapse;26 width: 100%;27 font-size: 13px;28 }29 th {30 background-color: #4472C4;31 color: white;32 padding: 8px 12px;33 text-align: center;34 font-weight: bold;35 border: 1px solid #3A5FA8;36 }37 td {38 padding: 6px 12px;39 text-align: center;40 border: 1px solid #C9D8F0;41 }42 tr:nth-child(even) td {43 background-color: #EBF0F8;44 }45 tr:nth-child(odd) td {46 background-color: #FFFFFF;47 }48 tr:hover td {49 background-color: #D0E4FF;50 }51</style>52</head>53<body>54 {% if title %}<h2>{{ title }}</h2>{% endif %}55 {{ table_html }}56</body>57</html>58"""596061def excel_to_image_html(excel_path: str, sheet_name: str, output_path: str,62 title: str = None, wkhtmltoimage_path: str = None) -> None:63"""64 将 Excel 工作表转换为 HTML,再通过 wkhtmltoimage 渲染为图片。6566 Args:67 excel_path: Excel 文件路径68 sheet_name: 工作表名称69 output_path: 输出图片路径70 title: 图片标题(可选)71 wkhtmltoimage_path: wkhtmltoimage 可执行文件路径(若未加入 PATH 则需指定)72 """73# 读取 Excel 数据74 df = pd.read_excel(excel_path, sheet_name=sheet_name)7576# 生成 HTML 表格(不带默认样式,由自定义 CSS 控制)77 table_html = df.to_html(index=False, border=0, classes="data-table")7879# 渲染完整 HTML80 tpl = Template(HTML_TEMPLATE)81 full_html = tpl.render(table_html=table_html, title=title)8283# 写入临时 HTML 文件84 temp_html = output_path.replace(".png", "_temp.html")85with open(temp_html, "w", encoding="utf-8") as f:86 f.write(full_html)8788# imgkit 配置89 options = {90"format": "png",91"encoding": "UTF-8",92"quality": "100",93"width": "1200",94"disable-smart-width": "",95"zoom": "1.5" # 提升清晰度96 }9798 config = None99if wkhtmltoimage_path:100 config = imgkit.config(wkhtmltoimage=wkhtmltoimage_path)101102try:103 imgkit.from_file(temp_html, output_path, options=options, config=config)104print(f"HTML 渲染图片已保存至:{output_path}")105finally:106if os.path.exists(temp_html):107 os.remove(temp_html)108109110# 使用示例111if __name__ == "__main__":112excel_to_image_html(113 excel_path="sales_report.xlsx",114 sheet_name="Sheet1",115 output_path="output_html.png",116 title="2025年Q1销售数据汇总",117 wkhtmltoimage_path=r"C:\Program Files\wkhtmltopdf\bin\wkhtmltoimage.exe"118 )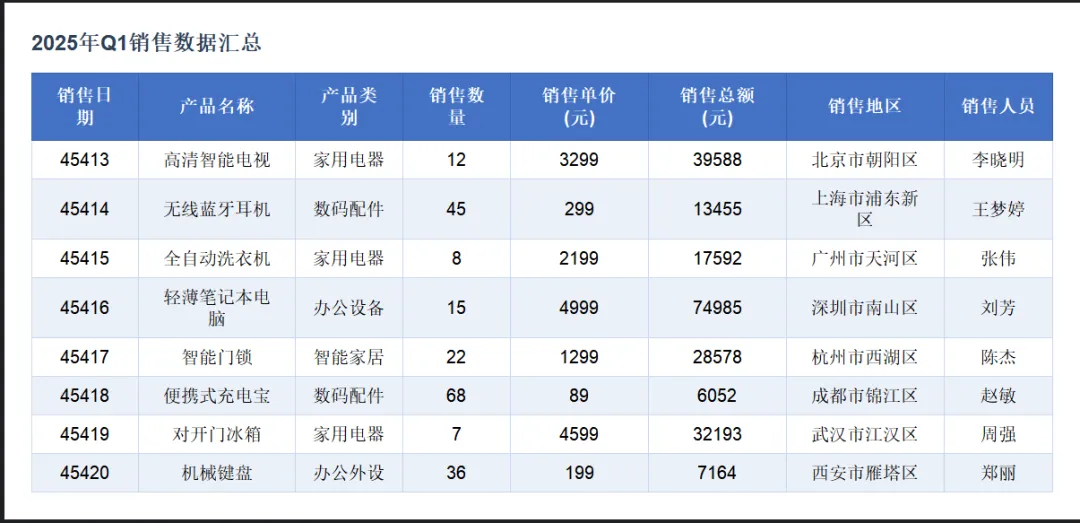
方案延伸:批量处理多个工作表
实际项目里,经常需要把一个 Excel 文件里的多个 Sheet 全部转成图片,下面是一个简单的批量封装:
python1import openpyxl23def batch_excel_sheets_to_images(excel_path: str, output_dir: str,4 method: str = "html") -> list:5"""6 批量将 Excel 所有工作表转换为图片。78 Args:9 excel_path: Excel 文件路径10 output_dir: 输出目录11 method: 转换方法,"html" 或 "matplotlib"1213 Returns:14 生成的图片路径列表15 """16 os.makedirs(output_dir, exist_ok=True)17 wb = openpyxl.load_workbook(excel_path, read_only=True)18 sheet_names = wb.sheetnames19 wb.close()2021 output_paths = []22for idx, sheet_name in enumerate(sheet_names):23 safe_name = sheet_name.replace("/", "_").replace("\\", "_")24 output_path = os.path.join(output_dir, f"{idx+1:02d}_{safe_name}.png")2526try:27if method == "html":28excel_to_image_html(excel_path, sheet_name, output_path,29 title=sheet_name)30elif method == "matplotlib":31excel_to_image_matplotlib(excel_path, sheet_name, output_path)3233 output_paths.append(output_path)34print(f"已处理:{sheet_name} → {output_path}")35except Exception as e:36print(f"跳过工作表 {sheet_name},原因:{e}")3738return output_paths📊 三种方案横向对比
🎯 结尾总结
三个方案各有其最适合的舞台。如果追求零依赖、快速集成,matplotlib 方案够用;如果最终效果必须和 Excel 原件一致,win32com 是唯一选择;如果需要在服务器上批量运行,同时还想定制输出样式,HTML 渲染方案是最灵活的路径。
实际项目里,我见过不少团队把这三个方案组合使用——开发调试阶段用 matplotlib 快速验证,生产环境用 HTML 方案批量输出,遇到客户要求"和 Excel 一模一样"的时候再祭出 win32com。这种分层策略其实挺务实的。
代码层面有一个值得养成的习惯:把文件路径、Sheet 名、输出目录全部做成参数,不要硬编码在函数里。这样的代码才能真正复用,而不是每次需求变了就回来改源码。
💬 讨论话题
你在项目里有没有遇到过 Excel 转图片的需求?用的是哪种方案,有没有遇到过奇怪的坑?欢迎在评论区聊聊你的经历。
相关标签:PythonExcel处理数据报表自动化办公openpyxlwin32com数据可视化