
文档内容
第二部分图表作文讲解
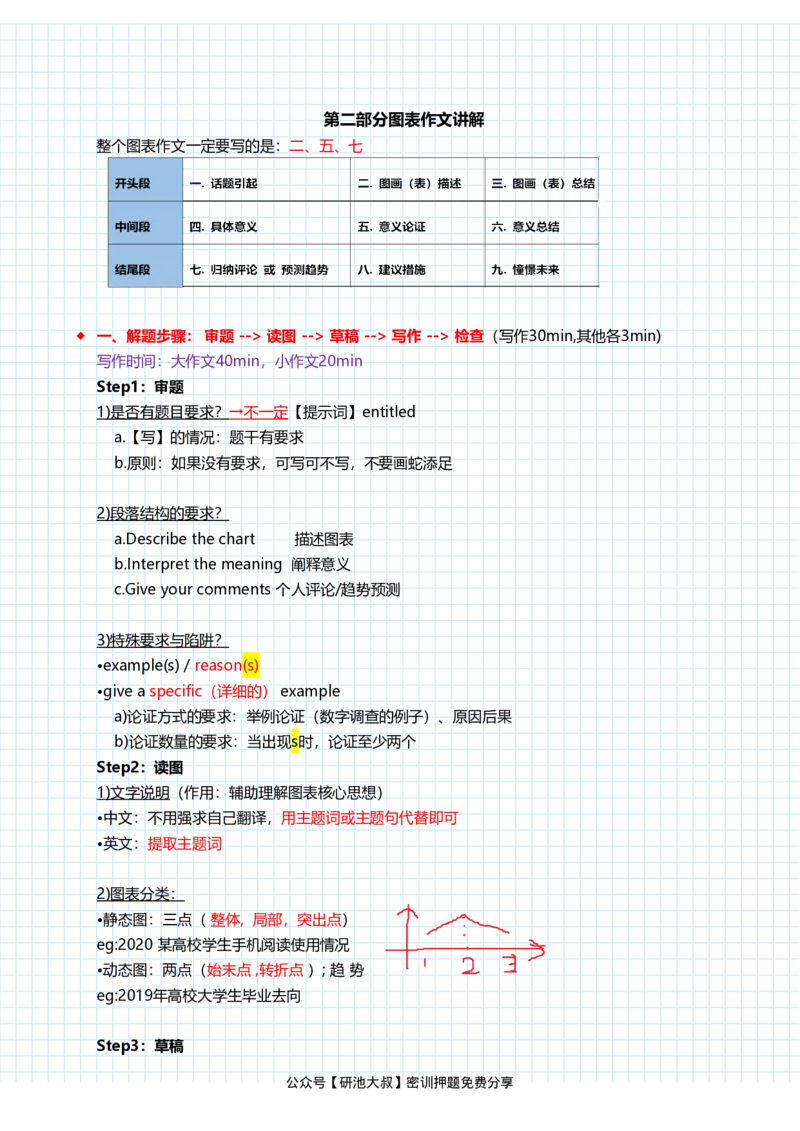
整个图表作文一定要写的是:二、五、七
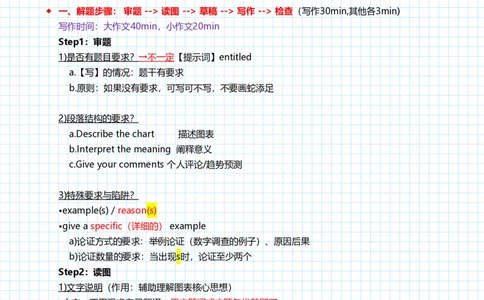
一、解题步骤: 审题 --> 读图 --> 草稿 --> 写作 --> 检查(写作30min,其他各3min)
写作时间:大作文40min,小作文20min
Step1:审题
1)是否有题目要求?→不一定【提示词】entitled
a.【写】的情况:题干有要求
b.原则:如果没有要求,可写可不写,不要画蛇添足
2)段落结构的要求?
a.Describe the chart 描述图表
b.Interpret the meaning 阐释意义
c.Give your comments 个人评论/趋势预测
3)特殊要求与陷阱?
•example(s) / reason(s)
•give a specific(详细的) example
a)论证方式的要求:举例论证(数字调查的例子)、原因后果
b)论证数量的要求:当出现s时,论证至少两个
Step2:读图
1)文字说明(作用:辅助理解图表核心思想)
•中文:不用强求自己翻译,用主题词或主题句代替即可
•英文:提取主题词
2)图表分类:
•静态图:三点( 整体, 局部,突出点)
eg:2020 某高校学生手机阅读使用情况
•动态图:两点(始末点 ,转折点 ); 趋 势
eg:2019年高校大学生毕业去向
Step3:草稿
1)主题判断(仁者见仁,智者见智,一分为二看待问题)
公众号【研池大叔】密训押题免费分享
分区 新分区2 的第1 页1)主题判断(仁者见仁,智者见智,一分为二看待问题)
a.正面话题
b.中立话题
c.负面话题
2)主题词和主题句
a)主题词表达:
i.词性:名词、动名词….
ii.改编
-A 的意义
-A 和B 的关系
-A 对B 的影响
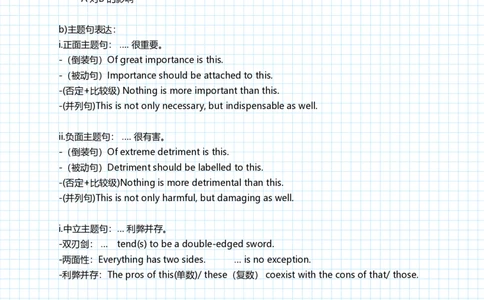
b)主题句表达:
i.正面主题句: …. 很重要。
-(倒装句)Of great importance is this.
-(被动句)Importance should be attached to this.
-(否定+比较级) Nothing is more important than this.
-(并列句)This is not only necessary, but indispensable as well.
ii.负面主题句: …. 很有害。
-(倒装句)Of extreme detriment is this.
-(被动句)Detriment should be labelled to this.
-(否定+比较级)Nothing is more detrimental than this.
-(并列句)This is not only harmful, but damaging as well.
i.中立主题句:… 利弊并存。
-双刃剑: … tend(s) to be a double-edged sword.
-两面性:Everything has two sides. … is no exception.
-利弊并存:The pros of this(单数)/ these(复数) coexist with the cons of that/ those.
3)内容
-开头段:图表描述
○ 主题词:名词、动名词、短语
○ 数据:起始点、突出点….
○ 程度
-中间段:意义论证方式
○ 举例论证 公众号:弦姐考研,免费分享
○ 原因后果:原因的角度
○ 对立观点:正反方
-结尾段:趋势 to do sth.
公众号【研池大叔】密训押题免费分享
分区 新分区2 的第2 页4)亮点:名言警句
i.位置:换九宫格的1/7/9,或写在1之前9之后
ii.如何改编?
示 例 :Knowledge is power. 2008(英语一). 合作:合作就是力量。
Step 4:写作(时态)
•通篇:
○ 原则:一般现在时
○ 注意:三单及特殊情况(第三人称单数,it)
•例外:
○ 过去式:已故者说的话,或者过去发生的事,或过去的数据变化
○ 将来时:趋势、未来
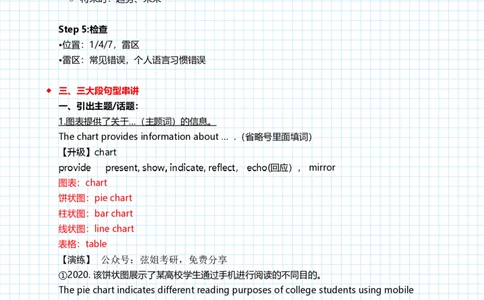
Step 5:检查
•位置:1/4/7,雷区
•雷区:常见错误,个人语言习惯错误
三、三大段句型串讲
一、引出主题/话题:
1.图表提供了关于…(主题词)的信息。
The chart provides information about … .(省略号里面填词)
(回应), mirror
图表:chart
饼状图:pie chart
柱状图:bar chart
线状图:line chart
表格:table
【演练】 公众号:弦姐考研,免费分享
①2020. 该饼状图展示了某高校学生通过手机进行阅读的不同目的。
The pie chart indicates different reading purposes of college students using mobile
phone in a certain college.
② 2018. 该饼状图展示了某城市 2017 年期间消费者在选择餐厅时的关注因素。
The pie chart shows different factors of customers' concern on choosing restaurants in
a certain city in 2017.
2.图表比较了… 和…
The chart compares …A… with …B. .
【示例】1999. 美国人口增长的速率
A the growth rate of U.S. population
物种灭绝的速率
B the extinction rate of wildlife
公众号【研池大叔】密训押题免费分享
分区 新分区2 的第3 页B the extinction rate of wildlife
The line chart compares the growth rate of U.S. population with the extinction rate of
wildlife.
【演练】2017. 该线状图比较了博物馆和访问者的上升趋势。
The line chart compares the upward trend of museums with that of visitors.
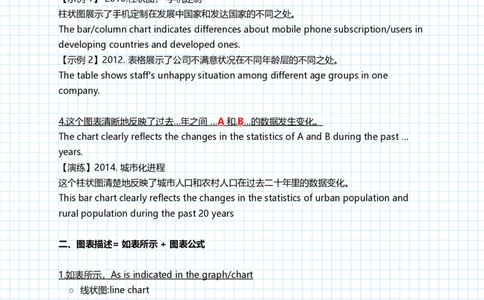
3.图表展示了… (某个主题)在… 方面的不同之处。
The chart shows the differences about/of(某个主题)… in…(某个方面的不同之处)
lects the changes in the statistics of A and B during the past … years.
【示例 1】 2010.柱状图, 手机定制
柱状图展示了手机定制在发展中国家和发达国家的不同之处。
The bar/column chart indicates differences about mobile phone subscription/users in
developing countries and developed ones.
【示例 2】2012. 表格展示了公司不满意状况在不同年龄层的不同之处。
The table shows staff's unhappy situation among different age groups in one
company.
4.这个图表清晰地反映了过去…年之间 …A和.B…的数据发生变化。
The chart clearly reflects the changes in the statistics of A and B during the past …
years.
【演练】2014. 城市化进程
这个柱状图清楚地反映了城市人口和农村人口在过去二十年里的数据变化。
This bar chart clearly reflects the changes in the statistics of urban population and
rural population during the past 20 years
二、图表描述= 如表所示 + 图表公式
1.如表所示,As is indicated in the graph/chart
○ 线状图:line chart
○ 柱状图:bar chart
○ 饼状图:pie chart
○ 表格:table
单独的动词可以加副词修饰
添加修饰: subtly indicated 微妙地揭示了, clearly indicated 清晰地揭示了
eg. 如饼状图所清晰地揭示了,
As id clearly indicated in the pie chart,
2.基本公式:
(1)静态图: 饼状图, 表格, 孤立的柱状图
公众号【研池大叔】密训押题免费分享
分区 新分区2 的第4 页①整体:该图表由…组成。
The chart consists of A, B and C.
The chart is composed of A , B and C.
【词汇】由…组成:consists of…, be composed of…
【演练】2015.春节消费 consumption/cost/expensein the Spring Festival
礼品 gift, 交通 traffic, 其他 others
→在 2015 年,春节消费的数量由礼品、交通和其他组成。
In 2015,the amount of expense in the Spring Festival is composed of gift,traffic and
others.
②局部:A …的比例是/占10%…。
The proportion/percentage/share/number of A… is/was/presents / accounts for 10%
…
【演练】2020. 学习知识的占比是 59.5%。
The percentage of learning knowledge accounts for 59.5%.
③突出点:最大/小/显著的比例是/来自于…
The largest/smallest/ most obvious proportion/share is/ comes from …
【演练】2017. 最显著的两个部分来自于欣赏风景和缓解压力。
The most obvious two proportions/parts come from sightseeing and relieving stress.
obvious可以替换成important,,apparent,shocking
④补充:
○ 各自地 respectively(放在句末或者动词之前)
○ 在所有类别中 of all categories
○ 具体而言:to be specific, specifically, specifically speaking
○ 当我们更仔细地看,我们会发现:When taking a closer look, we can find that .【突
出点】
○ 显然,最重要的...要素是... :Obviously, the most important ... factors are/factor is...
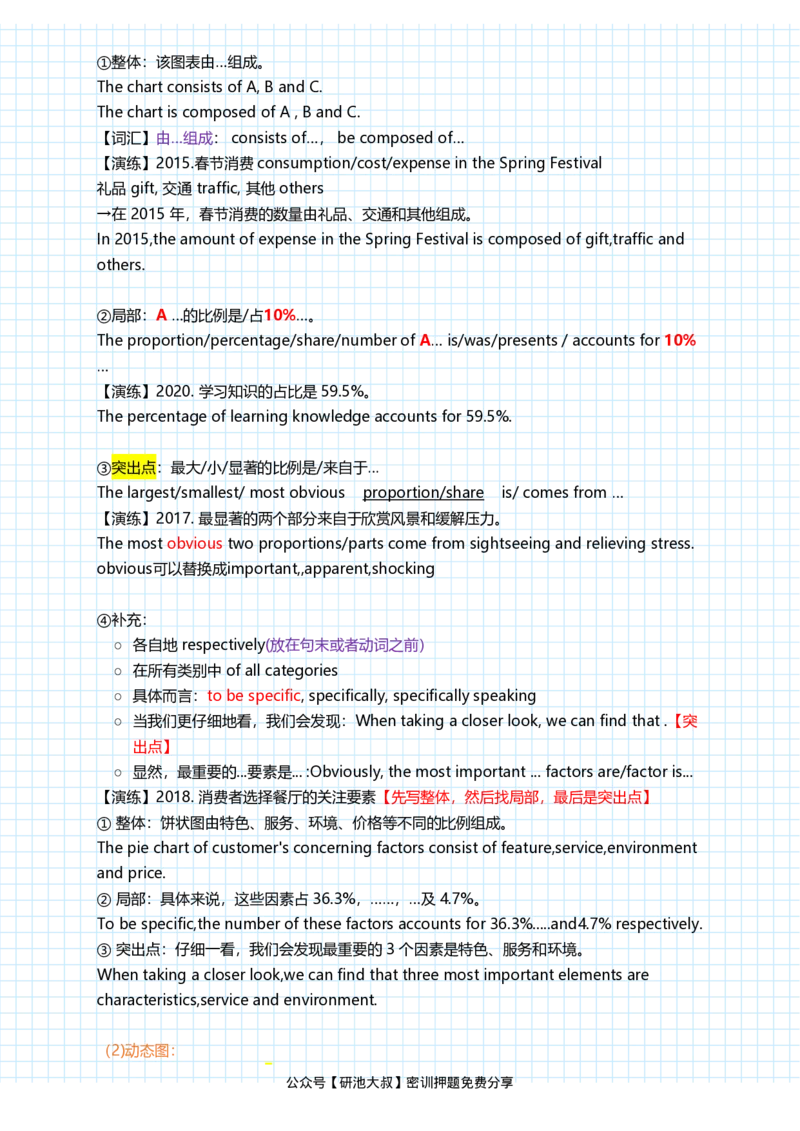
【演练】2018. 消费者选择餐厅的关注要素【先写整体,然后找局部,最后是突出点】
① 整体:饼状图由特色、服务、环境、价格等不同的比例组成。
The pie chart of customer's concerning factors consist of feature,service,environment
and price.
② 局部:具体来说,这些因素占 36.3%,……,…及 4.7%。
To be specific,the number of these factors accounts for 36.3%.....and4.7% respectively.
③ 突出点:仔细一看,我们会发现最重要的 3 个因素是特色、服务和环境。
When taking a closer look,we can find that three most important elements are
characteristics,service and environment.
(2)动态图:
第一种:the numbers of 主题(名词)+变化(动词)+程度(副词)+范围(from..to…)
公众号【研池大叔】密训押题免费分享
分区 新分区2 的第5 页第一种:the numbers of 主题(名词)+变化(动词)+程度(副词)+范围(from..to…)
第二种:the number of 主题+变化+程度+时间范围,ranging from … to …
○ number →figure(s), amount 总量, rate 速率, proportion 比例份额, percentage
百分比
number的几种意思:
a. 可以表示数字,可以加s
b. 数目总数,不能加s
c. 数量,有s
➢ 主题:名词
总主题=分主题叠加
A 总主题= B and C
eg. 2010
总:在发展中国家和发达国家的手机定制
mobile phone subscription in developing countries and developed ones
➢ 变化:谓语 公众号:弦姐考研,免费分享
▪ 上升:increase, rise, grow, ascend,
→过去式:increased,rose,grew,ascended
▪ 下降:decrease, decline, diminish, fall, descend
→过去式:decreased,declined,diminished,fell,descended
➢ 程度 :(由浅到深) slightly, slowly, steadily,significantly, sharply
➢ 范围:from 起点 to 终点
从 1 到 10:from 1 to 10
从 1990 年到 2000 年:from 1990 to 2000
从 1990 年的 1 到 2000 年的 10:from 1in 1990 to 10 in 2000
从 1990 年的 1900 到 2000 年的 1990:from 1990 in the year of 1990 to 1990 in the
year of 2000
• 波状图 :
尽管…(主题词)的数字波动不定,但总趋势上升的/下降的 。
Although the number of … varies, the whole tendency tends to be increasing/
decreasing.
【词汇】
变化波动:vary
总趋势:the whole tendency
上升的: increasing/upward
下降的:decreasing/downward
公众号【研池大叔】密训押题免费分享
分区 新分区2 的第6 页下降的:decreasing/downward
• 没变化:
… 的数据不变。The number of … is flat .
… 的数据维持稳定在… The number of … remains steady at …(数字) 。
【词汇】
不变的,稳定的:flat,steady
维持:remain
【示例】2011. 中国汽车的份额保持在 35%。
The proportion of Chinese autos remains steady at 35%.
• 图表两个变量
变量一公式。关联词, 变量二公式。
• 关联词
1)通用:(连接A与B之间的关系)
meanwhile, 与此同时
And … during the same period/at the same time
2)相同:
近似地是 :Likewise, similarly,
递进:furthermore, moreover, what’s more , even worse, more importantly
3)相反:
However, yet, but,
Ironically, unfortunately, regrettably
in contrast, by contrast, on the contrary ,
补充
➢ 差异对比(增长量或减少的量):了
1)There was an increase/a decline of… (量) in …(主题词)during the period from
…(时间1) to …(时间2)。
从时间1到时间2,主题词增长或下降了…
【演练2010.】
从2000年到2008年,手机使用者的数量增长了10亿
There was an increase of 1 billion in (the number of) mobliephone users during the
period from 2000 to 2008.
2)数据1相较于数据2,有个…(量)的增长或下降。
The number of 主题1 was 数据1 in 时间1 compared to 数据2 in 时间2,
showing an increase / a decline of … (量)。
The number of 主题词 was only 数据1, compared with a record of 数据2, about
…( 量 ) up/down.
【示例1:2011.不同汽车市场份额】
相较于2008年的28%,中国汽车份额在2009年是35%,有了7%的增长
公众号【研池大叔】密训押题免费分享
The proportion of Chinese cars was 35% in 2009 compared to 28% in 2008,showing an
分区 新分区2 的第7 页The proportion of Chinese cars was 35% in 2009 compared to 28% in 2008,showing an
increase of 7%.
【示例2:2011】
美国的汽车份额是28%,相较于20%,有了8%的增长
The proportion of American autos was only 28%,compared with a record of 20%,about
8% up.
三. 图表总结【背一个就行】
1.尽管数字孤立,事实上,紧密联系。
Isolated as the figures seem to be, as a matter of fact, they are connected to one
another closely.
(as引导的让步状语从句)
【词汇】孤立的:isolated
数字 : figures/numbers
事实上:as a matter of fact/ In fact
2.绘图者的真正目的不是数据本身,而是要引导我们去探究其原因。
The draftsman's real purpose is not the statistics, but to lead us to find the reasons.
【词汇】绘图者:draftsman
数据:statistics
引导某人做某事:lead sb. to do sth.
3.事实上,作者真正要告诉我们的不只是数字。
As a matter of fact, what the author tries to show us is more than(不只是)statistics.
【词汇】向某人展示某事: show sb. sth.
数据:statistics
图表作文开头段总结(重点)!!
静态图开头段:
1.引出话题;
2.图表描述:a.整体;b.局部;c.突出点
3.图标总结(可省略)
动态图开头段:(假设两个变量)
1.引出话题;
2.图表描述:a.公式一。;b.关联词,公式二
3.图标总结(可省略)
➢ 线状图:line chart
第一种:单线上升
1.引出主题: 线状图反映了 A主题的信息。
2.图表描述:具体而言 To be (more) specific / Specifically speaking,A 的数据从1990的1
上升到2000年的50.
3.图表总结:事实上,作者真正要告诉我们的不只是数字。
公众号【研池大叔】密训押题免费分享
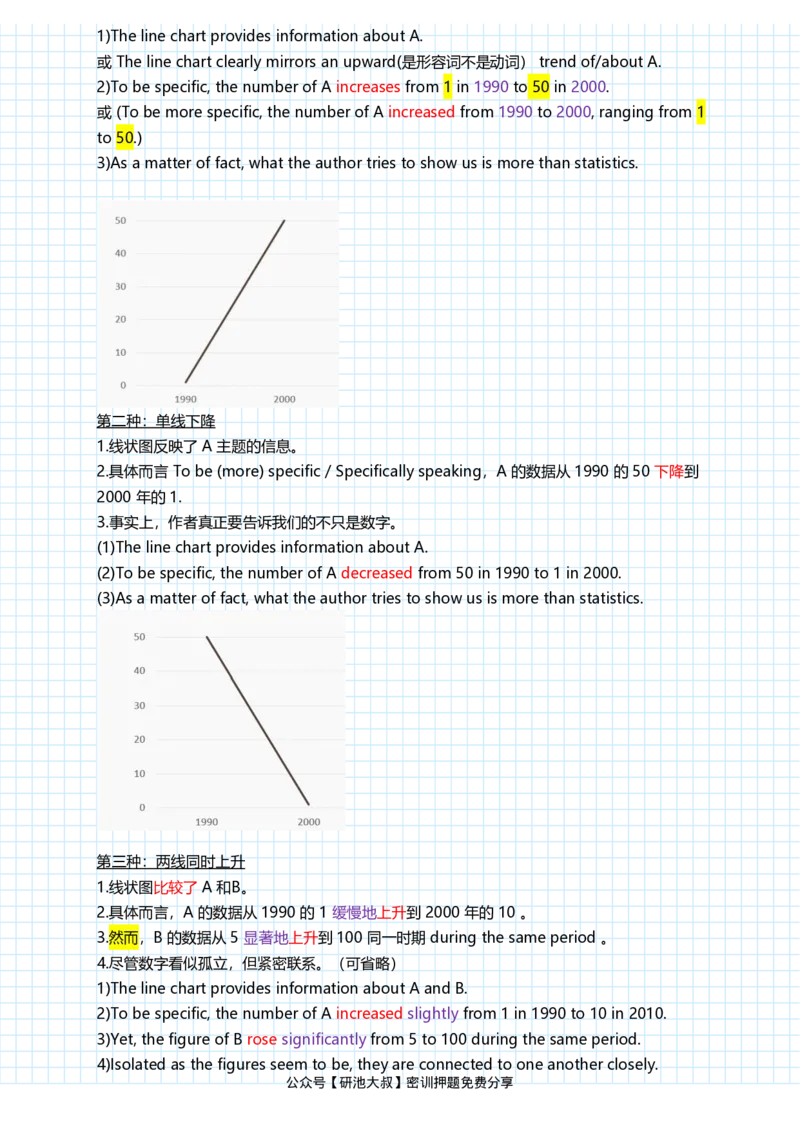
1)The line chart provides information about A.
分区 新分区2 的第8 页1)The line chart provides information about A.
或 The line chart clearly mirrors an upward(是形容词不是动词) trend of/about A.
2)To be specific, the number of A increases from 1 in 1990 to 50 in 2000.
或 (To be more specific, the number of A increased from 1990 to 2000, ranging from 1
to 50.)
3)As a matter of fact, what the author tries to show us is more than statistics.
第二种:单线下降
1.线状图反映了 A 主题的信息。
2.具体而言 To be (more) specific / Specifically speaking,A 的数据从 1990 的 50 下降到
2000 年的 1.
3.事实上,作者真正要告诉我们的不只是数字。
(1)The line chart provides information about A.
(2)To be specific, the number of A decreased from 50 in 1990 to 1 in 2000.
(3)As a matter of fact, what the author tries to show us is more than statistics.
第三种:两线同时上升
1.线状图比较了A 和B。
2.具体而言,A 的数据从 1990 的 1 缓慢地上升到 2000 年的 10 。
3.然而,B 的数据从 5 显著地上升到 100 同一时期 during the same period 。
4.尽管数字看似孤立,但紧密联系。(可省略)
1)The line chart provides information about A and B.
2)To be specific, the number of A increased slightly from 1 in 1990 to 10 in 2010.
3)Yet, the figure of B rose significantly from 5 to 100 during the same period.
4)Isolated as the figures seem to be, they are connected to one another closely.
公众号【研池大叔】密训押题免费分享
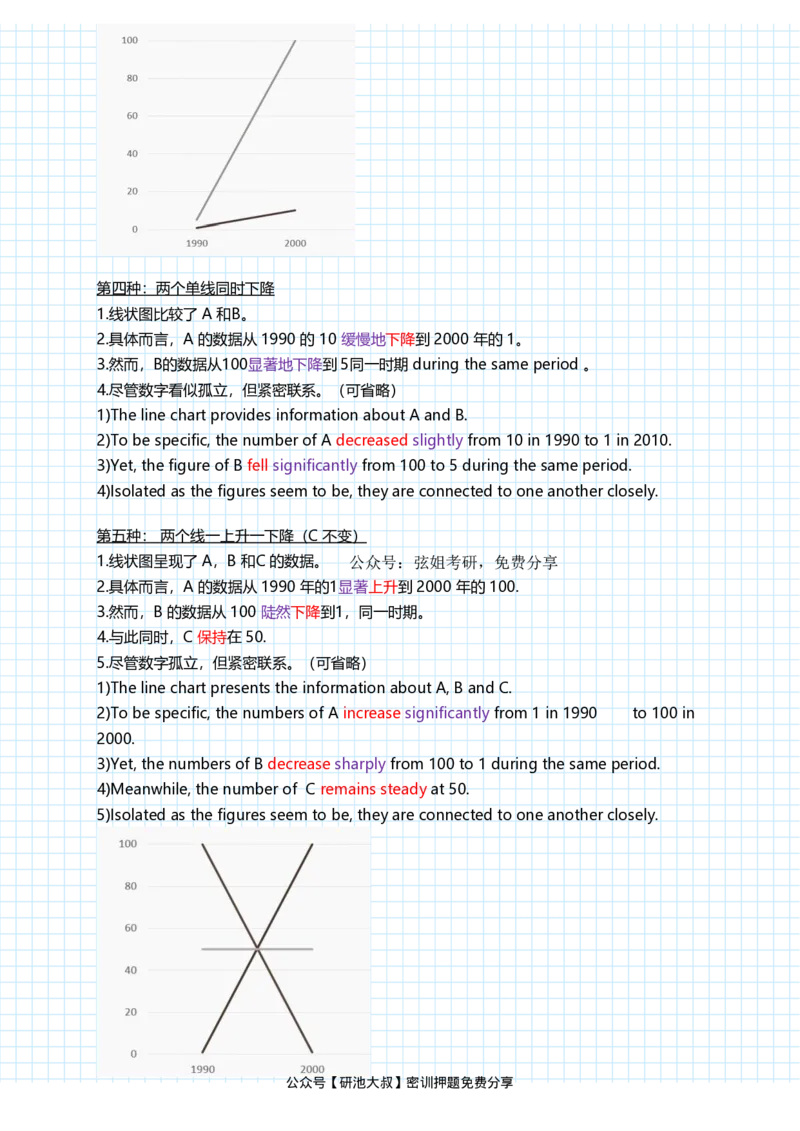
分区 新分区2 的第9 页第四种:两个单线同时下降
1.线状图比较了 A 和B。
2.具体而言,A 的数据从 1990 的 10 缓慢地下降到 2000 年的 1。
3.然而,B的数据从100显著地下降到 5同一时期 during the same period 。
4.尽管数字看似孤立,但紧密联系。(可省略)
1)The line chart provides information about A and B.
2)To be specific, the number of A decreased slightly from 10 in 1990 to 1 in 2010.
3)Yet, the figure of B fell significantly from 100 to 5 during the same period.
4)Isolated as the figures seem to be, they are connected to one another closely.
第五种: 两个线一上升一下降(C 不变)
1.线状图呈现了 A,B 和C 的数据。 公众号:弦姐考研,免费分享
2.具体而言,A 的数据从 1990 年的1显著上升到 2000 年的 100.
3.然而,B 的数据从 100 陡然下降到1,同一时期。
4.与此同时,C 保持在 50.
5.尽管数字孤立,但紧密联系。(可省略)
1)The line chart presents the information about A, B and C.
2)To be specific, the numbers of A increase significantly from 1 in 1990 to 100 in
2000.
3)Yet, the numbers of B decrease sharply from 100 to 1 during the same period.
4)Meanwhile, the number of C remains steady at 50.
5)Isolated as the figures seem to be, they are connected to one another closely.
公众号【研池大叔】密训押题免费分享
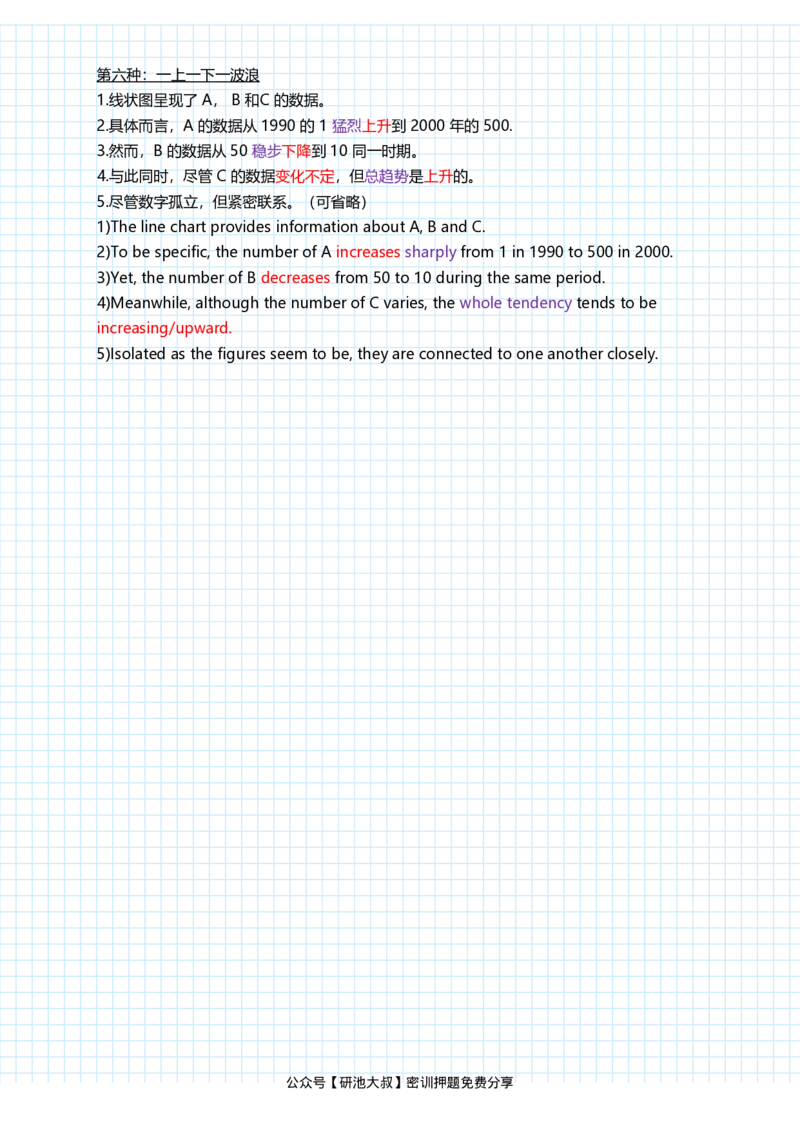
分区 新分区2 的第10 页第六种:一上一下一波浪
1.线状图呈现了 A, B 和C 的数据。
2.具体而言,A 的数据从 1990 的 1 猛烈上升到 2000 年的 500.
3.然而,B 的数据从 50 稳步下降到 10 同一时期。
4.与此同时,尽管 C 的数据变化不定,但总趋势是上升的。
5.尽管数字孤立,但紧密联系。(可省略)
1)The line chart provides information about A, B and C.
2)To be specific, the number of A increases sharply from 1 in 1990 to 500 in 2000.
3)Yet, the number of B decreases from 50 to 10 during the same period.
4)Meanwhile, although the number of C varies, the whole tendency tends to be
increasing/upward.
5)Isolated as the figures seem to be, they are connected to one another closely.
公众号【研池大叔】密训押题免费分享
分区 新分区2 的第11 页

