
文档内容
Numerical comprehension
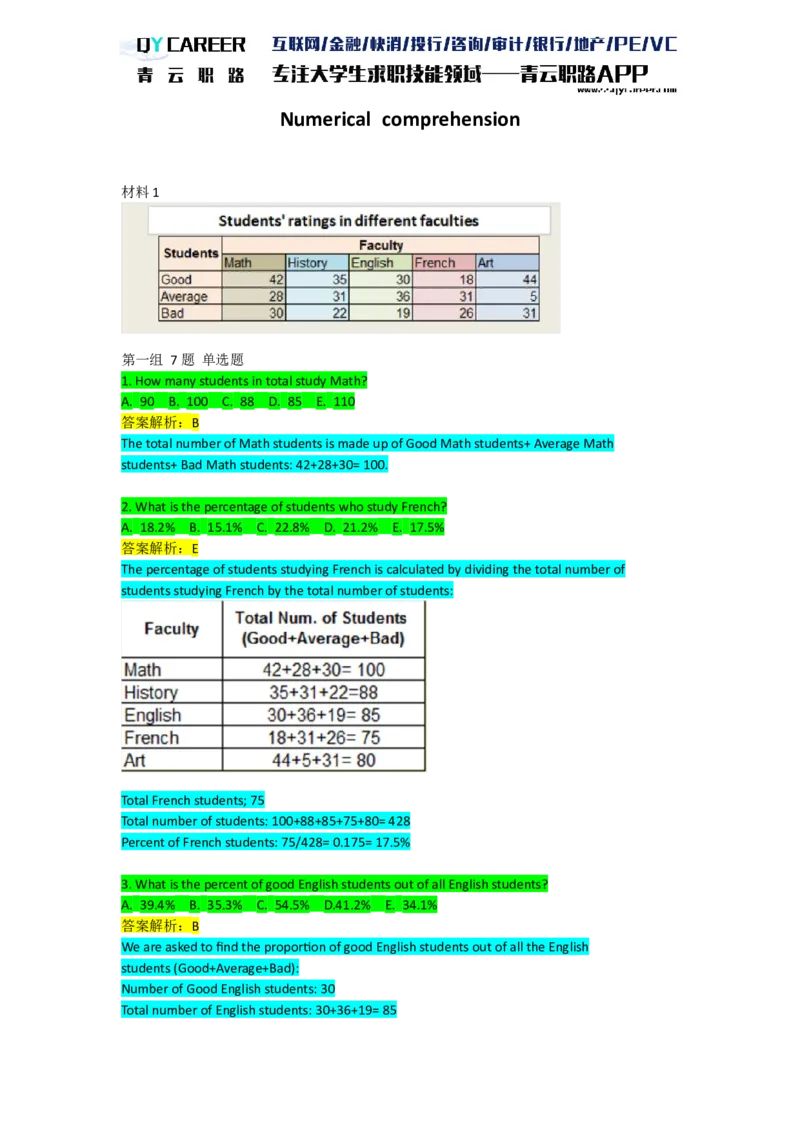
材料1
第一组 7题 单选题
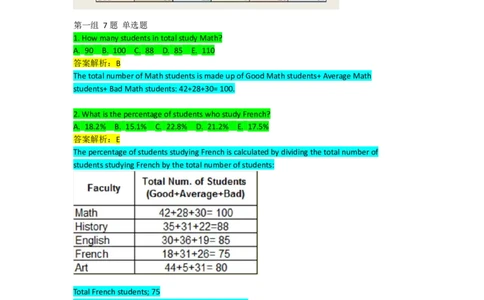
1. How many students in total study Math?
A. 90 B. 100 C. 88 D. 85 E. 110
答案解析:B
The total number of Math students is made up of Good Math students+ Average Math
students+ Bad Math students: 42+28+30= 100.
2. What is the percentage of students who study French?
A. 18.2% B. 15.1% C. 22.8% D. 21.2% E. 17.5%
答案解析:E
The percentage of students studying French is calculated by dividing the total number of
students studying French by the total number of students:
Total French students; 75
Total number of students: 100+88+85+75+80= 428
Percent of French students: 75/428= 0.175= 17.5%
3. What is the percent of good English students out of all English students?
A. 39.4% B. 35.3% C. 54.5% D.41.2% E. 34.1%
答案解析:B
We are asked to find the proportion of good English students out of all the English
students (Good+Average+Bad):
Number of Good English students: 30
Total number of English students: 30+36+19= 85Percent of Good English students (out of all English students): 30/85= 35.3%
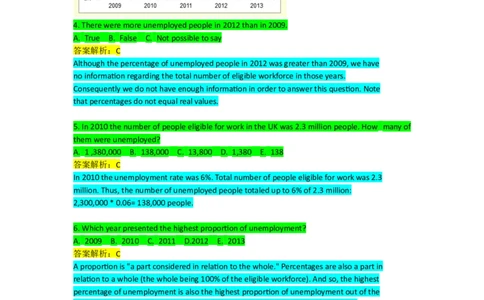
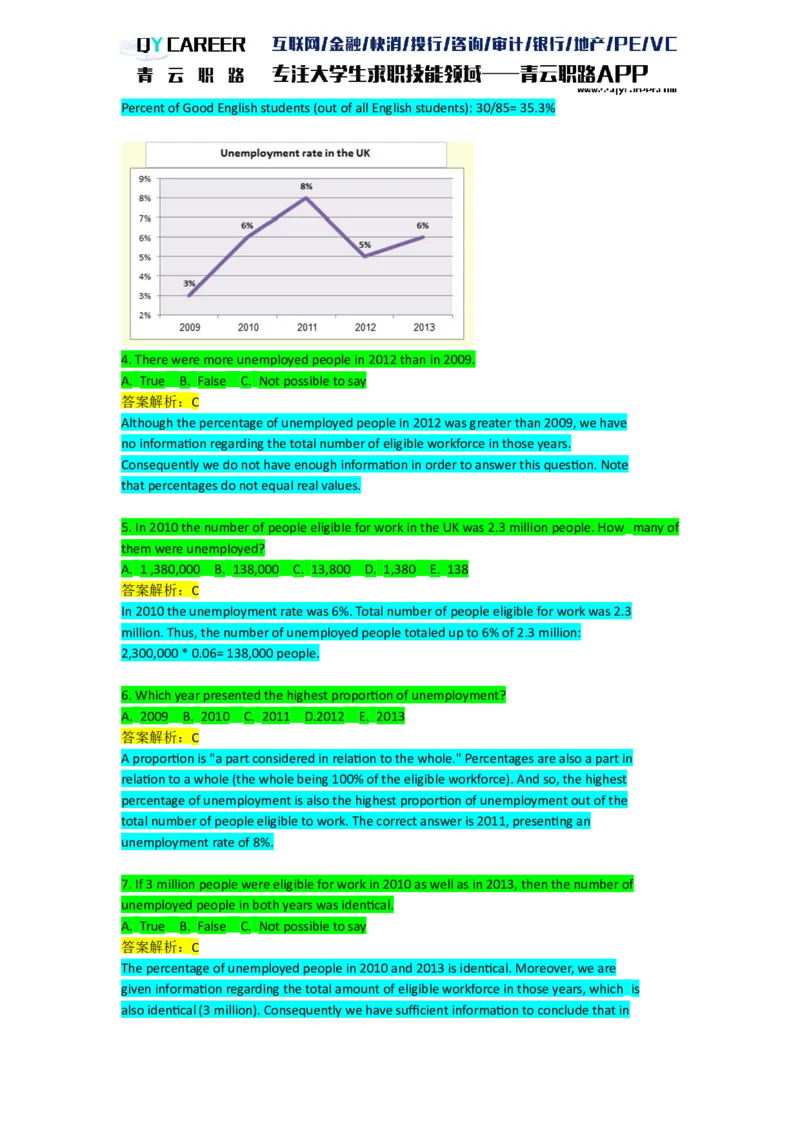
4. There were more unemployed people in 2012 than in 2009.
A. True B. False C. Not possible to say
答案解析:C
Although the percentage of unemployed people in 2012 was greater than 2009, we have
no information regarding the total number of eligible workforce in those years.
Consequently we do not have enough information in order to answer this question. Note
that percentages do not equal real values.
5. In 2010 the number of people eligible for work in the UK was 2.3 million people. How many of
them were unemployed?
A. 1 ,380,000 B. 138,000 C. 13,800 D. 1,380 E. 138
答案解析:C
In 2010 the unemployment rate was 6%. Total number of people eligible for work was 2.3
million. Thus, the number of unemployed people totaled up to 6% of 2.3 million:
2,300,000 * 0.06= 138,000 people.
6. Which year presented the highest proportion of unemployment?
A. 2009 B. 2010 C. 2011 D.2012 E. 2013
答案解析:C
A proportion is "a part considered in relation to the whole." Percentages are also a part in
relation to a whole (the whole being 100% of the eligible workforce). And so, the highest
percentage of unemployment is also the highest proportion of unemployment out of the
total number of people eligible to work. The correct answer is 2011, presenting an
unemployment rate of 8%.
7. If 3 million people were eligible for work in 2010 as well as in 2013, then the number of
unemployed people in both years was identical.
A. True B. False C. Not possible to say
答案解析:C
The percentage of unemployed people in 2010 and 2013 is identical. Moreover, we are
given information regarding the total amount of eligible workforce in those years, which is
also identical (3 million). Consequently we have sufficient information to conclude that inboth years the number of people unemployed was: 3,0000 * 0.06= 180,000
people.
Note that percentages do not equal real values. Thus, without information regarding the
total number of people eligible for work in both years, we would not have been able to
answer this question.
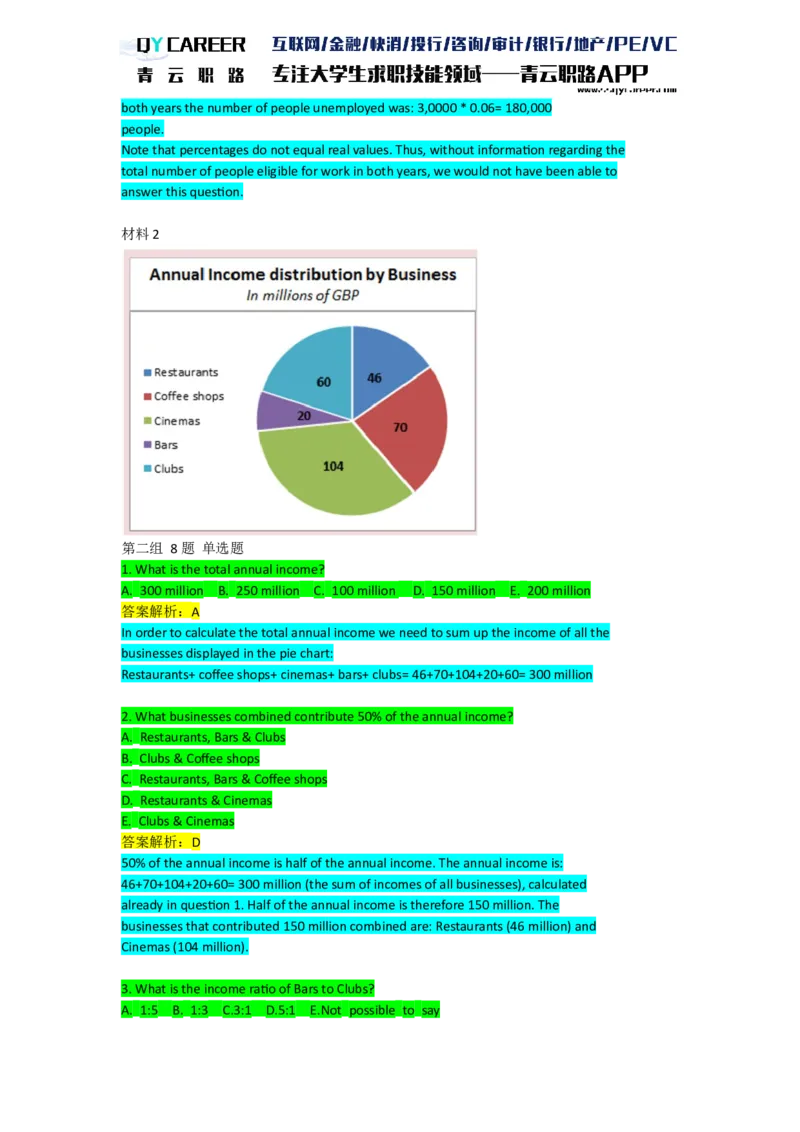
材料2
第二组 8题 单选题
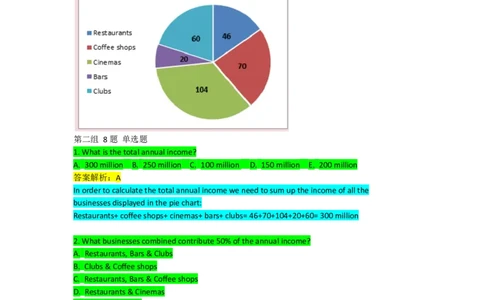
1. What is the total annual income?
A. 300 million B. 250 million C. 100 million D. 150 million E. 200 million
答案解析:A
In order to calculate the total annual income we need to sum up the income of all the
businesses displayed in the pie chart:
Restaurants+ coffee shops+ cinemas+ bars+ clubs= 46+70+104+20+60= 300 million
2. What businesses combined contribute 50% of the annual income?
A. Restaurants, Bars & Clubs
B. Clubs & Coffee shops
C. Restaurants, Bars & Coffee shops
D. Restaurants & Cinemas
E. Clubs & Cinemas
答案解析:D
50% of the annual income is half of the annual income. The annual income is:
46+70+104+20+60= 300 million (the sum of incomes of all businesses), calculated
already in question 1. Half of the annual income is therefore 150 million. The
businesses that contributed 150 million combined are: Restaurants (46 million) and
Cinemas (104 million).
3. What is the income ratio of Bars to Clubs?
A. 1:5 B. 1:3 C.3:1 D.5:1 E.Not possible to say答案解析:B
Bars' annual income is £20 million whilst Clubs' annual income is £60 million. Therefore,
the income ratio of bars to restaurants is: 20:60, divided by a common denominator (20)
we arrive at 1:3.
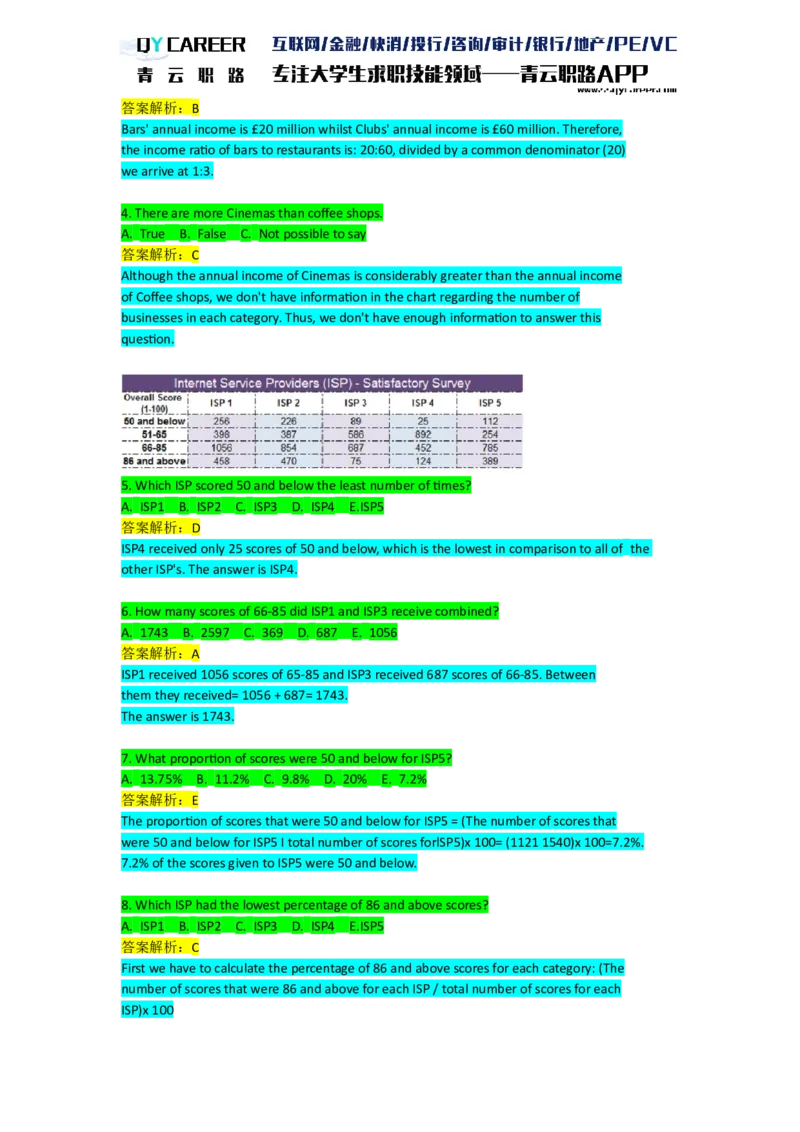
4. There are more Cinemas than coffee shops.
A. True B. False C. Not possible to say
答案解析:C
Although the annual income of Cinemas is considerably greater than the annual income
of Coffee shops, we don't have information in the chart regarding the number of
businesses in each category. Thus, we don't have enough information to answer this
question.
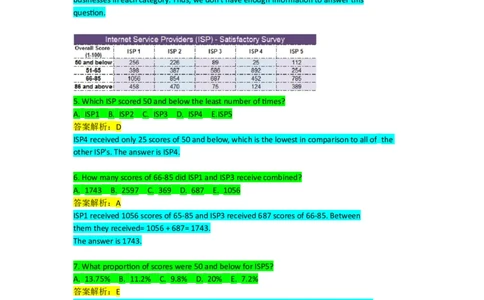
5. Which ISP scored 50 and below the least number of times?
A. ISP1 B. ISP2 C. ISP3 D. ISP4 E.ISP5
答案解析:D
ISP4 received only 25 scores of 50 and below, which is the lowest in comparison to all of the
other ISP's. The answer is ISP4.
6. How many scores of 66-85 did ISP1 and ISP3 receive combined?
A. 1743 B. 2597 C. 369 D. 687 E. 1056
答案解析:A
ISP1 received 1056 scores of 65-85 and ISP3 received 687 scores of 66-85. Between
them they received= 1056 + 687= 1743.
The answer is 1743.
7. What proportion of scores were 50 and below for ISP5?
A. 13.75% B. 11.2% C. 9.8% D. 20% E. 7.2%
答案解析:E
The proportion of scores that were 50 and below for ISP5 = (The number of scores that
were 50 and below for ISP5 I total number of scores forlSP5)x 100= (1121 1540)x 100=7.2%.
7.2% of the scores given to ISP5 were 50 and below.
8. Which ISP had the lowest percentage of 86 and above scores?
A. ISP1 B. ISP2 C. ISP3 D. ISP4 E.ISP5
答案解析:C
First we have to calculate the percentage of 86 and above scores for each category: (The
number of scores that were 86 and above for each ISP / total number of scores for each
ISP)x 100ISP1: (4581 2168) X 100= 21.1%
ISP2: (4701 1937) X 100= 24.3% ,
ISP3: (751 1437) x 100= 5.2%
ISP4: (1241 1493)x 100= 8.3%
ISP5: (389/ 1540) X 100= 25.3%
ISP3 had the lowest percentage of 86 and above scores with 5.2%.
The answer is ISP3.
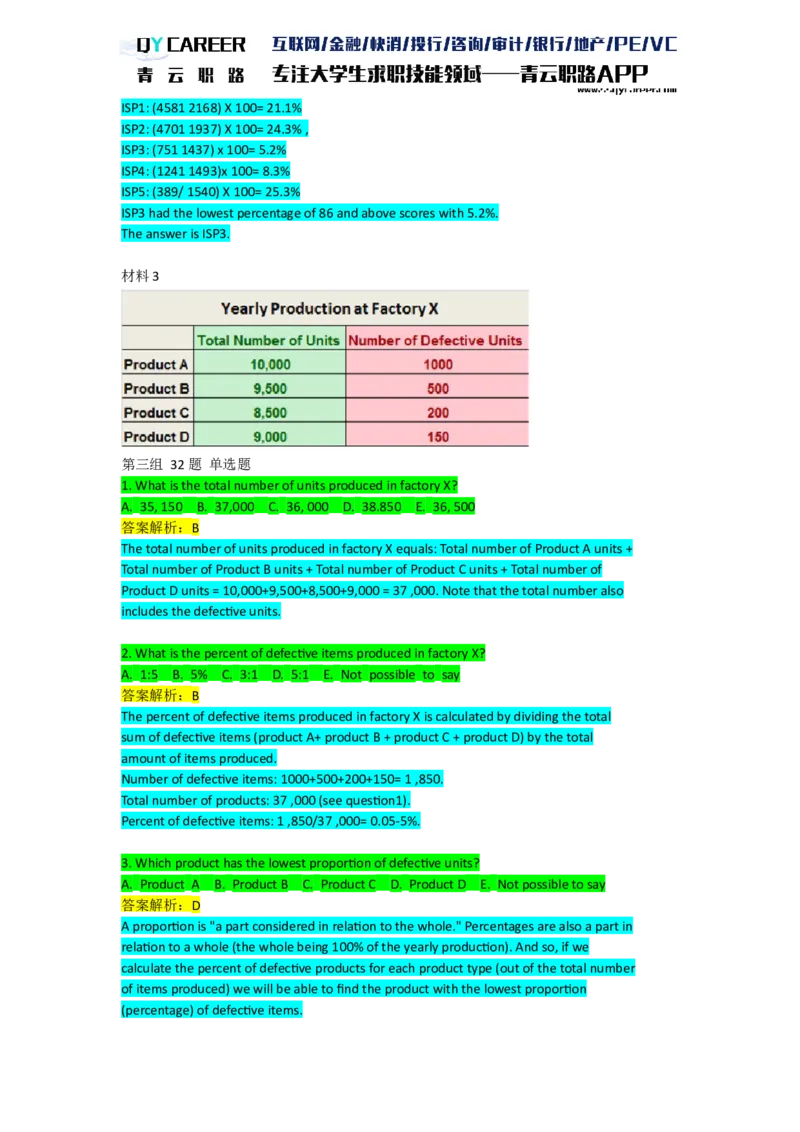
材料3
第三组 32题 单选题
1. What is the total number of units produced in factory X?
A. 35, 150 B. 37,000 C. 36, 000 D. 38.850 E. 36, 500
答案解析:B
The total number of units produced in factory X equals: Total number of Product A units +
Total number of Product B units + Total number of Product C units + Total number of
Product D units = 10,000+9,500+8,500+9,000 = 37 ,000. Note that the total number also
includes the defective units.
2. What is the percent of defective items produced in factory X?
A. 1:5 B. 5% C. 3:1 D. 5:1 E. Not possible to say
答案解析:B
The percent of defective items produced in factory X is calculated by dividing the total
sum of defective items (product A+ product B + product C + product D) by the total
amount of items produced.
Number of defective items: 1000+500+200+150= 1 ,850.
Total number of products: 37 ,000 (see question1).
Percent of defective items: 1 ,850/37 ,000= 0.05-5%.
3. Which product has the lowest proportion of defective units?
A. Product A B. Product B C. Product C D. Product D E. Not possible to say
答案解析:D
A proportion is "a part considered in relation to the whole." Percentages are also a part in
relation to a whole (the whole being 100% of the yearly production). And so, if we
calculate the percent of defective products for each product type (out of the total number
of items produced) we will be able to find the product with the lowest proportion
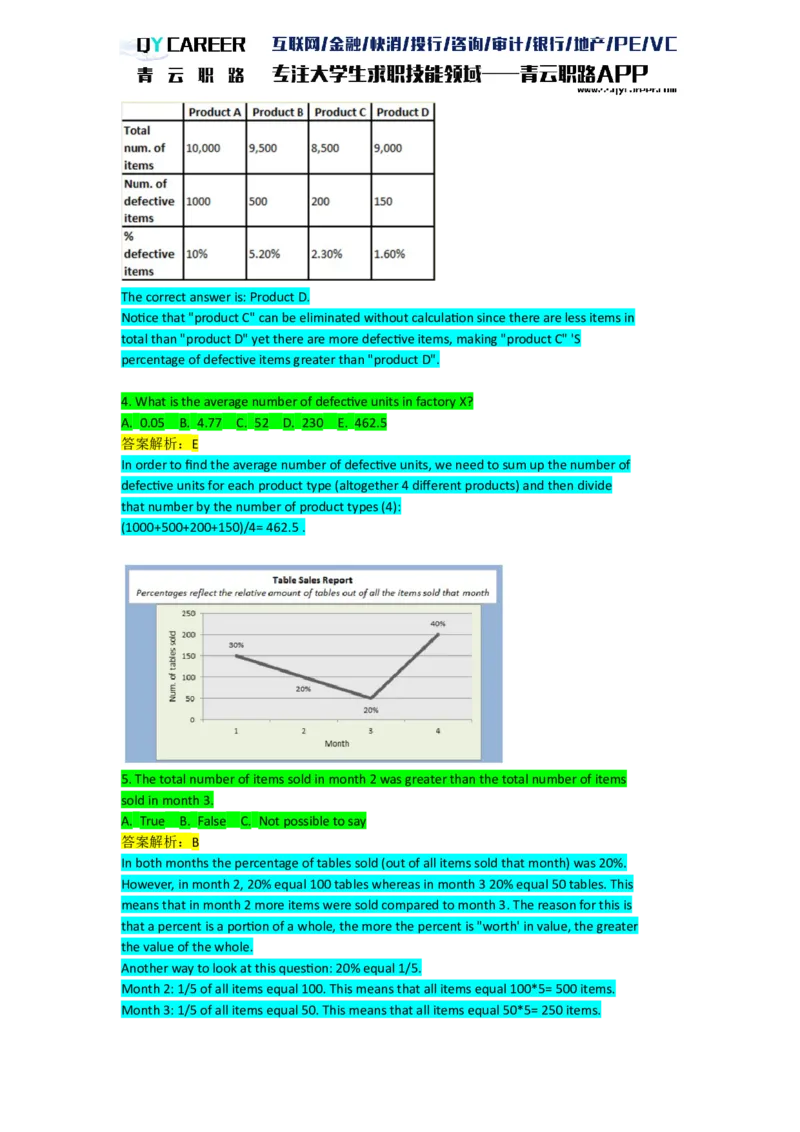
(percentage) of defective items.The correct answer is: Product D.
Notice that "product C" can be eliminated without calculation since there are less items in
total than "product D" yet there are more defective items, making "product C" 'S
percentage of defective items greater than "product D".
4. What is the average number of defective units in factory X?
A. 0.05 B. 4.77 C. 52 D. 230 E. 462.5
答案解析:E
In order to find the average number of defective units, we need to sum up the number of
defective units for each product type (altogether 4 different products) and then divide
that number by the number of product types (4):
(1000+500+200+150)/4= 462.5 .
5. The total number of items sold in month 2 was greater than the total number of items
sold in month 3.
A. True B. False C. Not possible to say
答案解析:B
In both months the percentage of tables sold (out of all items sold that month) was 20%.
However, in month 2, 20% equal 100 tables whereas in month 3 20% equal 50 tables. This
means that in month 2 more items were sold compared to month 3. The reason for this is
that a percent is a portion of a whole, the more the percent is "worth' in value, the greater
the value of the whole.
Another way to look at this question: 20% equal 1/5.
Month 2: 1/5 of all items equal 100. This means that all items equal 100*5= 500 items.
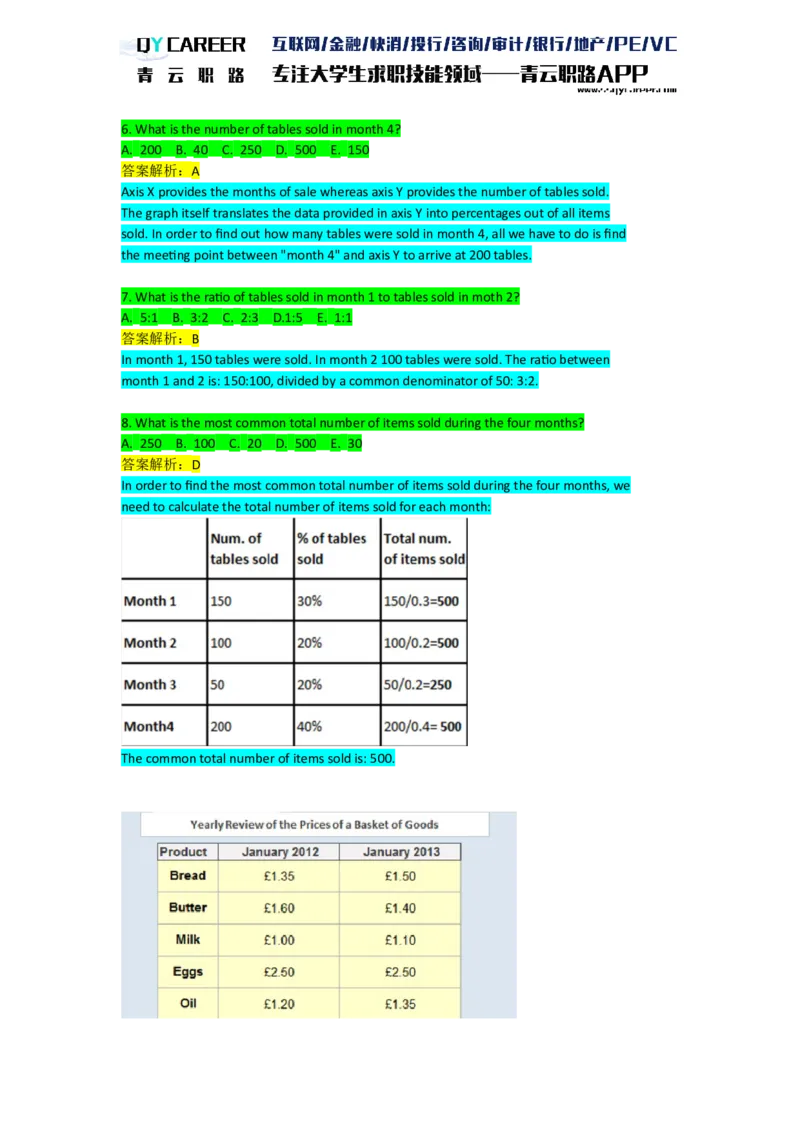
Month 3: 1/5 of all items equal 50. This means that all items equal 50*5= 250 items.6. What is the number of tables sold in month 4?
A. 200 B. 40 C. 250 D. 500 E. 150
答案解析:A
Axis X provides the months of sale whereas axis Y provides the number of tables sold.
The graph itself translates the data provided in axis Y into percentages out of all items
sold. In order to find out how many tables were sold in month 4, all we have to do is find
the meeting point between "month 4" and axis Y to arrive at 200 tables.
7. What is the ratio of tables sold in month 1 to tables sold in moth 2?
A. 5:1 B. 3:2 C. 2:3 D.1:5 E. 1:1
答案解析:B
In month 1, 150 tables were sold. In month 2 100 tables were sold. The ratio between
month 1 and 2 is: 150:100, divided by a common denominator of 50: 3:2.
8. What is the most common total number of items sold during the four months?
A. 250 B. 100 C. 20 D. 500 E. 30
答案解析:D
In order to find the most common total number of items sold during the four months, we
need to calculate the total number of items sold for each month:
The common total number of items sold is: 500.9. How much would a basket of goods cost in 2013?
A. 7.65 B. 7.85 C. 15.3 D. 15.5 E. 7.75
答案解析:B
In order to answer this question we are required to sum up the prices of all products in
2013: 1.50+1.40+1.10+2.50+1.35= 7.85
10. What is the percentage increase of the price of milk between 2012 and 2013?
A. 10% B. 9% C. 100% D. 90% E. 1%
答案解析:A
The milk price in 2012 Was: 1.00. The milk price in 2013 was: 1.10. The difference
between prices is: 0.10. The percent of change from 2012 to 2013 (compared to the
year 2012) is: 0.10/1.00=10%
11. What is the difference between the price of a basket of goods in 2012 and 2013?
A. 0.20 B. 0.30 C. 0.40 D. 0.25 E. 0.35
答案解析:A
The price of a basket of goods in 2012: 1.35+1.60+1.00+2.50+1.20=7.65.
The price of a basket of goods in 2013: 1.50+1.40+1.10+2.50+1.35= 7.85
The difference between the price of a basket of goods in 2012 and 2013 is: 7.65-7.85=-0.20.
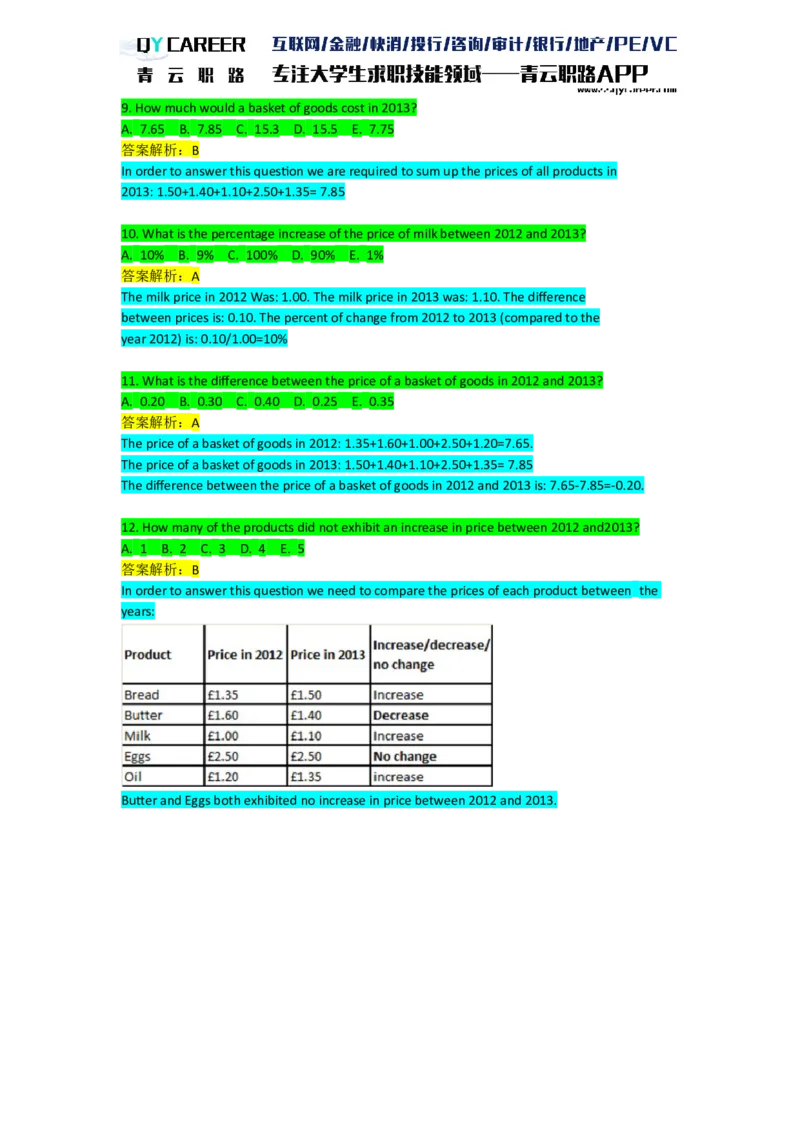
12. How many of the products did not exhibit an increase in price between 2012 and2013?
A. 1 B. 2 C. 3 D. 4 E. 5
答案解析:B
In order to answer this question we need to compare the prices of each product between the
years:
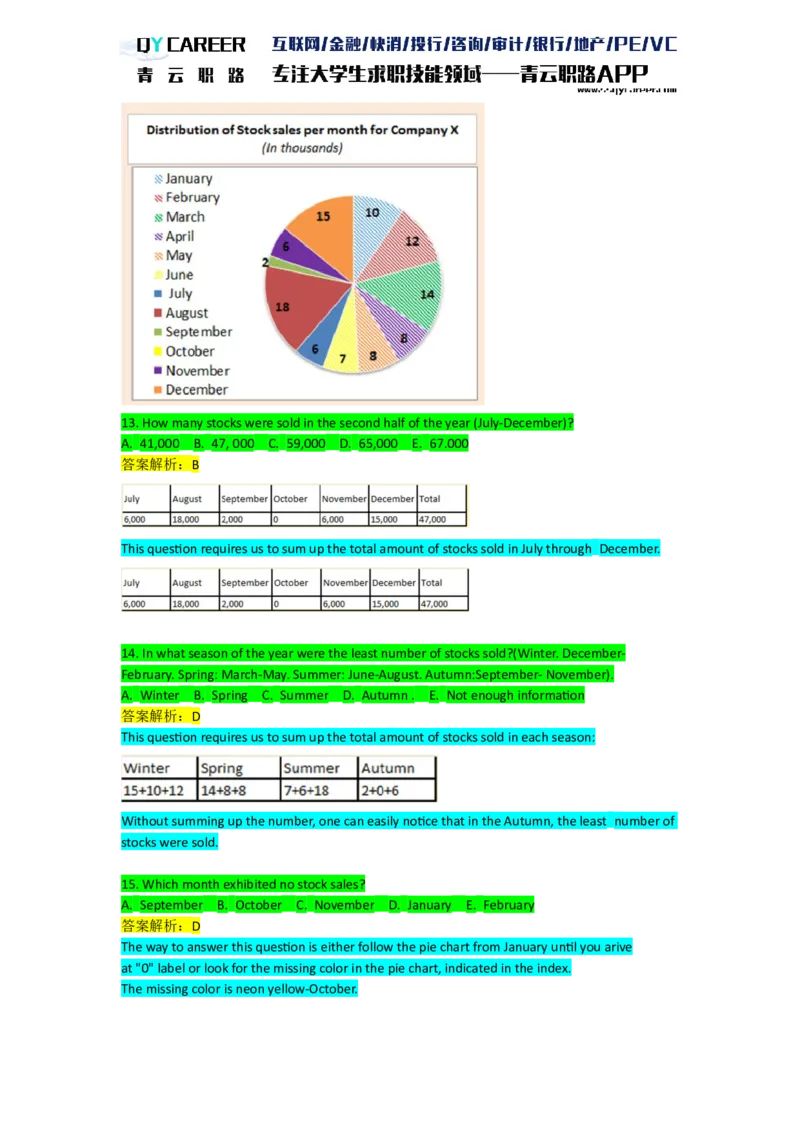
Butter and Eggs both exhibited no increase in price between 2012 and 2013.13. How many stocks were sold in the second half of the year (July-December)?
A. 41,000 B. 47, 000 C. 59,000 D. 65,000 E. 67.000
答案解析:B
This question requires us to sum up the total amount of stocks sold in July through December.
14. In what season of the year were the least number of stocks sold?(Winter. December-
February. Spring: March-May. Summer: June-August. Autumn:September- November).
A. Winter B. Spring C. Summer D. Autumn . E. Not enough information
答案解析:D
This question requires us to sum up the total amount of stocks sold in each season:
Without summing up the number, one can easily notice that in the Autumn, the least number of
stocks were sold.
15. Which month exhibited no stock sales?
A. September B. October C. November D. January E. February
答案解析:D
The way to answer this question is either follow the pie chart from January until you arive
at "0" label or look for the missing color in the pie chart, indicated in the index.
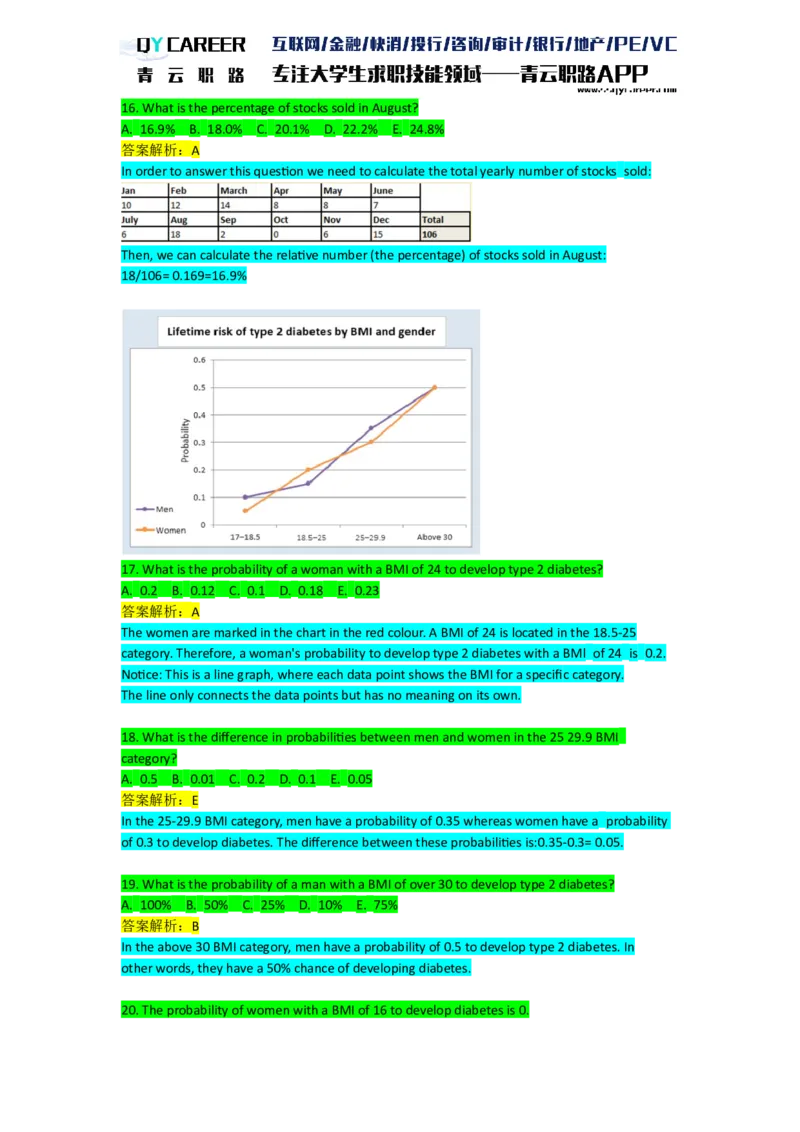
The missing color is neon yellow-October.16. What is the percentage of stocks sold in August?
A. 16.9% B. 18.0% C. 20.1% D. 22.2% E. 24.8%
答案解析:A
In order to answer this question we need to calculate the total yearly number of stocks sold:
Then, we can calculate the relative number (the percentage) of stocks sold in August:
18/106= 0.169=16.9%
17. What is the probability of a woman with a BMI of 24 to develop type 2 diabetes?
A. 0.2 B. 0.12 C. 0.1 D. 0.18 E. 0.23
答案解析:A
The women are marked in the chart in the red colour. A BMI of 24 is located in the 18.5-25
category. Therefore, a woman's probability to develop type 2 diabetes with a BMl of 24 is 0.2.
Notice: This is a line graph, where each data point shows the BMI for a specific category.
The line only connects the data points but has no meaning on its own.
18. What is the difference in probabilities between men and women in the 25 29.9 BMI
category?
A. 0.5 B. 0.01 C. 0.2 D. 0.1 E. 0.05
答案解析:E
In the 25-29.9 BMI category, men have a probability of 0.35 whereas women have a probability
of 0.3 to develop diabetes. The difference between these probabilities is:0.35-0.3= 0.05.
19. What is the probability of a man with a BMI of over 30 to develop type 2 diabetes?
A. 100% B. 50% C. 25% D. 10% E. 75%
答案解析:B
In the above 30 BMI category, men have a probability of 0.5 to develop type 2 diabetes. In
other words, they have a 50% chance of developing diabetes.
20. The probability of women with a BMI of 16 to develop diabetes is 0.A. True B. False C. Not possible to say
答案解析:C
The lowest category available in the chart is: 17-18.5 BMI. The probability of women in
that category to develop diabetes is: 0.05. Although it is possible that women with a lower
BMI will have a lower probability to develop the disease, we don't have enough
information to make this deduction since we are not presented with information as to the
distribution of probabilties within a given BMI category.
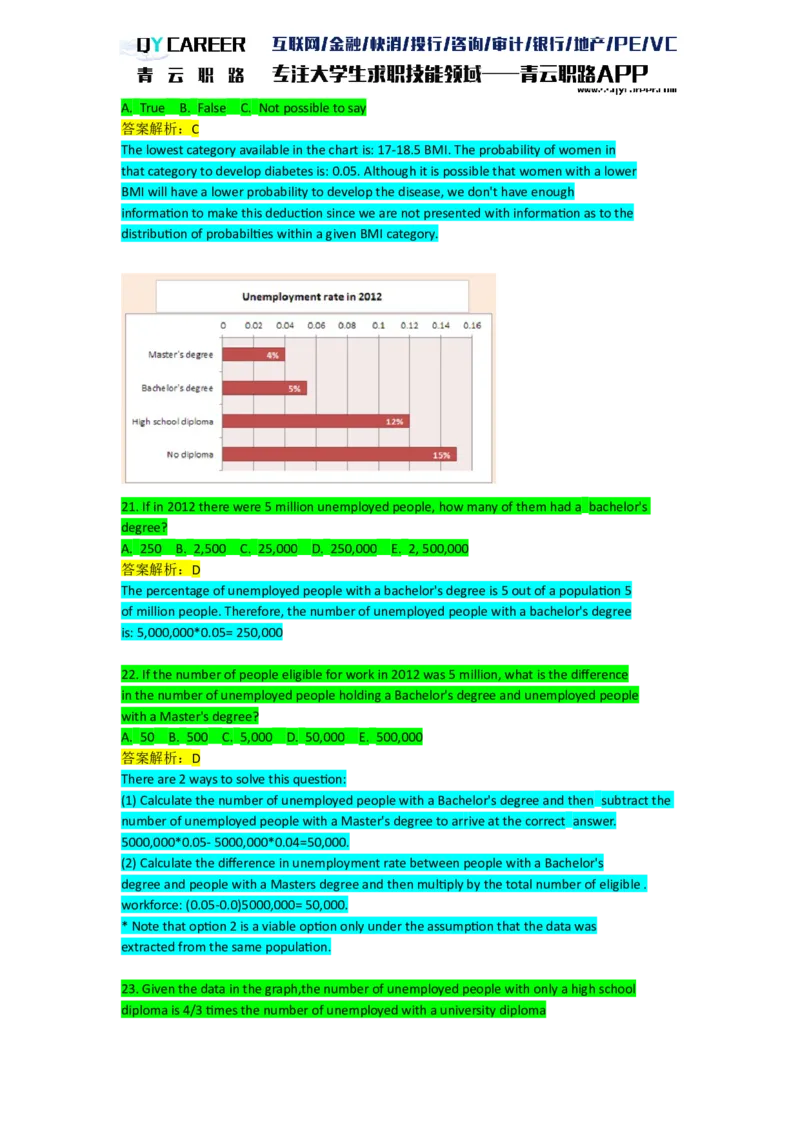
21. If in 2012 there were 5 million unemployed people, how many of them had a bachelor's
degree?
A. 250 B. 2,500 C. 25,000 D. 250,000 E. 2, 500,000
答案解析:D
The percentage of unemployed people with a bachelor's degree is 5 out of a population 5
of million people. Therefore, the number of unemployed people with a bachelor's degree
is: 5,000,000*0.05= 250,000
22. If the number of people eligible for work in 2012 was 5 million, what is the difference
in the number of unemployed people holding a Bachelor's degree and unemployed people
with a Master's degree?
A. 50 B. 500 C. 5,000 D. 50,000 E. 500,000
答案解析:D
There are 2 ways to solve this question:
(1) Calculate the number of unemployed people with a Bachelor's degree and then subtract the
number of unemployed people with a Master's degree to arrive at the correct answer.
5000,000*0.05- 5000,000*0.04=50,000.
(2) Calculate the difference in unemployment rate between people with a Bachelor's
degree and people with a Masters degree and then multiply by the total number of eligible .
workforce: (0.05-0.0)5000,000= 50,000.
* Note that option 2 is a viable option only under the assumption that the data was
extracted from the same population.
23. Given the data in the graph,the number of unemployed people with only a high school
diploma is 4/3 times the number of unemployed with a university diplomaA. True B. False C. Not possible to say
答案解析:A
Although we do not know the exact size of the population of people who are eligible for
work, we do know that the data given in the chart was extracted from the same
population. Namely, all percentage data relates to the same whole and thus the
percentages themselves can express the ratio between different categories without
having to "translate" them into actual values.
12% (unemployed people with only a high school diploma) are 4/3 times as much as 4% +
5% = 9% (unemployed with a university diploma- bachelor's + masters degree). It doesn't
really matter what the exact numbers are since it will always be true that the number of
unemployed people with only a high school diploma will be 4/3 times the number of
unemployed with a university diploma (because both categories relate to the same "whole").
24. How many people are unemployed, if the total number of people eligible for work is 30
million?
A. 0.36 million B. 1.02 million C. 1.08 million D. 10.2 million E. 10.8 million
答案解析:E
There are 2 ways to solve this question:
(1) Calculate the number of unemployed people for each of the four categories and then
sum up all four categories to arrive at the total number of unemployed people:
University graduates: 3000,000*0.04=1 ,200,000
College graduates: 3000,000*0.05-1,500,000
High school diploma: 300000 0.12-3,600,000
No diploma: 300000*0.15= 4.500,000
Total number of unemployed: 1 200,000+1 5000300004.50000,00.000.
(2) Calculate the total percentage of unemployment out of 300000
The total percentage of unemployed is: 15%+12%+5%+4%= 36%. 36% out of 30,000,000 is:
30,00.000*0.36= 10,800,000 unemployed people.
Note that option 2 is a viable option only under the assumption that the data was
extracted from the same population.
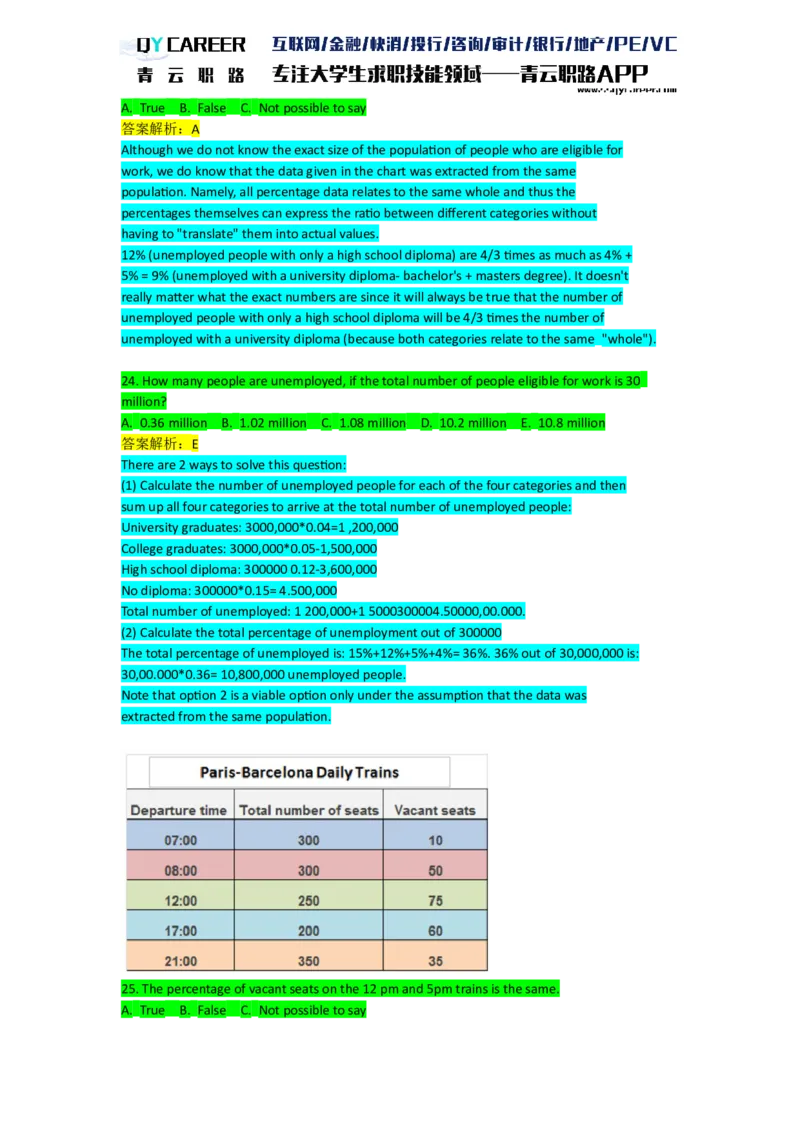
25. The percentage of vacant seats on the 12 pm and 5pm trains is the same.
A. True B. False C. Not possible to say答案解析:A
Although the 12pm train has more vacant seats than the 5 pm train, when dealing with
percentages one must remember that the relevant value(vacant seats) is always
assessed in regards to the total value (total number of seats). Hence the greater number
of vacant seats in the 12 pm train has no meaning without examining the total number of
seats on that train: 12 pm train: 75/250= 0.3= 30% 5 pm train: 60/200= 0.3= 30%
The percentage of vacant seats on the 12 pm and 5pm trains is the same.
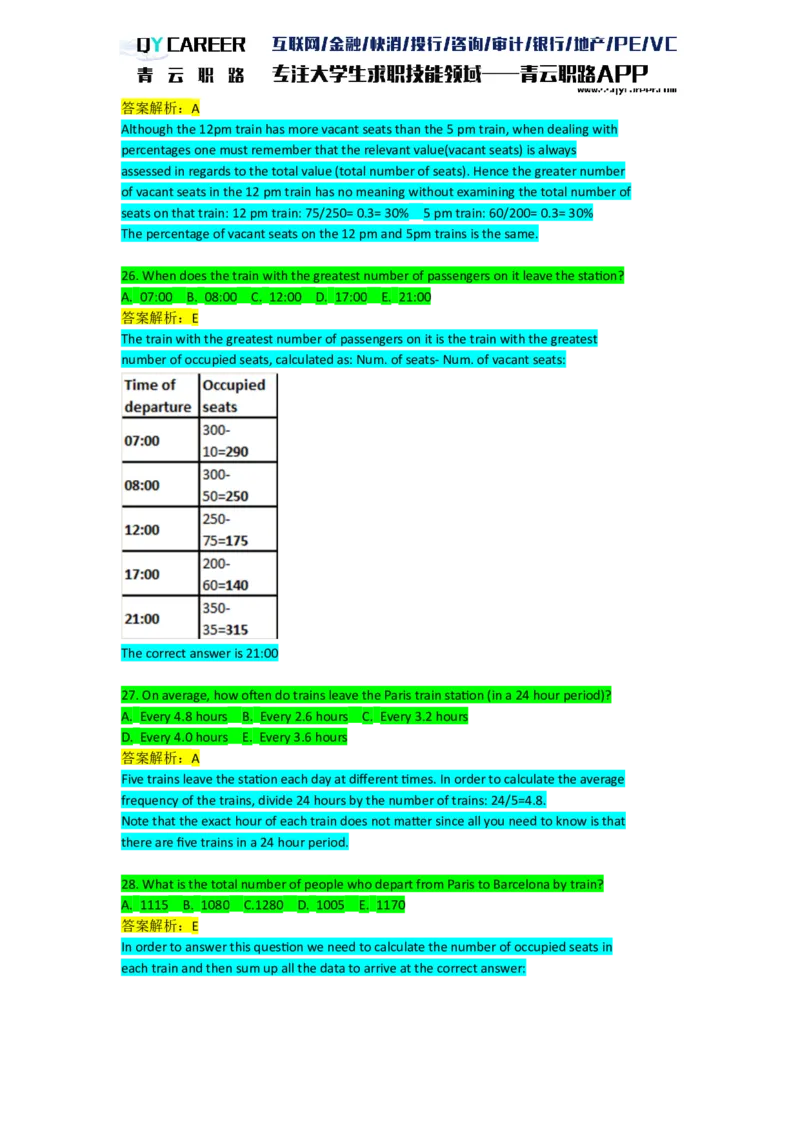
26. When does the train with the greatest number of passengers on it leave the station?
A. 07:00 B. 08:00 C. 12:00 D. 17:00 E. 21:00
答案解析:E
The train with the greatest number of passengers on it is the train with the greatest
number of occupied seats, calculated as: Num. of seats- Num. of vacant seats:
The correct answer is 21:00
27. On average, how often do trains leave the Paris train station (in a 24 hour period)?
A. Every 4.8 hours B. Every 2.6 hours C. Every 3.2 hours
D. Every 4.0 hours E. Every 3.6 hours
答案解析:A
Five trains leave the station each day at different times. In order to calculate the average
frequency of the trains, divide 24 hours by the number of trains: 24/5=4.8.
Note that the exact hour of each train does not matter since all you need to know is that
there are five trains in a 24 hour period.
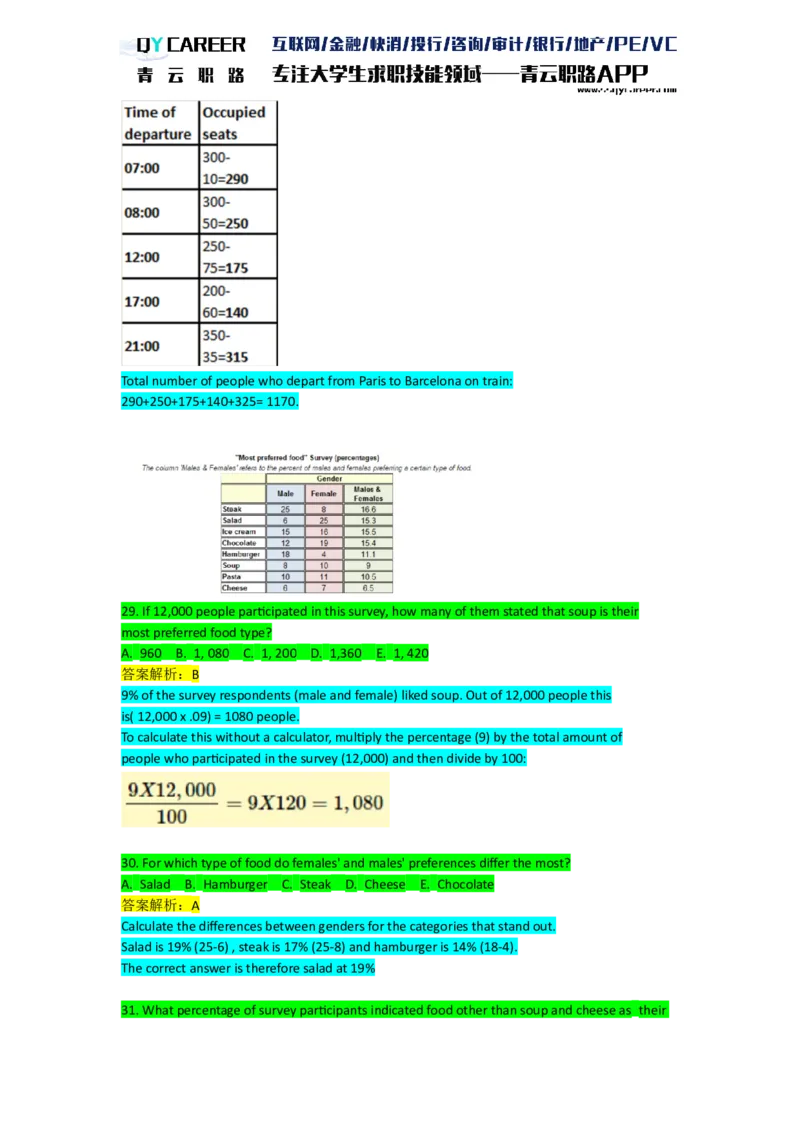
28. What is the total number of people who depart from Paris to Barcelona by train?
A. 1115 B. 1080 C.1280 D. 1005 E. 1170
答案解析:E
In order to answer this question we need to calculate the number of occupied seats in
each train and then sum up all the data to arrive at the correct answer:Total number of people who depart from Paris to Barcelona on train:
290+250+175+140+325= 1170.
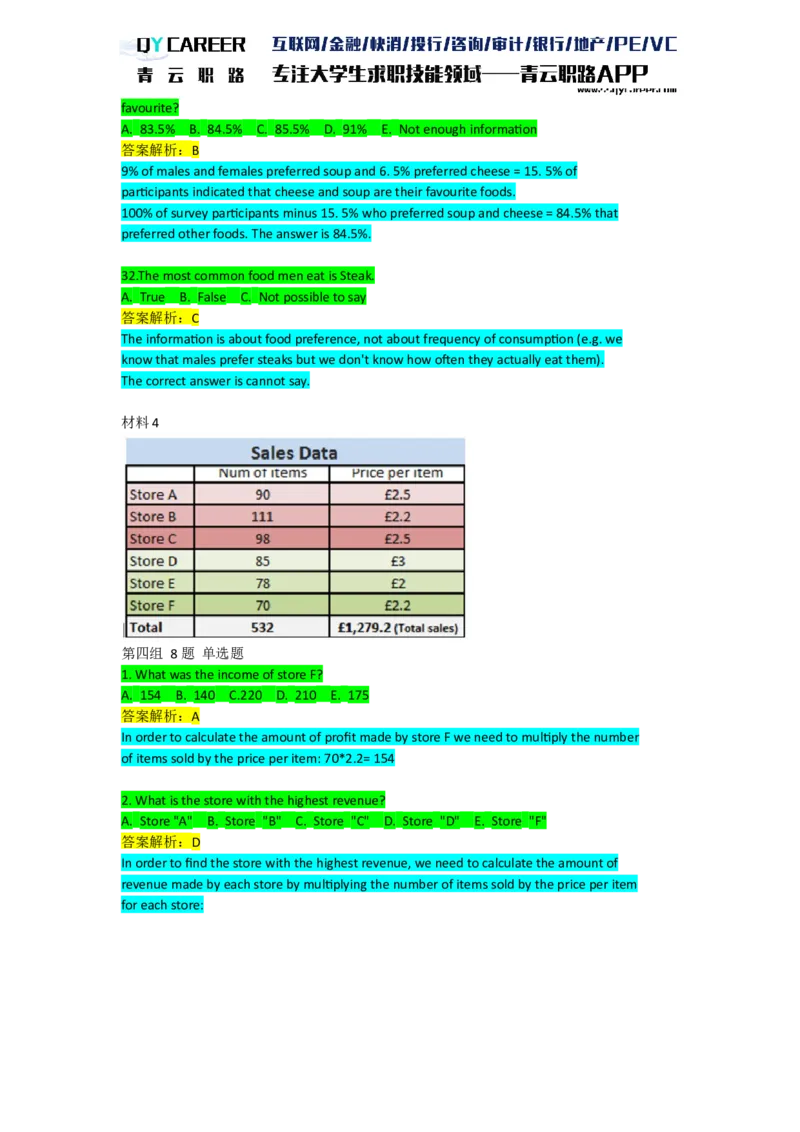
29. If 12,000 people participated in this survey, how many of them stated that soup is their
most preferred food type?
A. 960 B. 1, 080 C. 1, 200 D. 1,360 E. 1, 420
答案解析:B
9% of the survey respondents (male and female) liked soup. Out of 12,000 people this
is( 12,000 x .09) = 1080 people.
To calculate this without a calculator, multiply the percentage (9) by the total amount of
people who participated in the survey (12,000) and then divide by 100:
30. For which type of food do females' and males' preferences differ the most?
A. Salad B. Hamburger C. Steak D. Cheese E. Chocolate
答案解析:A
Calculate the differences between genders for the categories that stand out.
Salad is 19% (25-6) , steak is 17% (25-8) and hamburger is 14% (18-4).
The correct answer is therefore salad at 19%
31. What percentage of survey participants indicated food other than soup and cheese as theirfavourite?
A. 83.5% B. 84.5% C. 85.5% D. 91% E. Not enough information
答案解析:B
9% of males and females preferred soup and 6. 5% preferred cheese = 15. 5% of
participants indicated that cheese and soup are their favourite foods.
100% of survey participants minus 15. 5% who preferred soup and cheese = 84.5% that
preferred other foods. The answer is 84.5%.
32.The most common food men eat is Steak.
A. True B. False C. Not possible to say
答案解析:C
The information is about food preference, not about frequency of consumption (e.g. we
know that males prefer steaks but we don't know how often they actually eat them).
The correct answer is cannot say.
材料4
第四组 8题 单选题
1. What was the income of store F?
A. 154 B. 140 C.220 D. 210 E. 175
答案解析:A
In order to calculate the amount of profit made by store F we need to multiply the number
of items sold by the price per item: 70*2.2= 154
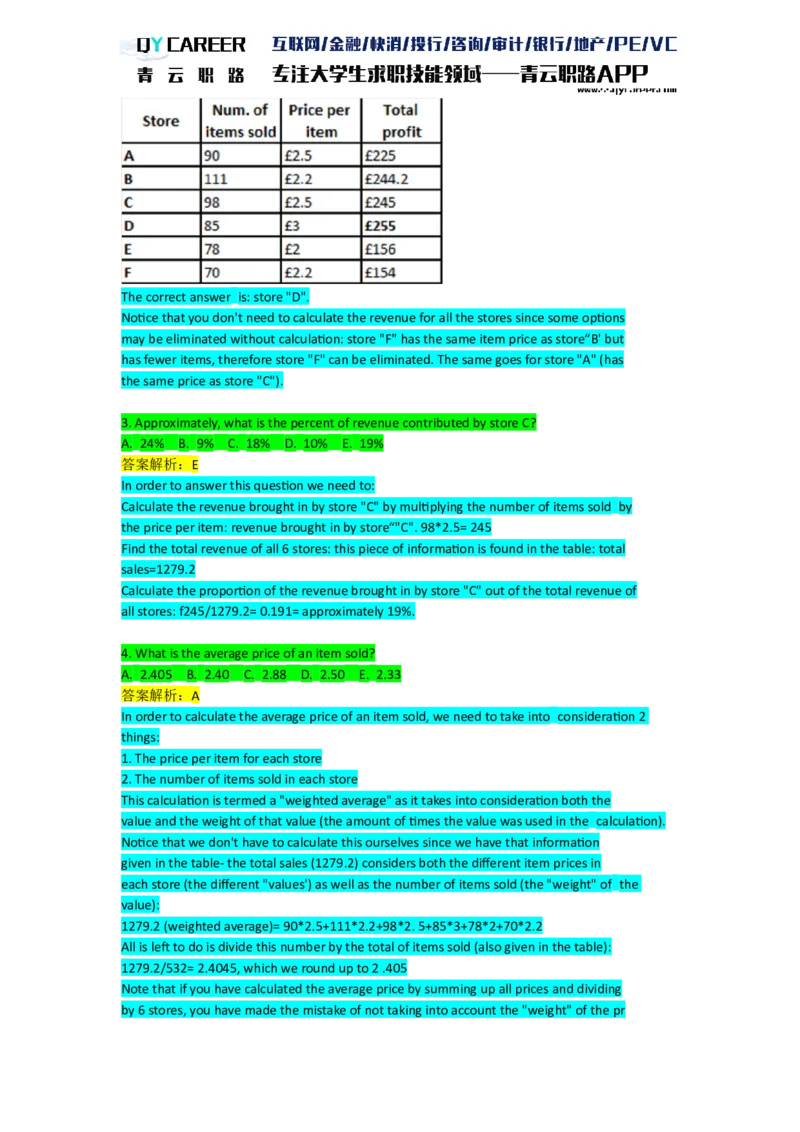
2. What is the store with the highest revenue?
A. Store "A" B. Store "B" C. Store "C" D. Store "D" E. Store "F"
答案解析:D
In order to find the store with the highest revenue, we need to calculate the amount of
revenue made by each store by multiplying the number of items sold by the price per item
for each store:The correct answer is: store "D".
Notice that you don't need to calculate the revenue for all the stores since some options
may be eliminated without calculation: store "F" has the same item price as store“B' but
has fewer items, therefore store "F" can be eliminated. The same goes for store "A" (has
the same price as store "C").
3. Approximately, what is the percent of revenue contributed by store C?
A. 24% B. 9% C. 18% D. 10% E. 19%
答案解析:E
In order to answer this question we need to:
Calculate the revenue brought in by store "C" by multiplying the number of items sold by
the price per item: revenue brought in by store“"C". 98*2.5= 245
Find the total revenue of all 6 stores: this piece of information is found in the table: total
sales=1279.2
Calculate the proportion of the revenue brought in by store "C" out of the total revenue of
all stores: f245/1279.2= 0.191= approximately 19%.
4. What is the average price of an item sold?
A. 2.405 B. 2.40 C. 2.88 D. 2.50 E. 2.33
答案解析:A
In order to calculate the average price of an item sold, we need to take into consideration 2
things:
1. The price per item for each store
2. The number of items sold in each store
This calculation is termed a "weighted average" as it takes into consideration both the
value and the weight of that value (the amount of times the value was used in the calculation).
Notice that we don't have to calculate this ourselves since we have that information
given in the table- the total sales (1279.2) considers both the different item prices in
each store (the different "values') as well as the number of items sold (the "weight" of the
value):
1279.2 (weighted average)= 90*2.5+111*2.2+98*2. 5+85*3+78*2+70*2.2
All is left to do is divide this number by the total of items sold (also given in the table):
1279.2/532= 2.4045, which we round up to 2 .405
Note that if you have calculated the average price by summing up all prices and dividing
by 6 stores, you have made the mistake of not taking into account the "weight" of the price (the number of items sold at each price).
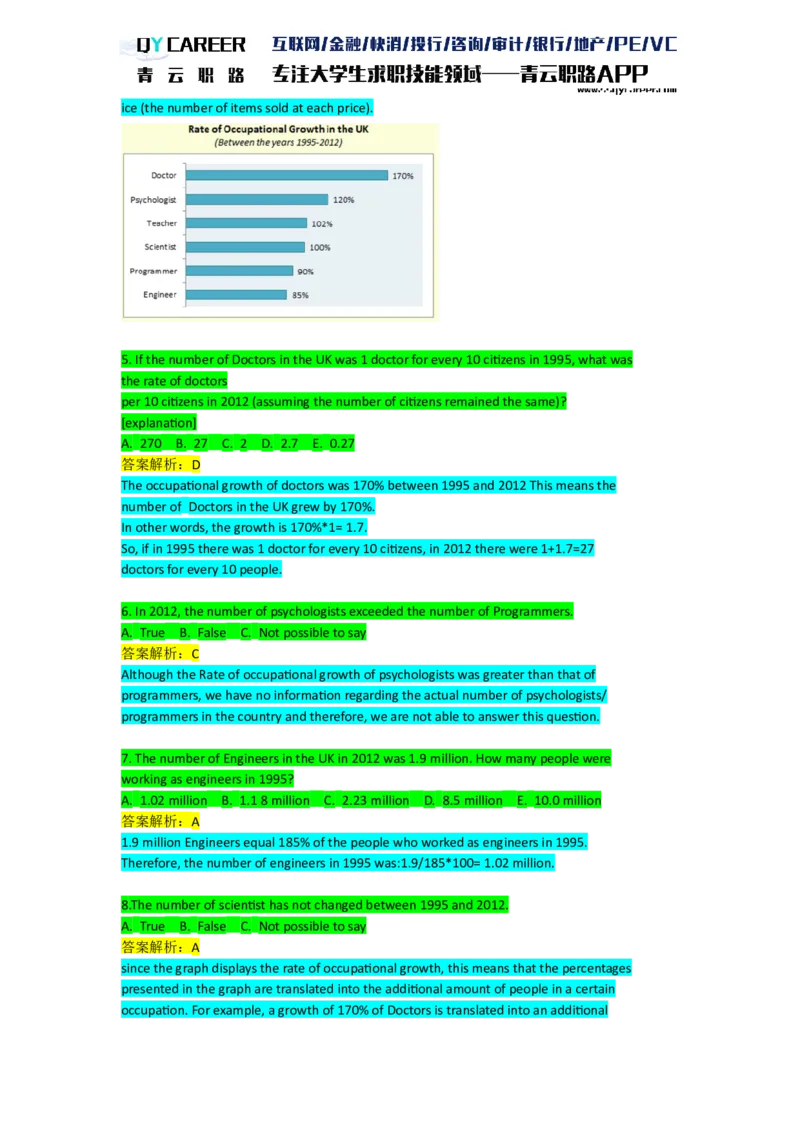
5. If the number of Doctors in the UK was 1 doctor for every 10 citizens in 1995, what was
the rate of doctors
per 10 citizens in 2012 (assuming the number of citizens remained the same)?
[explanation]
A. 270 B. 27 C. 2 D. 2.7 E. 0.27
答案解析:D
The occupational growth of doctors was 170% between 1995 and 2012 This means the
number of Doctors in the UK grew by 170%.
In other words, the growth is 170%*1= 1.7.
So, if in 1995 there was 1 doctor for every 10 citizens, in 2012 there were 1+1.7=27
doctors for every 10 people.
6. In 2012, the number of psychologists exceeded the number of Programmers.
A. True B. False C. Not possible to say
答案解析:C
Although the Rate of occupational growth of psychologists was greater than that of
programmers, we have no information regarding the actual number of psychologists/
programmers in the country and therefore, we are not able to answer this question.
7. The number of Engineers in the UK in 2012 was 1.9 million. How many people were
working as engineers in 1995?
A. 1.02 million B. 1.1 8 million C. 2.23 million D. 8.5 million E. 10.0 million
答案解析:A
1.9 million Engineers equal 185% of the people who worked as engineers in 1995.
Therefore, the number of engineers in 1995 was:1.9/185*100= 1.02 million.
8.The number of scientist has not changed between 1995 and 2012.
A. True B. False C. Not possible to say
答案解析:A
since the graph displays the rate of occupational growth, this means that the percentages
presented in the graph are translated into the additional amount of people in a certain
occupation. For example, a growth of 170% of Doctors is translated into an additional170% doctors in 2012 on top of the 100% doctors working in their profession in 1995.
Thus, the number of scientist has grown by 100% between the years 1995 and 2012.
材料5
第五组 8题 单选题
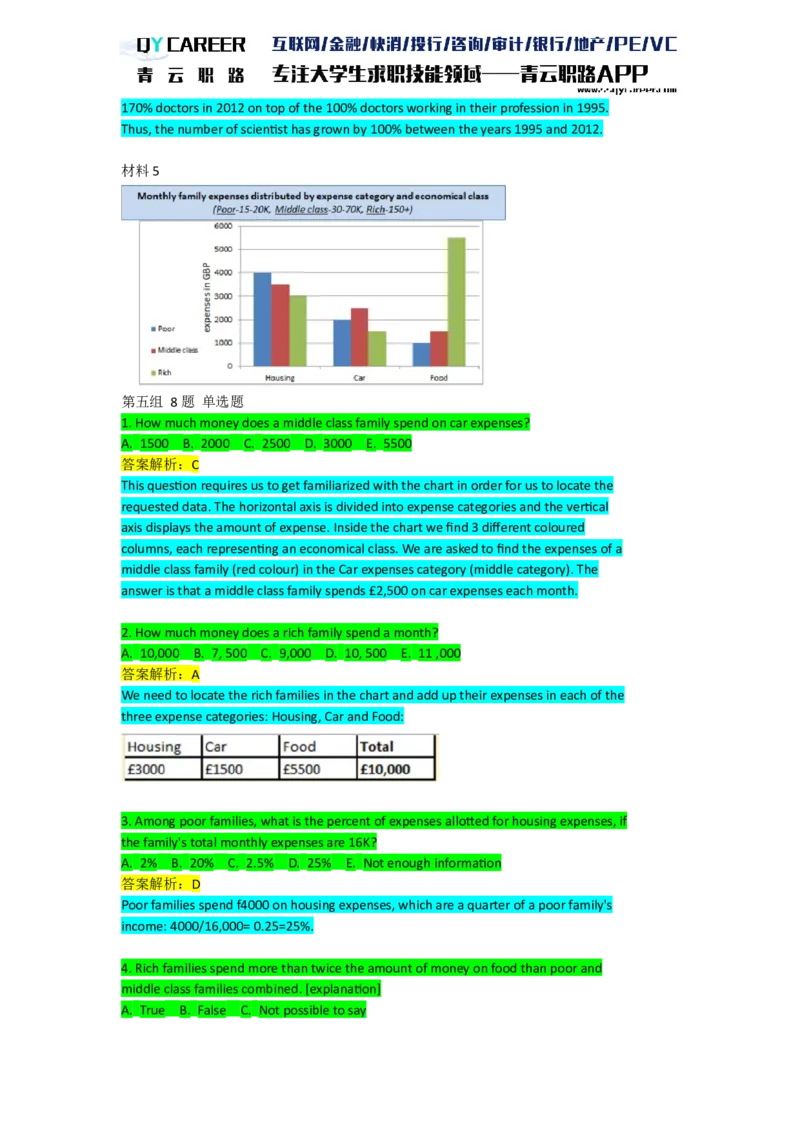
1. How much money does a middle class family spend on car expenses?
A. 1500 B. 2000 C. 2500 D. 3000 E. 5500
答案解析:C
This question requires us to get familiarized with the chart in order for us to locate the
requested data. The horizontal axis is divided into expense categories and the vertical
axis displays the amount of expense. Inside the chart we find 3 different coloured
columns, each representing an economical class. We are asked to find the expenses of a
middle class family (red colour) in the Car expenses category (middle category). The
answer is that a middle class family spends £2,500 on car expenses each month.
2. How much money does a rich family spend a month?
A. 10,000 B. 7, 500 C. 9,000 D. 10, 500 E. 11 ,000
答案解析:A
We need to locate the rich families in the chart and add up their expenses in each of the
three expense categories: Housing, Car and Food:
3. Among poor families, what is the percent of expenses allotted for housing expenses, if
the family's total monthly expenses are 16K?
A. 2% B. 20% C. 2.5% D. 25% E. Not enough information
答案解析:D
Poor families spend f4000 on housing expenses, which are a quarter of a poor family's
income: 4000/16,000= 0.25=25%.
4. Rich families spend more than twice the amount of money on food than poor and
middle class families combined. [explanation]
A. True B. False C. Not possible to say答案解析:A
Rich families spend 5,500 monthly on food, whereas Poor families spend 1000 and
middle class families spend 1 ,500. Combined poor and middle class families spend
2500 on food, which is less than half the amount spent by the rich families. Therefore,
rich families spend more than twice as much money on food than poor and middle class
families spend combined.
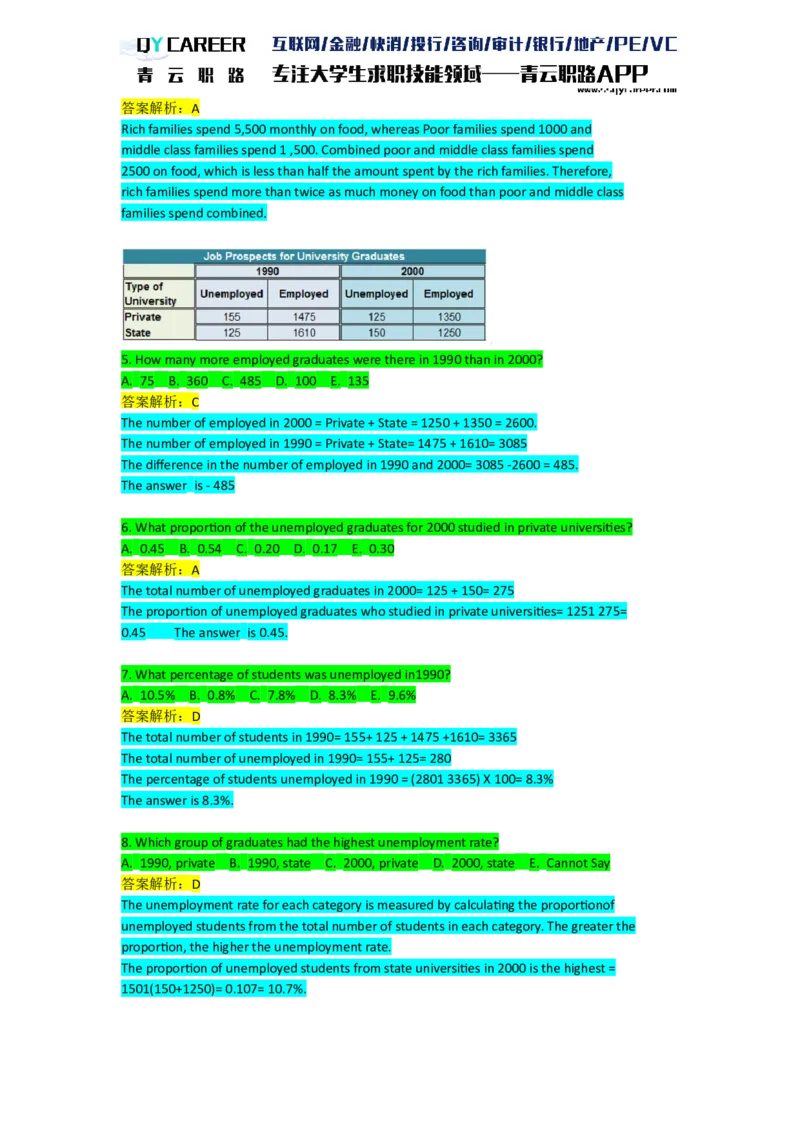
5. How many more employed graduates were there in 1990 than in 2000?
A. 75 B. 360 C. 485 D. 100 E. 135
答案解析:C
The number of employed in 2000 = Private + State = 1250 + 1350 = 2600.
The number of employed in 1990 = Private + State= 1475 + 1610= 3085
The difference in the number of employed in 1990 and 2000= 3085 -2600 = 485.
The answer is - 485
6. What proportion of the unemployed graduates for 2000 studied in private universities?
A. 0.45 B. 0.54 C. 0.20 D. 0.17 E. 0.30
答案解析:A
The total number of unemployed graduates in 2000= 125 + 150= 275
The proportion of unemployed graduates who studied in private universities= 1251 275=
0.45 The answer is 0.45.
7. What percentage of students was unemployed in1990?
A. 10.5% B. 0.8% C. 7.8% D. 8.3% E. 9.6%
答案解析:D
The total number of students in 1990= 155+ 125 + 1475 +1610= 3365
The total number of unemployed in 1990= 155+ 125= 280
The percentage of students unemployed in 1990 = (2801 3365) X 100= 8.3%
The answer is 8.3%.
8. Which group of graduates had the highest unemployment rate?
A. 1990, private B. 1990, state C. 2000, private D. 2000, state E. Cannot Say
答案解析:D
The unemployment rate for each category is measured by calculating the proportionof
unemployed students from the total number of students in each category. The greater the
proportion, the higher the unemployment rate.
The proportion of unemployed students from state universities in 2000 is the highest =
1501(150+1250)= 0.107= 10.7%.材料6
第六组 32题 单选题
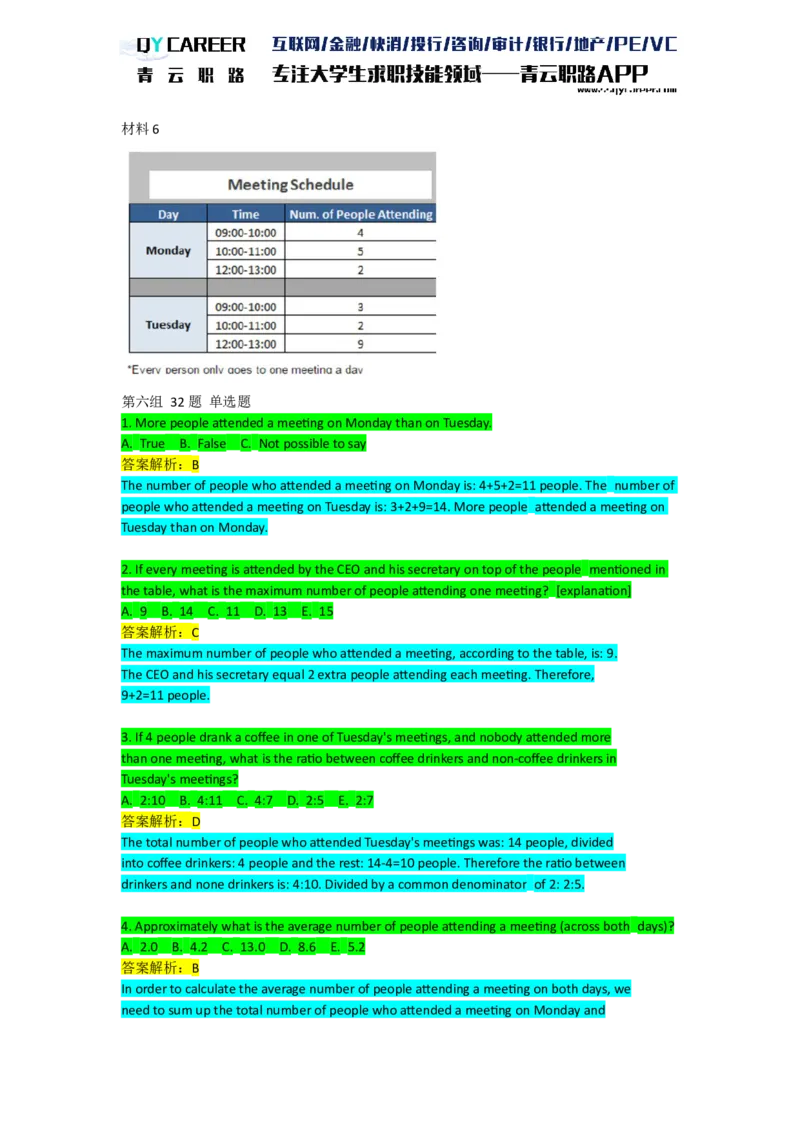
1. More people attended a meeting on Monday than on Tuesday.
A. True B. False C. Not possible to say
答案解析:B
The number of people who attended a meeting on Monday is: 4+5+2=11 people. The number of
people who attended a meeting on Tuesday is: 3+2+9=14. More people attended a meeting on
Tuesday than on Monday.
2. If every meeting is attended by the CEO and his secretary on top of the people mentioned in
the table, what is the maximum number of people attending one meeting? [explanation]
A. 9 B. 14 C. 11 D. 13 E. 15
答案解析:C
The maximum number of people who attended a meeting, according to the table, is: 9.
The CEO and his secretary equal 2 extra people attending each meeting. Therefore,
9+2=11 people.
3. If 4 people drank a coffee in one of Tuesday's meetings, and nobody attended more
than one meeting, what is the ratio between coffee drinkers and non-coffee drinkers in
Tuesday's meetings?
A. 2:10 B. 4:11 C. 4:7 D. 2:5 E. 2:7
答案解析:D
The total number of people who attended Tuesday's meetings was: 14 people, divided
into coffee drinkers: 4 people and the rest: 14-4=10 people. Therefore the ratio between
drinkers and none drinkers is: 4:10. Divided by a common denominator of 2: 2:5.
4. Approximately what is the average number of people attending a meeting (across both days)?
A. 2.0 B. 4.2 C. 13.0 D. 8.6 E. 5.2
答案解析:B
In order to calculate the average number of people attending a meeting on both days, we
need to sum up the total number of people who attended a meeting on Monday andTuesday and divide it by the total number of meetings held on both days (6):
(4+5+2+3+2+9)/6= 4.2 people on average.
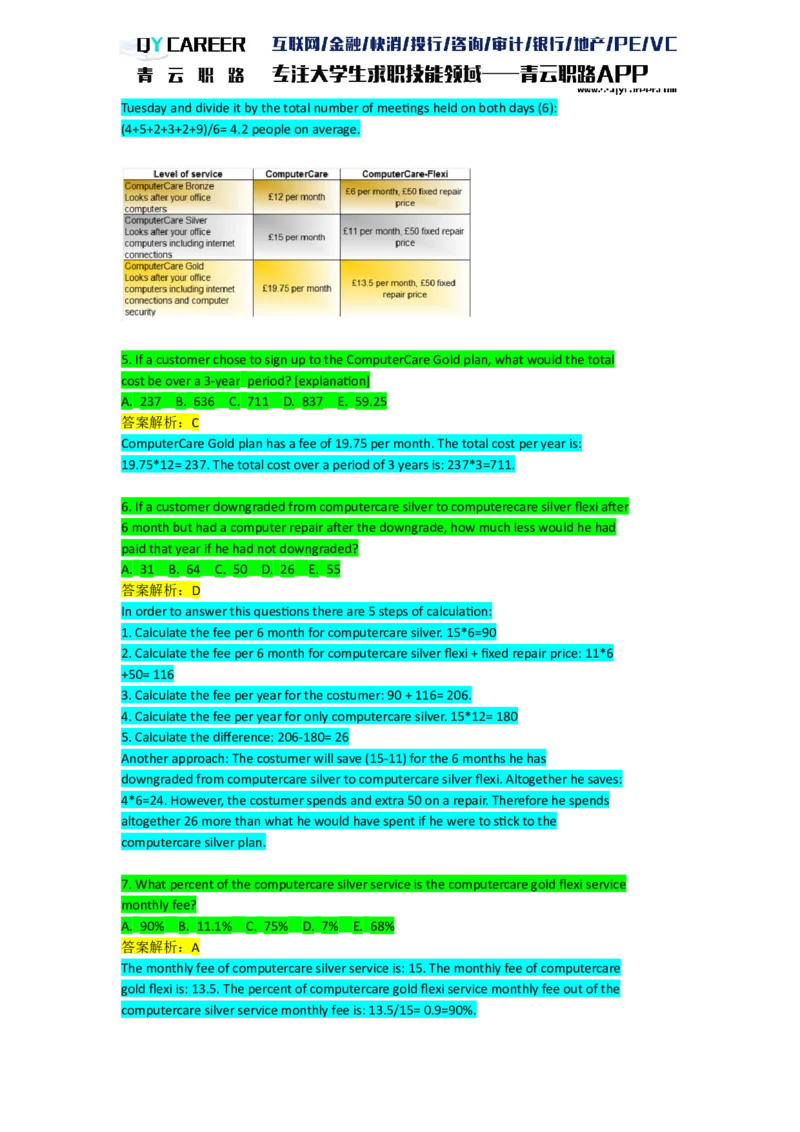
5. If a customer chose to sign up to the ComputerCare Gold plan, what would the total
cost be over a 3-year period? [explanation]
A. 237 B. 636 C. 711 D. 837 E. 59.25
答案解析:C
ComputerCare Gold plan has a fee of 19.75 per month. The total cost per year is:
19.75*12= 237. The total cost over a period of 3 years is: 237*3=711.
6. If a customer downgraded from computercare silver to computerecare silver flexi after
6 month but had a computer repair after the downgrade, how much less would he had
paid that year if he had not downgraded?
A. 31 B. 64 C. 50 D. 26 E. 55
答案解析:D
In order to answer this questions there are 5 steps of calculation:
1. Calculate the fee per 6 month for computercare silver. 15*6=90
2. Calculate the fee per 6 month for computercare silver flexi + fixed repair price: 11*6
+50= 116
3. Calculate the fee per year for the costumer: 90 + 116= 206.
4. Calculate the fee per year for only computercare silver. 15*12= 180
5. Calculate the difference: 206-180= 26
Another approach: The costumer will save (15-11) for the 6 months he has
downgraded from computercare silver to computercare silver flexi. Altogether he saves:
4*6=24. However, the costumer spends and extra 50 on a repair. Therefore he spends
altogether 26 more than what he would have spent if he were to stick to the
computercare silver plan.
7. What percent of the computercare silver service is the computercare gold flexi service
monthly fee?
A. 90% B. 11.1% C. 75% D. 7% E. 68%
答案解析:A
The monthly fee of computercare silver service is: 15. The monthly fee of computercare
gold flexi is: 13.5. The percent of computercare gold flexi service monthly fee out of the
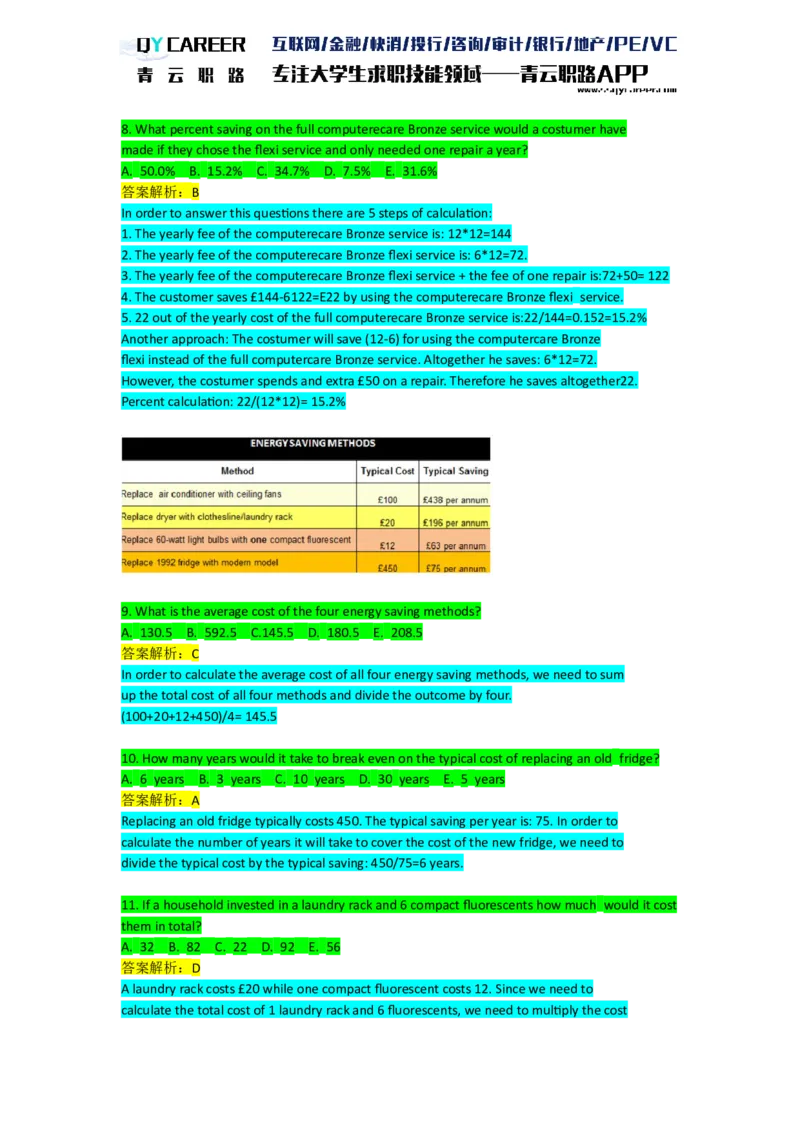
computercare silver service monthly fee is: 13.5/15= 0.9=90%.8. What percent saving on the full computerecare Bronze service would a costumer have
made if they chose the flexi service and only needed one repair a year?
A. 50.0% B. 15.2% C. 34.7% D. 7.5% E. 31.6%
答案解析:B
In order to answer this questions there are 5 steps of calculation:
1. The yearly fee of the computerecare Bronze service is: 12*12=144
2. The yearly fee of the computerecare Bronze flexi service is: 6*12=72.
3. The yearly fee of the computerecare Bronze flexi service + the fee of one repair is:72+50= 122
4. The customer saves £144-6122=E22 by using the computerecare Bronze flexi service.
5. 22 out of the yearly cost of the full computerecare Bronze service is:22/144=0.152=15.2%
Another approach: The costumer will save (12-6) for using the computercare Bronze
flexi instead of the full computercare Bronze service. Altogether he saves: 6*12=72.
However, the costumer spends and extra £50 on a repair. Therefore he saves altogether22.
Percent calculation: 22/(12*12)= 15.2%
9. What is the average cost of the four energy saving methods?
A. 130.5 B. 592.5 C.145.5 D. 180.5 E. 208.5
答案解析:C
In order to calculate the average cost of all four energy saving methods, we need to sum
up the total cost of all four methods and divide the outcome by four.
(100+20+12+450)/4= 145.5
10. How many years would it take to break even on the typical cost of replacing an old fridge?
A. 6 years B. 3 years C. 10 years D. 30 years E. 5 years
答案解析:A
Replacing an old fridge typically costs 450. The typical saving per year is: 75. In order to
calculate the number of years it will take to cover the cost of the new fridge, we need to
divide the typical cost by the typical saving: 450/75=6 years.
11. If a household invested in a laundry rack and 6 compact fluorescents how much would it cost
them in total?
A. 32 B. 82 C. 22 D. 92 E. 56
答案解析:D
A laundry rack costs £20 while one compact fluorescent costs 12. Since we need to
calculate the total cost of 1 laundry rack and 6 fluorescents, we need to multiply the costof one florescent light by 6 in order to arrive at the correct result: 20 + 6*12= 92
12. What would be the typical saving per week if an air conditioner was replaced with ceiling
fans?
A. 7.82 B. 43.80 C. 16.33 D. 36.50 E. 8.42
答案解析:E
The typical saving of replacing air-conditioning with ceiling fans is: 438 per year. Since
there are 52 weeks in one year, we need to divide the yearly saving by 52 in order to arrive
at the correct answer: 438/52= 8.42.
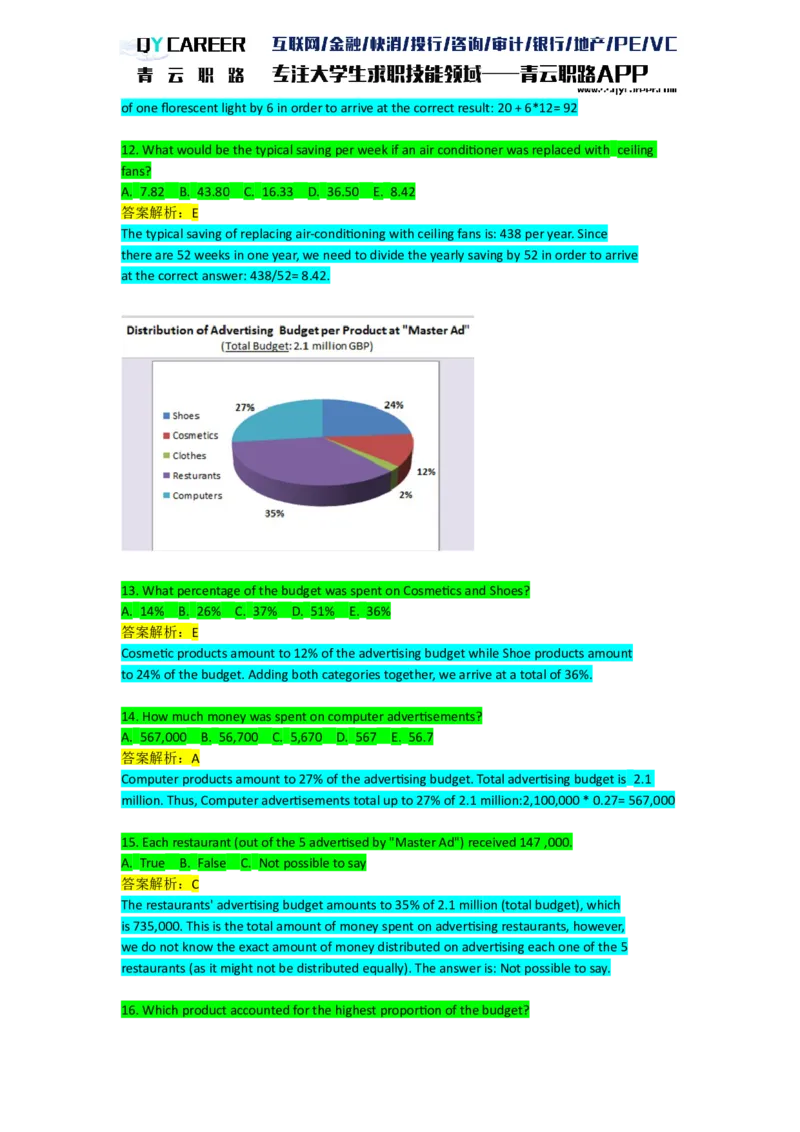
13. What percentage of the budget was spent on Cosmetics and Shoes?
A. 14% B. 26% C. 37% D. 51% E. 36%
答案解析:E
Cosmetic products amount to 12% of the advertising budget while Shoe products amount
to 24% of the budget. Adding both categories together, we arrive at a total of 36%.
14. How much money was spent on computer advertisements?
A. 567,000 B. 56,700 C. 5,670 D. 567 E. 56.7
答案解析:A
Computer products amount to 27% of the advertising budget. Total advertising budget is 2.1
million. Thus, Computer advertisements total up to 27% of 2.1 million:2,100,000 * 0.27= 567,000
15. Each restaurant (out of the 5 advertised by "Master Ad") received 147 ,000.
A. True B. False C. Not possible to say
答案解析:C
The restaurants' advertising budget amounts to 35% of 2.1 million (total budget), which
is 735,000. This is the total amount of money spent on advertising restaurants, however,
we do not know the exact amount of money distributed on advertising each one of the 5
restaurants (as it might not be distributed equally). The answer is: Not possible to say.
16. Which product accounted for the highest proportion of the budget?A. Shoes B. Restaurants C. Computers D. Cosmetics E. Clothes
答案解析:B
A proportion is "a part considered in relation to the whole." Percentages are also a part in
relation to a whole (the whole being 100% of the budget). And so, the highest percentage
product category is also the product accounting for the highest proportion of the budget.
The correct answer is Restaurants, accounting for 35% of the total budget.
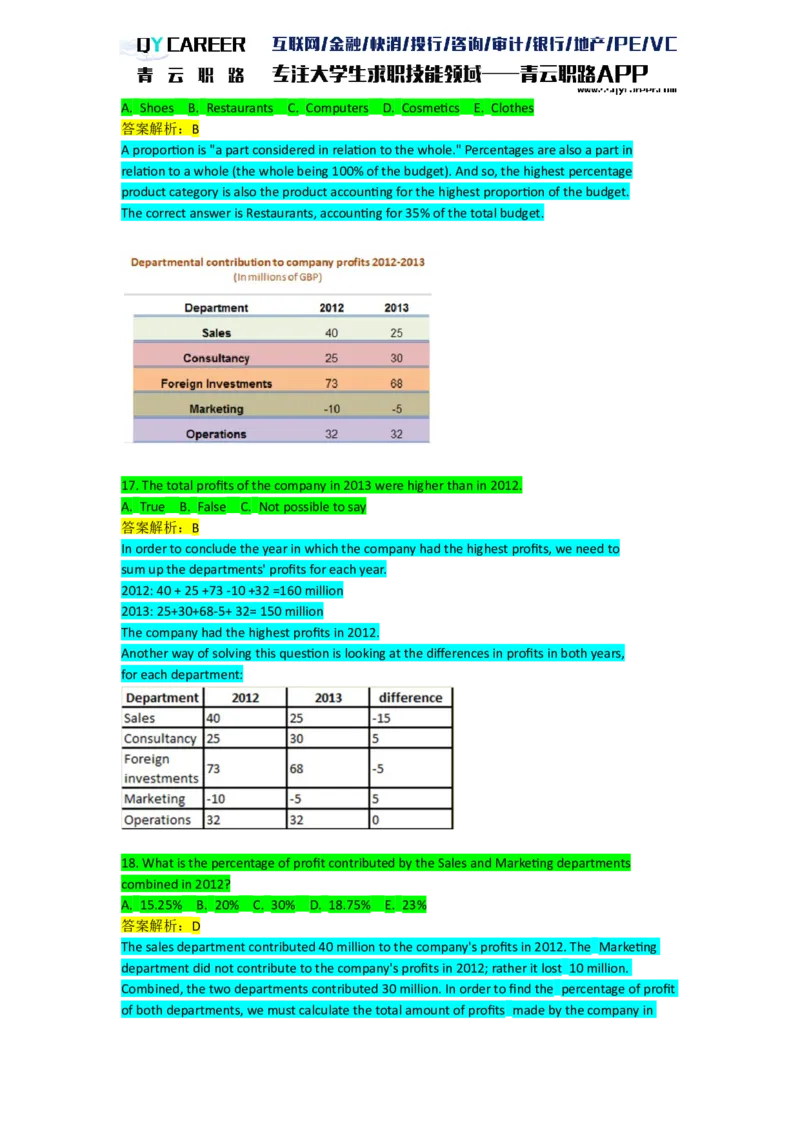
17. The total profits of the company in 2013 were higher than in 2012.
A. True B. False C. Not possible to say
答案解析:B
In order to conclude the year in which the company had the highest profits, we need to
sum up the departments' profits for each year.
2012: 40 + 25 +73 -10 +32 =160 million
2013: 25+30+68-5+ 32= 150 million
The company had the highest profits in 2012.
Another way of solving this question is looking at the differences in profits in both years,
for each department:
18. What is the percentage of profit contributed by the Sales and Marketing departments
combined in 2012?
A. 15.25% B. 20% C. 30% D. 18.75% E. 23%
答案解析:D
The sales department contributed 40 million to the company's profits in 2012. The Marketing
department did not contribute to the company's profits in 2012; rather it lost 10 million.
Combined, the two departments contributed 30 million. In order to find the percentage of profit
of both departments, we must calculate the total amount of profits made by the company in2012: 40+25+73-10+32=160 million. Thus, the percentage of profit contributed by the Sales and
Marketing departments combined in 2012 is: 30 million/ 160 million *100= 18.75%
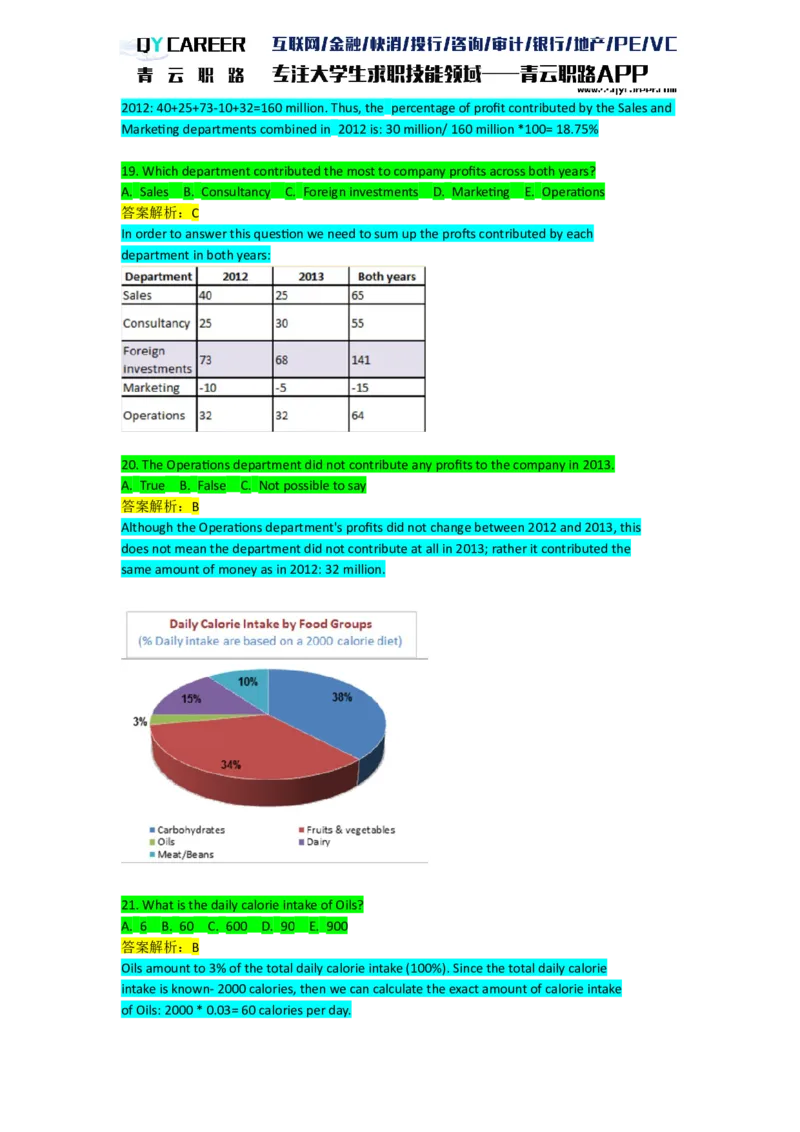
19. Which department contributed the most to company profits across both years?
A. Sales B. Consultancy C. Foreign investments D. Marketing E. Operations
答案解析:C
In order to answer this question we need to sum up the profts contributed by each
department in both years:
20. The Operations department did not contribute any profits to the company in 2013.
A. True B. False C. Not possible to say
答案解析:B
Although the Operations department's profits did not change between 2012 and 2013, this
does not mean the department did not contribute at all in 2013; rather it contributed the
same amount of money as in 2012: 32 million.
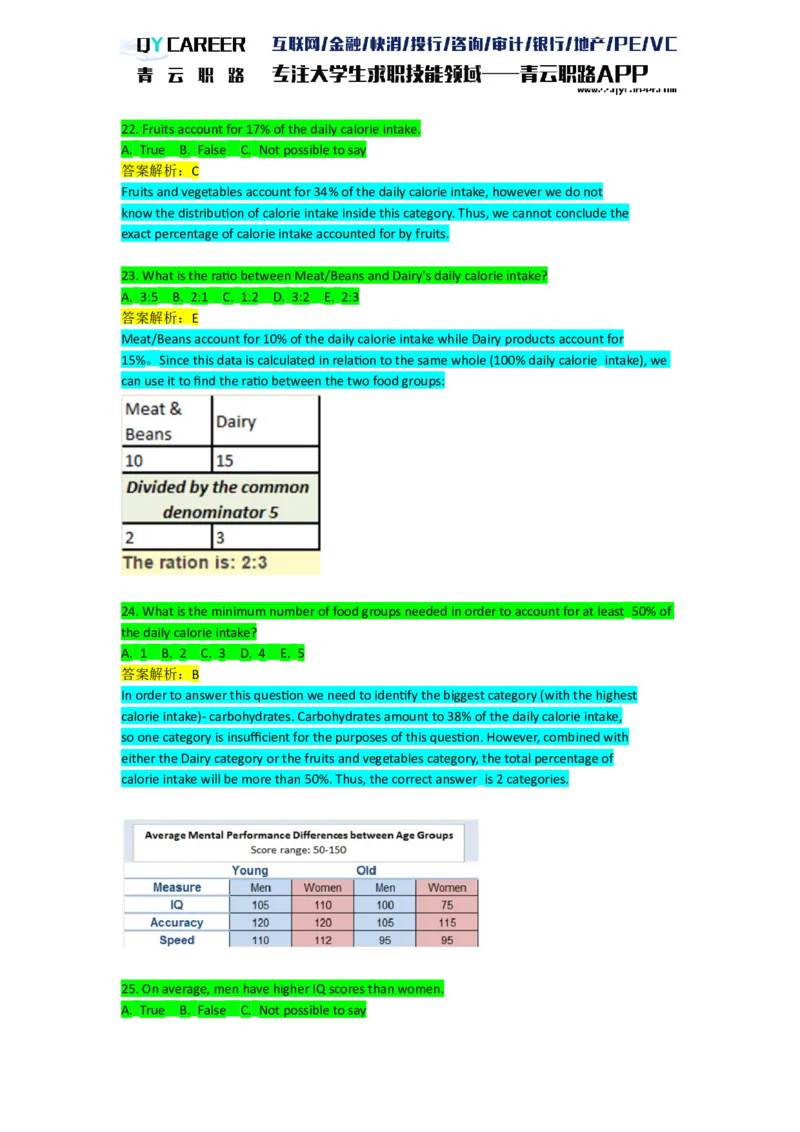
21. What is the daily calorie intake of Oils?
A. 6 B. 60 C. 600 D. 90 E. 900
答案解析:B
Oils amount to 3% of the total daily calorie intake (100%). Since the total daily calorie
intake is known- 2000 calories, then we can calculate the exact amount of calorie intake
of Oils: 2000 * 0.03= 60 calories per day.22. Fruits account for 17% of the daily calorie intake.
A. True B. False C. Not possible to say
答案解析:C
Fruits and vegetables account for 34% of the daily calorie intake, however we do not
know the distribution of calorie intake inside this category. Thus, we cannot conclude the
exact percentage of calorie intake accounted for by fruits.
23. What is the ratio between Meat/Beans and Dairy's daily calorie intake?
A. 3:5 B. 2:1 C. 1:2 D. 3:2 E. 2:3
答案解析:E
Meat/Beans account for 10% of the daily calorie intake while Dairy products account for
15%。Since this data is calculated in relation to the same whole (100% daily calorie intake), we
can use it to find the ratio between the two food groups:
24. What is the minimum number of food groups needed in order to account for at least 50% of
the daily calorie intake?
A. 1 B. 2 C. 3 D. 4 E. 5
答案解析:B
In order to answer this question we need to identify the biggest category (with the highest
calorie intake)- carbohydrates. Carbohydrates amount to 38% of the daily calorie intake,
so one category is insufficient for the purposes of this question. However, combined with
either the Dairy category or the fruits and vegetables category, the total percentage of
calorie intake will be more than 50%. Thus, the correct answer is 2 categories.
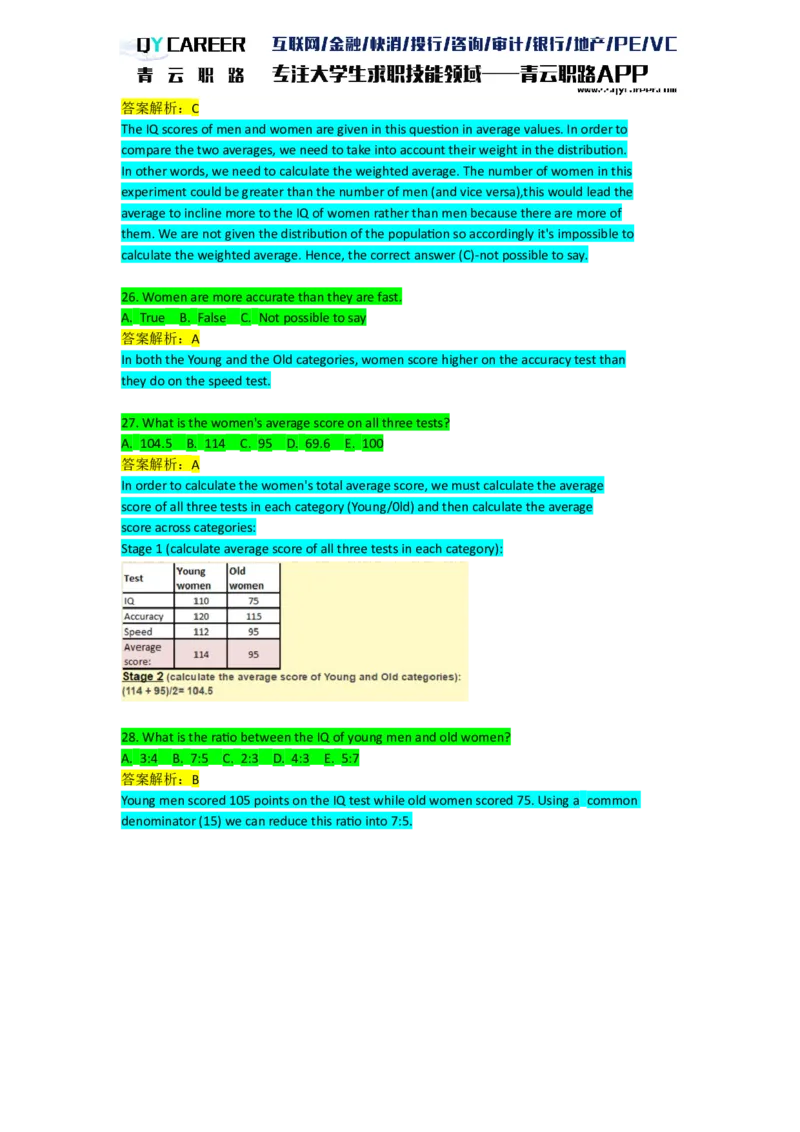
25. On average, men have higher IQ scores than women.
A. True B. False C. Not possible to say答案解析:C
The IQ scores of men and women are given in this question in average values. In order to
compare the two averages, we need to take into account their weight in the distribution.
In other words, we need to calculate the weighted average. The number of women in this
experiment could be greater than the number of men (and vice versa),this would lead the
average to incline more to the IQ of women rather than men because there are more of
them. We are not given the distribution of the population so accordingly it's impossible to
calculate the weighted average. Hence, the correct answer (C)-not possible to say.
26. Women are more accurate than they are fast.
A. True B. False C. Not possible to say
答案解析:A
In both the Young and the Old categories, women score higher on the accuracy test than
they do on the speed test.
27. What is the women's average score on all three tests?
A. 104.5 B. 114 C. 95 D. 69.6 E. 100
答案解析:A
In order to calculate the women's total average score, we must calculate the average
score of all three tests in each category (Young/0ld) and then calculate the average
score across categories:
Stage 1 (calculate average score of all three tests in each category):
28. What is the ratio between the IQ of young men and old women?
A. 3:4 B. 7:5 C. 2:3 D. 4:3 E. 5:7
答案解析:B
Young men scored 105 points on the IQ test while old women scored 75. Using a common
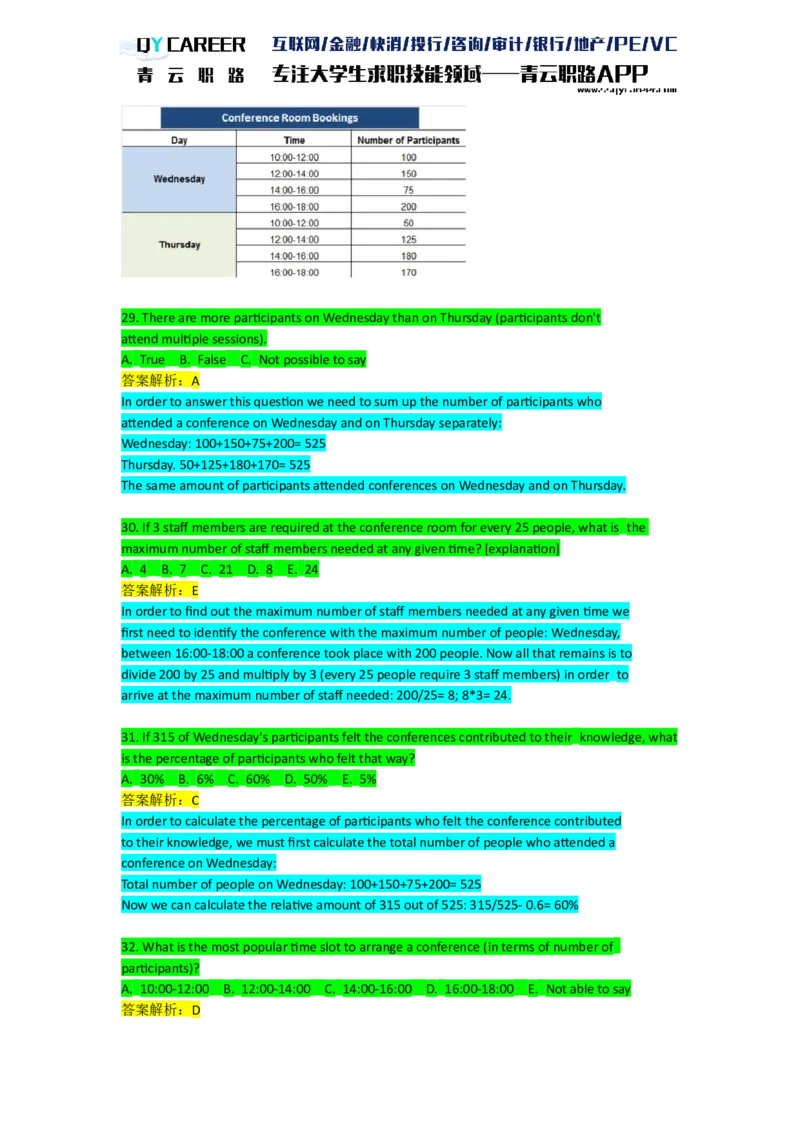
denominator (15) we can reduce this ratio into 7:5.29. There are more participants on Wednesday than on Thursday (participants don't
attend multiple sessions).
A. True B. False C. Not possible to say
答案解析:A
In order to answer this question we need to sum up the number of participants who
attended a conference on Wednesday and on Thursday separately:
Wednesday: 100+150+75+200= 525
Thursday. 50+125+180+170= 525
The same amount of participants attended conferences on Wednesday and on Thursday.
30. If 3 staff members are required at the conference room for every 25 people, what is the
maximum number of staff members needed at any given time? [explanation]
A. 4 B. 7 C. 21 D. 8 E. 24
答案解析:E
In order to find out the maximum number of staff members needed at any given time we
first need to identify the conference with the maximum number of people: Wednesday,
between 16:00-18:00 a conference took place with 200 people. Now all that remains is to
divide 200 by 25 and multiply by 3 (every 25 people require 3 staff members) in order to
arrive at the maximum number of staff needed: 200/25= 8; 8*3= 24.
31. If 315 of Wednesday's participants felt the conferences contributed to their knowledge, what
is the percentage of participants who felt that way?
A. 30% B. 6% C. 60% D. 50% E. 5%
答案解析:C
In order to calculate the percentage of participants who felt the conference contributed
to their knowledge, we must first calculate the total number of people who attended a
conference on Wednesday:
Total number of people on Wednesday: 100+150+75+200= 525
Now we can calculate the relative amount of 315 out of 525: 315/525- 0.6= 60%
32. What is the most popular time slot to arrange a conference (in terms of number of
participants)?
A. 10:00-12:00 B. 12:00-14:00 C. 14:00-16:00 D. 16:00-18:00 E. Not able to say
答案解析:DIn order to answer this question we need to find the average number of participants at
each time slot, across both days:
