


文档内容
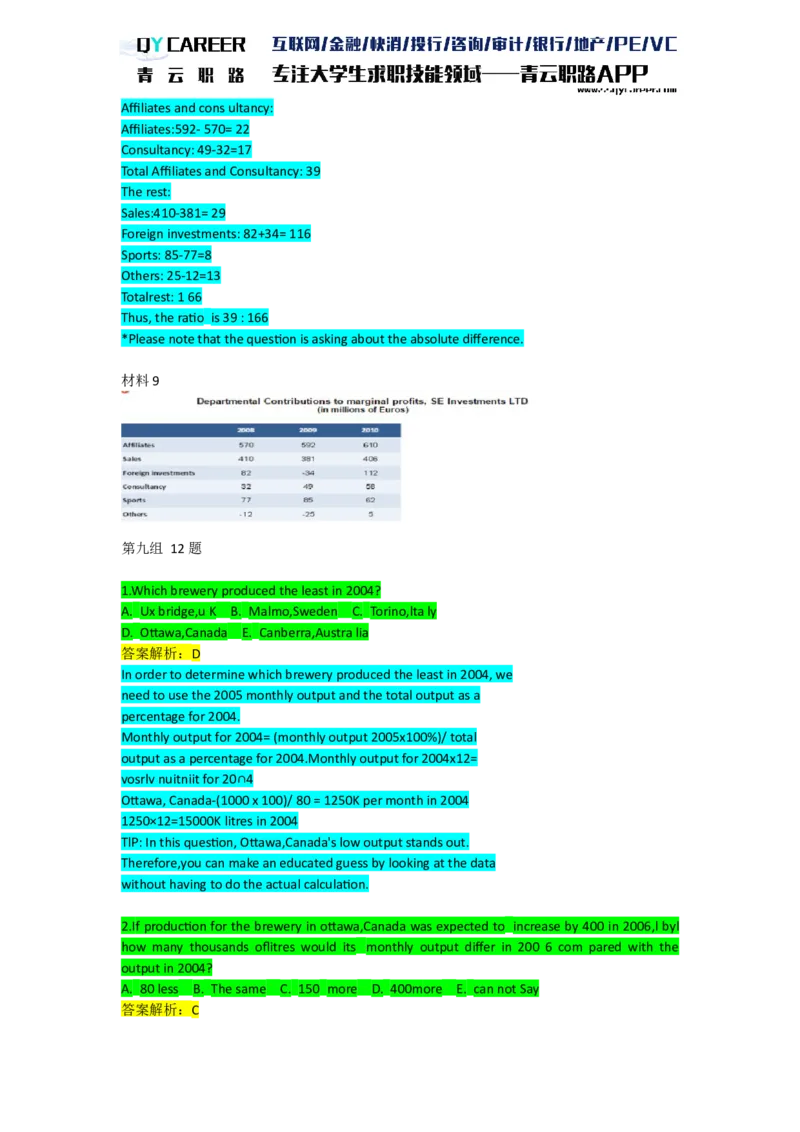
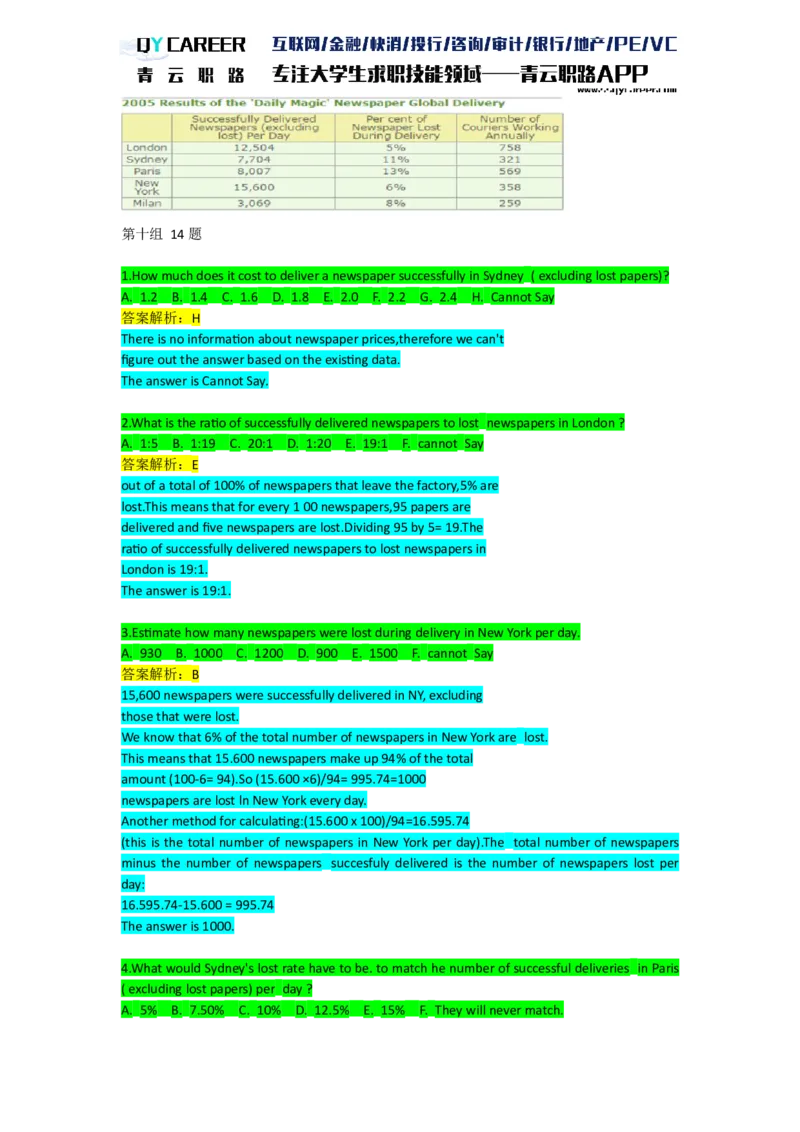
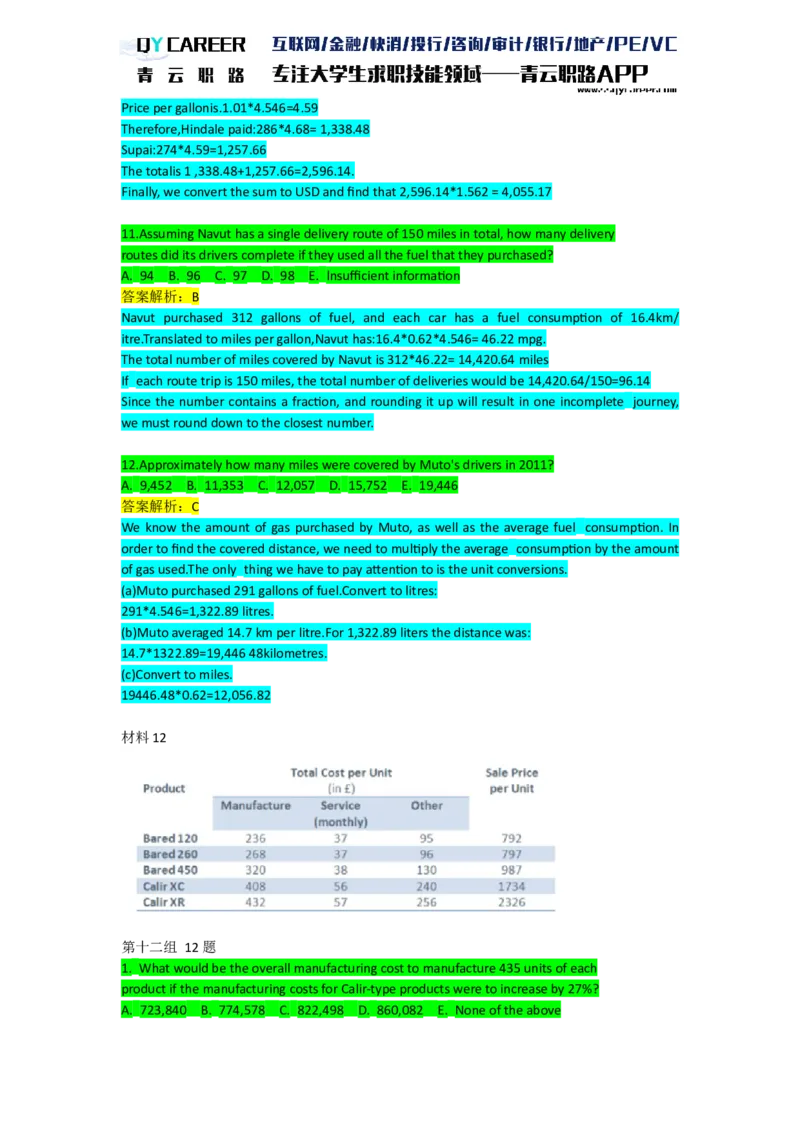
Numerical Extra Practice
材料1
第一组 12题
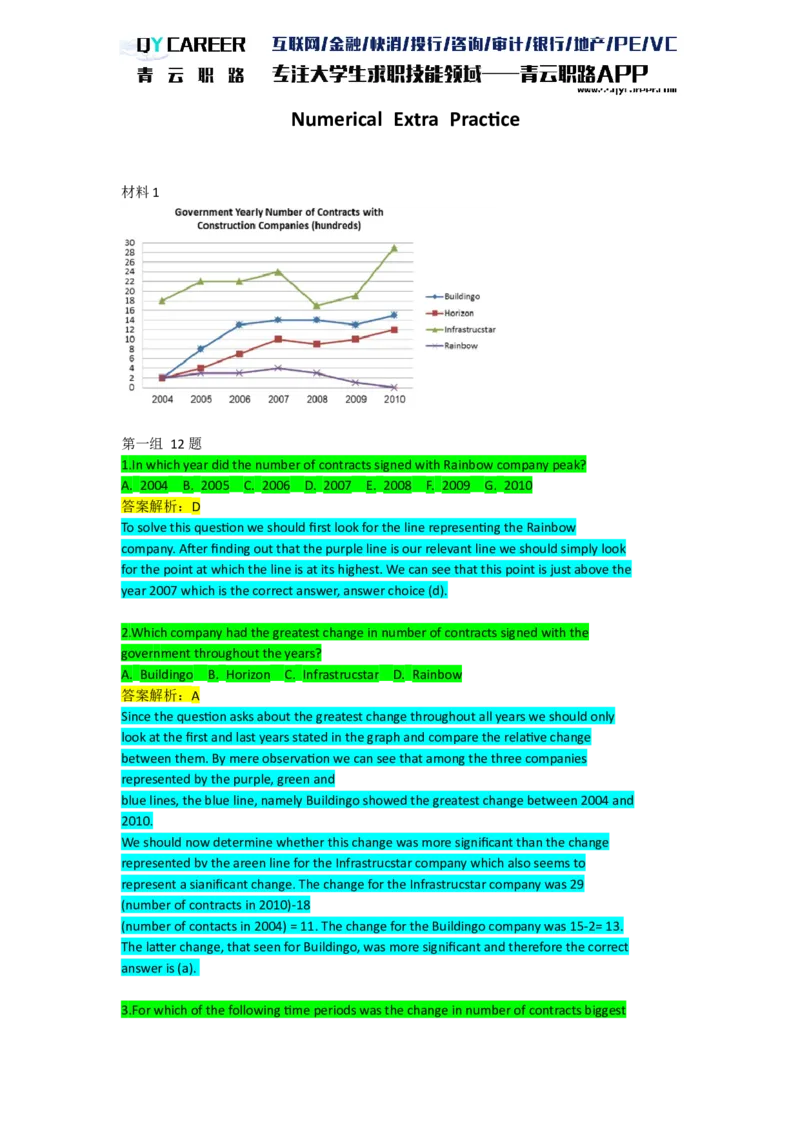
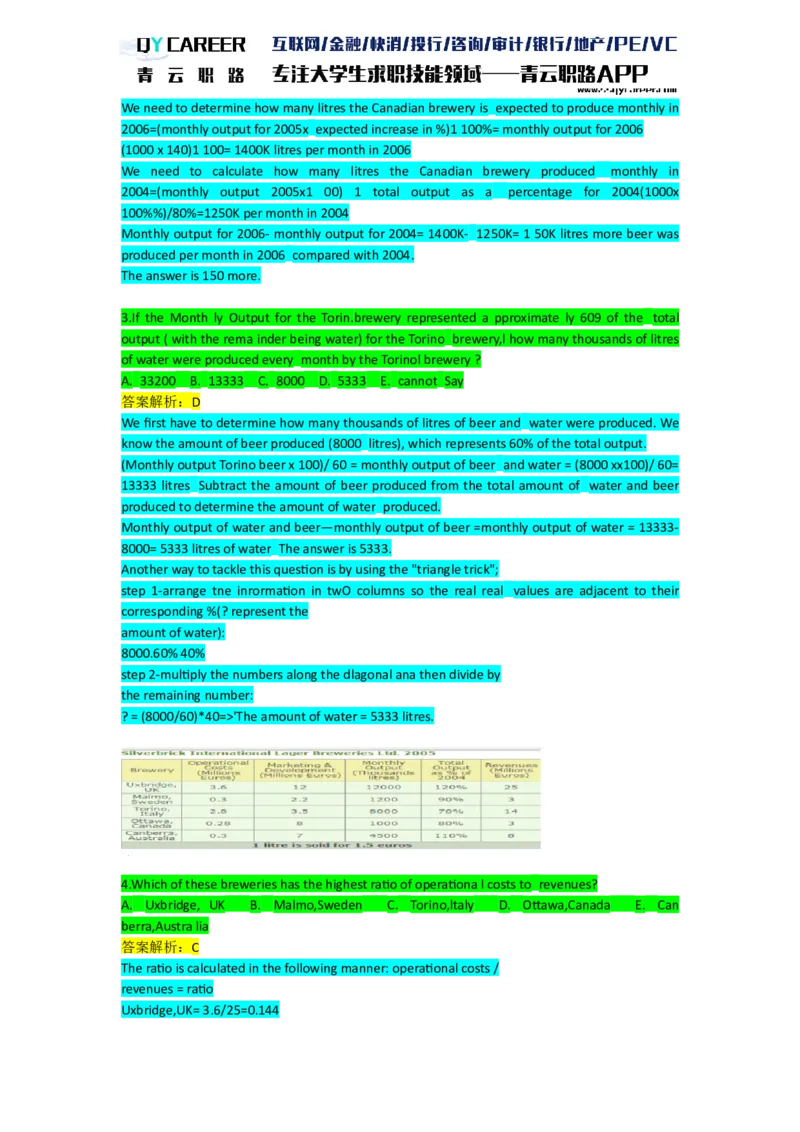
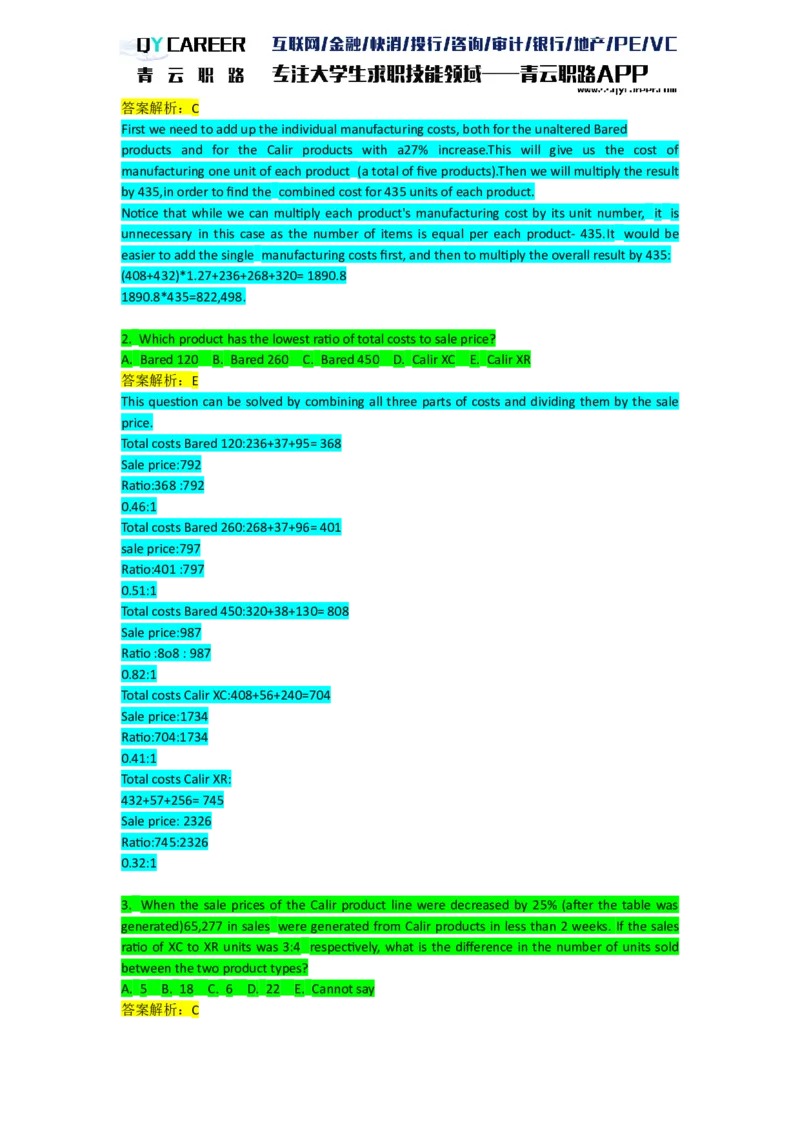
1.In which year did the number of contracts signed with Rainbow company peak?
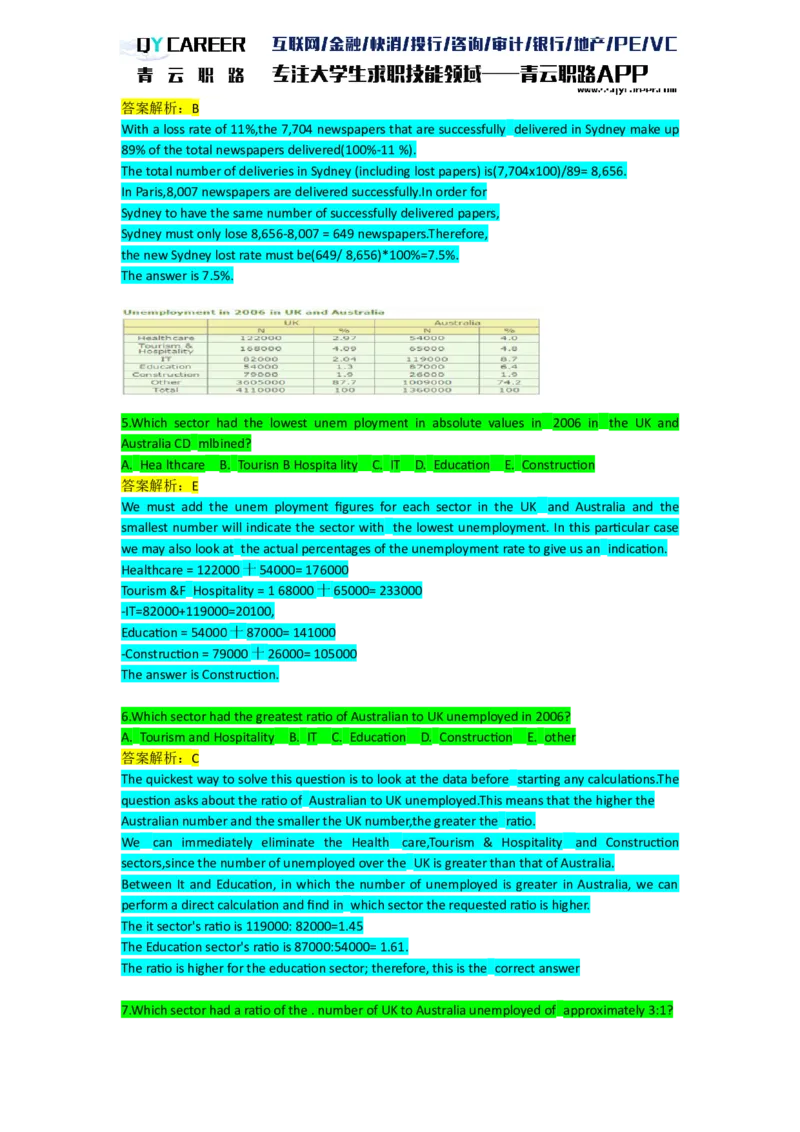
A. 2004 B. 2005 C. 2006 D. 2007 E. 2008 F. 2009 G. 2010
答案解析:D
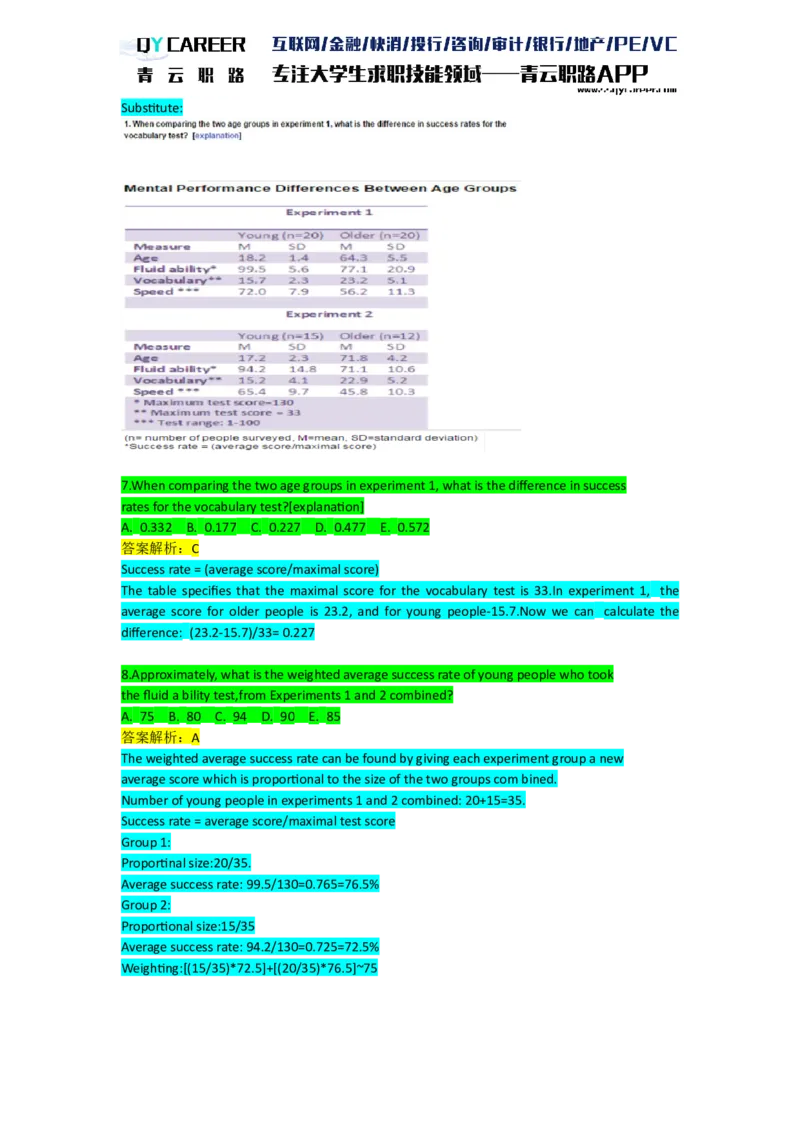
To solve this question we should first look for the line representing the Rainbow
company. After finding out that the purple line is our relevant line we should simply look
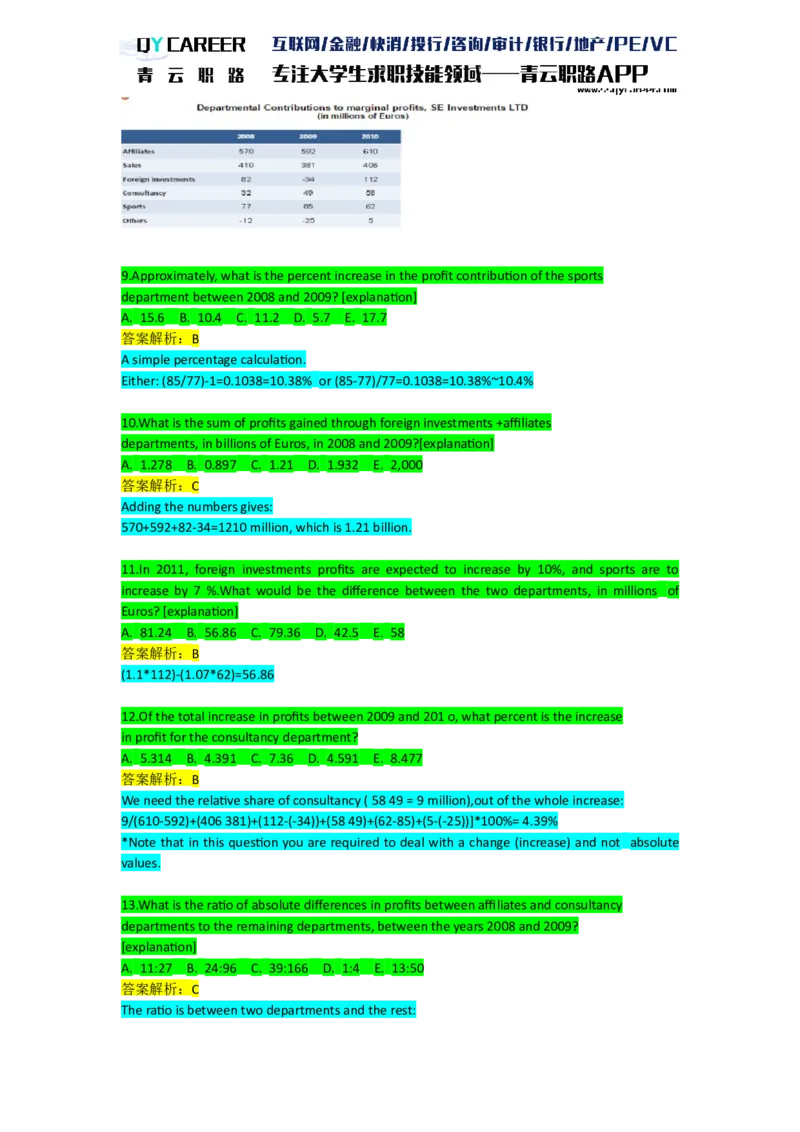
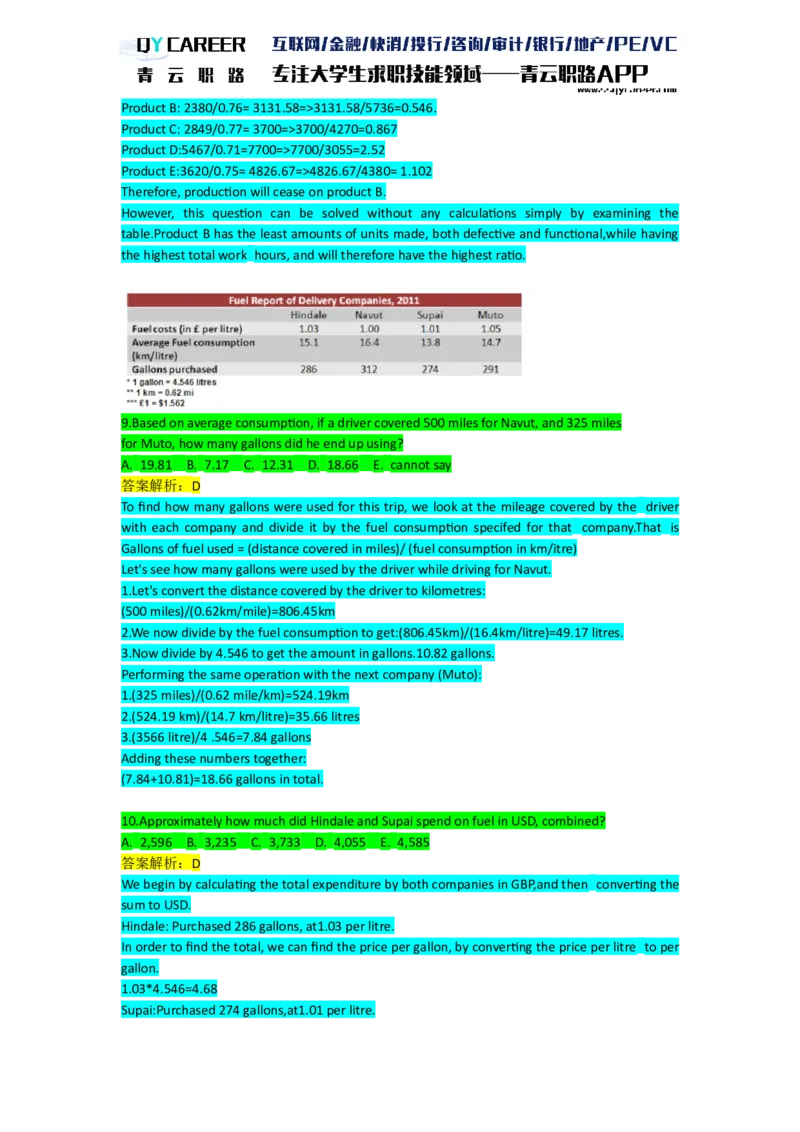
for the point at which the line is at its highest. We can see that this point is just above the
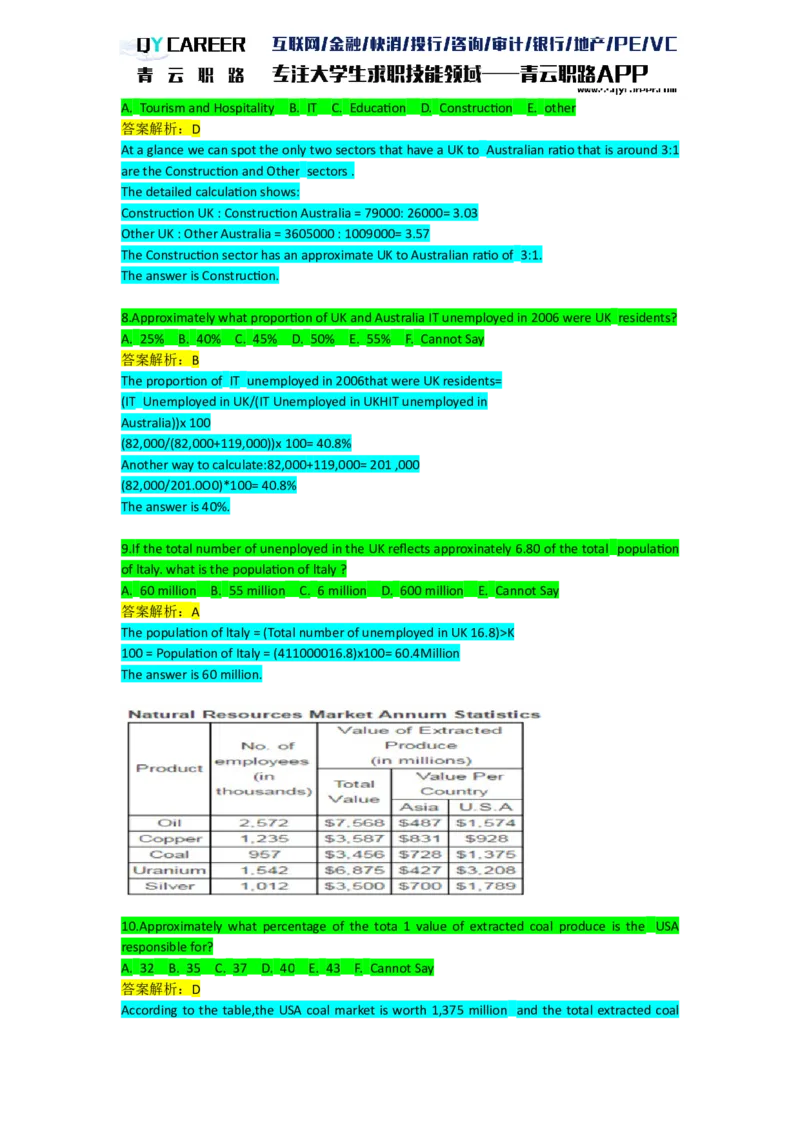
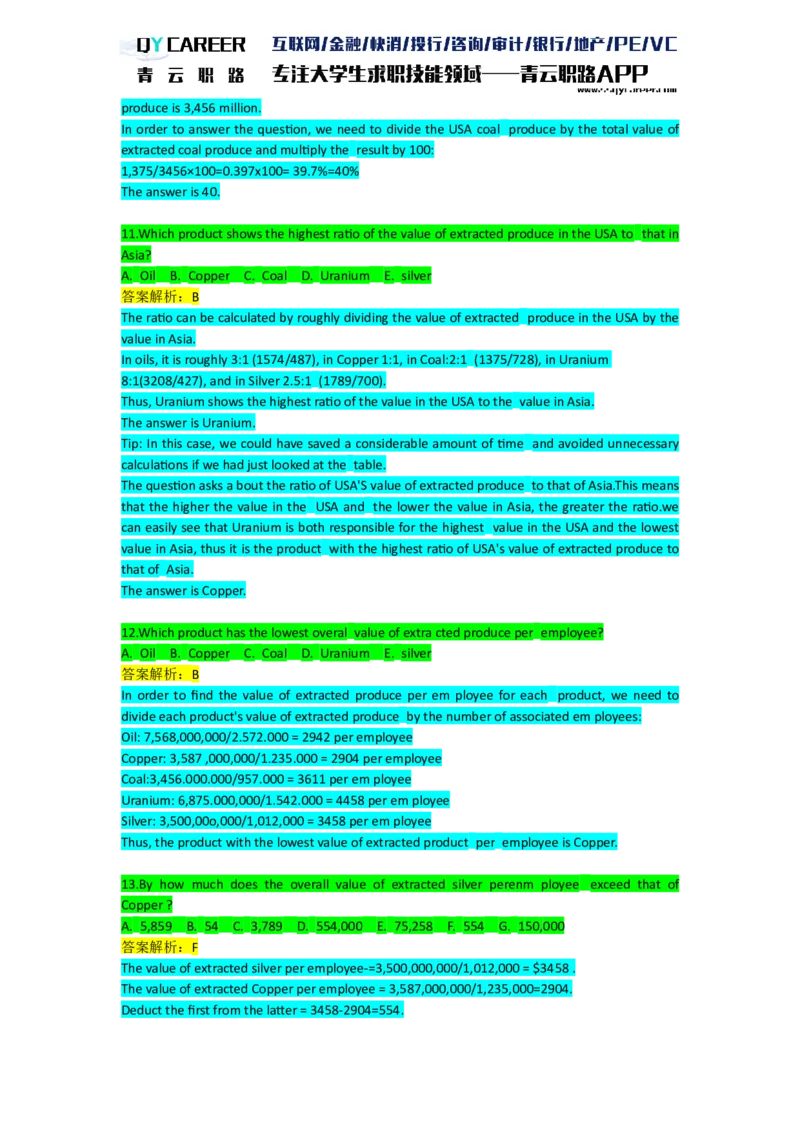
year 2007 which is the correct answer, answer choice (d).
2.Which company had the greatest change in number of contracts signed with the
government throughout the years?
A. Buildingo B. Horizon C. Infrastrucstar D. Rainbow
答案解析:A
Since the question asks about the greatest change throughout all years we should only
look at the first and last years stated in the graph and compare the relative change
between them. By mere observation we can see that among the three companies
represented by the purple, green and
blue lines, the blue line, namely Buildingo showed the greatest change between 2004 and
2010.
We should now determine whether this change was more significant than the change
represented bv the areen line for the Infrastrucstar company which also seems to
represent a sianificant change. The change for the Infrastrucstar company was 29
(number of contracts in 2010)-18
(number of contacts in 2004) = 11. The change for the Buildingo company was 15-2= 13.
The latter change, that seen for Buildingo, was more significant and therefore the correct
answer is (a).
3.For which of the following time periods was the change in number of contracts biggestfor Buildingo ( compared to the other companies)?
A. 2004 to 2007 B. 2008 to 2009 C. 2008 to 2010 D. 2007 to 2009 E. 2009 to 2010
答案解析:A
To solve this question, we should check which time period (from the answer choices) the
change in the number of Buildingo's contracts was the most significant compared with
other changes in that period. Below we will present our reasoning for each period
separately:
* Answer choice (a)- Between 2004 and 2007, the greatest change undoubtedly was that
seen for Buildingo. Among the three companies that started with two contracts in 2004,
Buildingo's
number of contracts increased the most by 2007. Now, comparing with the change seen
throughout this period for Infrastrucstar, we can note that while the Buildingo line crossed
more than five lines in its ascent, the Infrastrucstar crossed only two. Consequently, we
can conclude that for this period the overall change was mostly accounted for by the
change in contracts with Buildingo. We should mark this answer, but we must still
examine the other answer choices to see whether in any other time periods Buildingo's
change was even more significant in relation to the overall change.
* Answer choice (b) - Between 2008 and 2009, the change seen for Buildingo was less
than that seen for other companies.
* Answer choice (c) - Between 2008 and 2010, the most significant change was
undoubtedly that of Infrastrucstar, as can be concluded from mere observation.
* Answer choice (d)- Between 2007 and 2009, again the most significant change was not
that of Buildingo but of Infrastrucstar.
* Answer choice (e)- In this time period, the greatest change in number of contracts was
for Infrastructstar.
* Having examined all answer choices, we arrive at the conclusion that the correct
answer is answer choice (a).
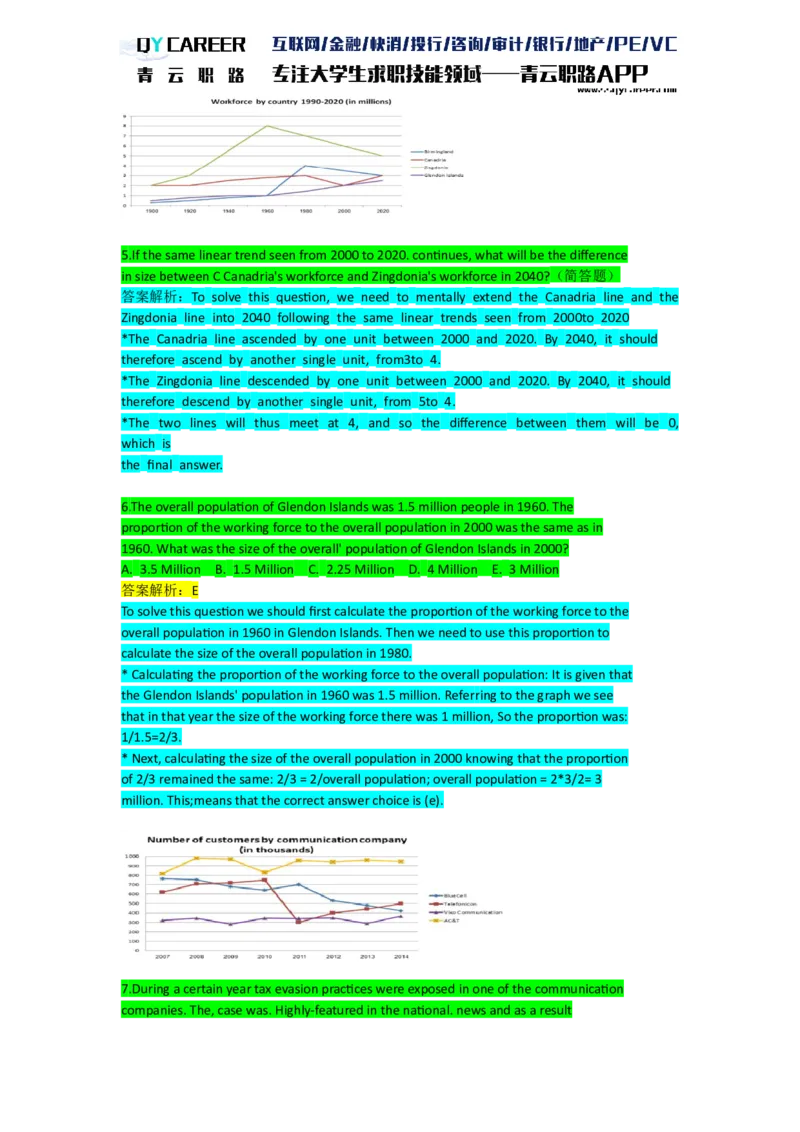
4.In which country is the proportion of the working force to the overall population the largest?
A. Glendon B. Birmingland C. Zingdonia D. Canadria Islands E. Not possible to tell
答案解析:E
In theory, to calculate the proportion of the working force to the overall population in each
county we would need to divide the number representing the workforce in the country by
the number representing the overall population in the same country. The question tries to
trick you into referring to the graph and pick the county with the highest line as the correct
answer. This is wrong as it is not equivalent to the proportions that the question asks
about. Since We don't know what the overall
populations in each county are, we cannot infer the discussed proportions. The correct
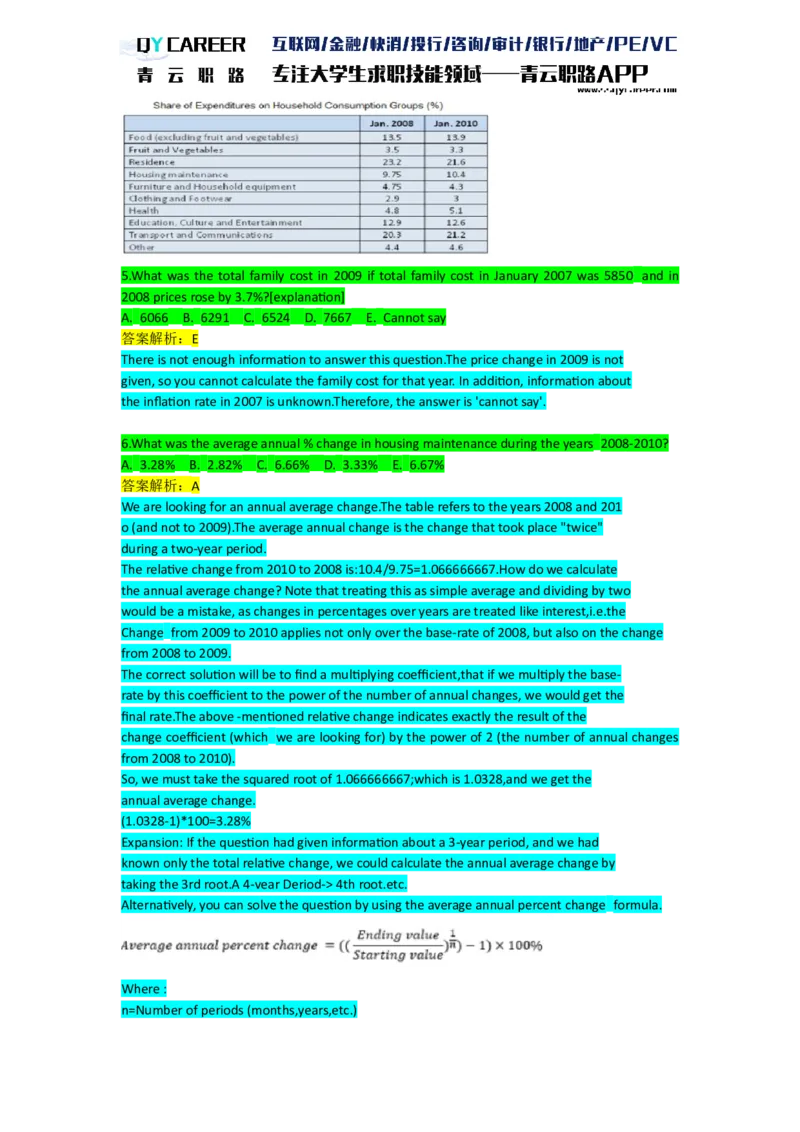
answer choice is therefore (e).5.If the same linear trend seen from 2000 to 2020. continues, what will be the difference
in size between C Canadria's workforce and Zingdonia's workforce in 2040?(简答题)
答案解析:To solve this question, we need to mentally extend the Canadria line and the
Zingdonia line into 2040 following the same linear trends seen from 2000to 2020
*The Canadria line ascended by one unit between 2000 and 2020. By 2040, it should
therefore ascend by another single unit, from3to 4.
*The Zingdonia line descended by one unit between 2000 and 2020. By 2040, it should
therefore descend by another single unit, from 5to 4.
*The two lines will thus meet at 4, and so the difference between them will be 0,
which is
the final answer.
6.The overall population of Glendon Islands was 1.5 million people in 1960. The
proportion of the working force to the overall population in 2000 was the same as in
1960. What was the size of the overall' population of Glendon Islands in 2000?
A. 3.5 Million B. 1.5 Million C. 2.25 Million D. 4 Million E. 3 Million
答案解析:E
To solve this question we should first calculate the proportion of the working force to the
overall population in 1960 in Glendon Islands. Then we need to use this proportion to
calculate the size of the overall population in 1980.
* Calculating the proportion of the working force to the overall population: It is given that
the Glendon Islands' population in 1960 was 1.5 million. Referring to the graph we see
that in that year the size of the working force there was 1 million, So the proportion was:
1/1.5=2/3.
* Next, calculating the size of the overall population in 2000 knowing that the proportion
of 2/3 remained the same: 2/3 = 2/overall population; overall population = 2*3/2= 3
million. This;means that the correct answer choice is (e).
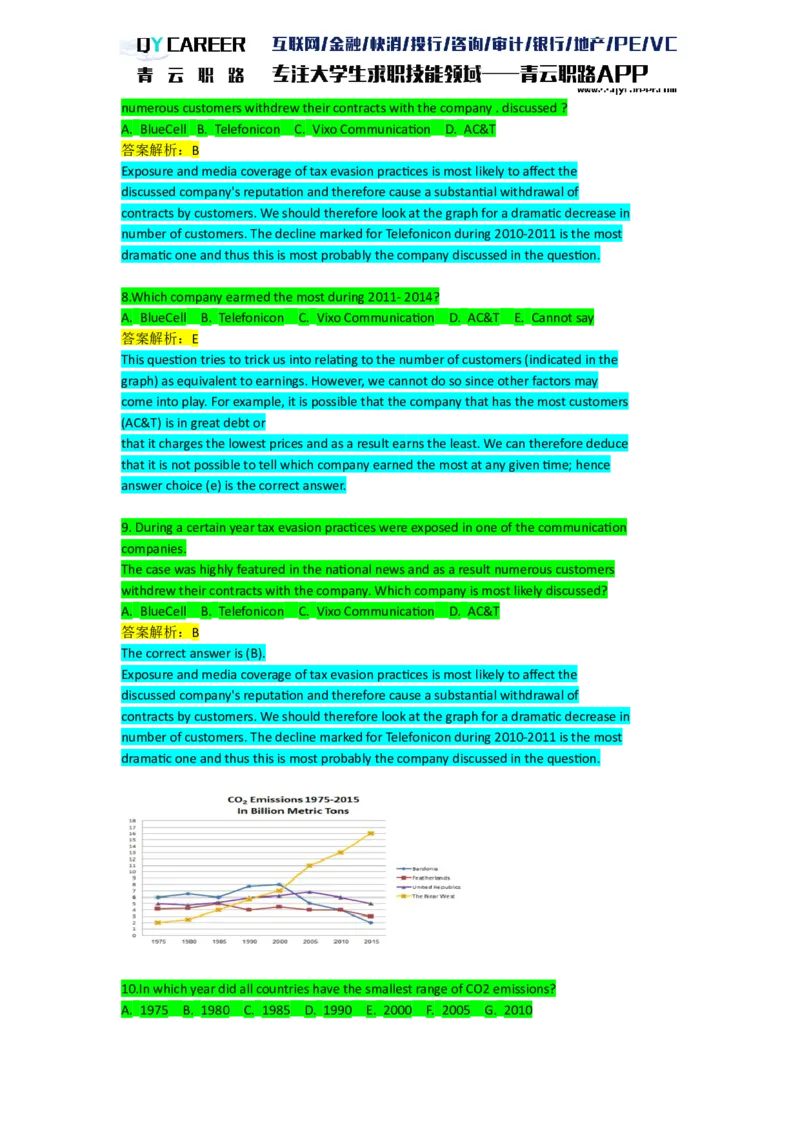
7.During a certain year tax evasion practices were exposed in one of the communication
companies. The, case was. Highly-featured in the national. news and as a resultnumerous customers withdrew their contracts with the company . discussed ?
A. BlueCell B. Telefonicon C. Vixo Communication D. AC&T
答案解析:B
Exposure and media coverage of tax evasion practices is most likely to affect the
discussed company's reputation and therefore cause a substantial withdrawal of
contracts by customers. We should therefore look at the graph for a dramatic decrease in
number of customers. The decline marked for Telefonicon during 2010-2011 is the most
dramatic one and thus this is most probably the company discussed in the question.
8.Which company earmed the most during 2011- 2014?
A. BlueCell B. Telefonicon C. Vixo Communication D. AC&T E. Cannot say
答案解析:E
This question tries to trick us into relating to the number of customers (indicated in the
graph) as equivalent to earnings. However, we cannot do so since other factors may
come into play. For example, it is possible that the company that has the most customers
(AC&T) is in great debt or
that it charges the lowest prices and as a result earns the least. We can therefore deduce
that it is not possible to tell which company earned the most at any given time; hence
answer choice (e) is the correct answer.
9. During a certain year tax evasion practices were exposed in one of the communication
companies.
The case was highly featured in the national news and as a result numerous customers
withdrew their contracts with the company. Which company is most likely discussed?
A. BlueCell B. Telefonicon C. Vixo Communication D. AC&T
答案解析:B
The correct answer is (B).
Exposure and media coverage of tax evasion practices is most likely to affect the
discussed company's reputation and therefore cause a substantial withdrawal of
contracts by customers. We should therefore look at the graph for a dramatic decrease in
number of customers. The decline marked for Telefonicon during 2010-2011 is the most
dramatic one and thus this is most probably the company discussed in the question.
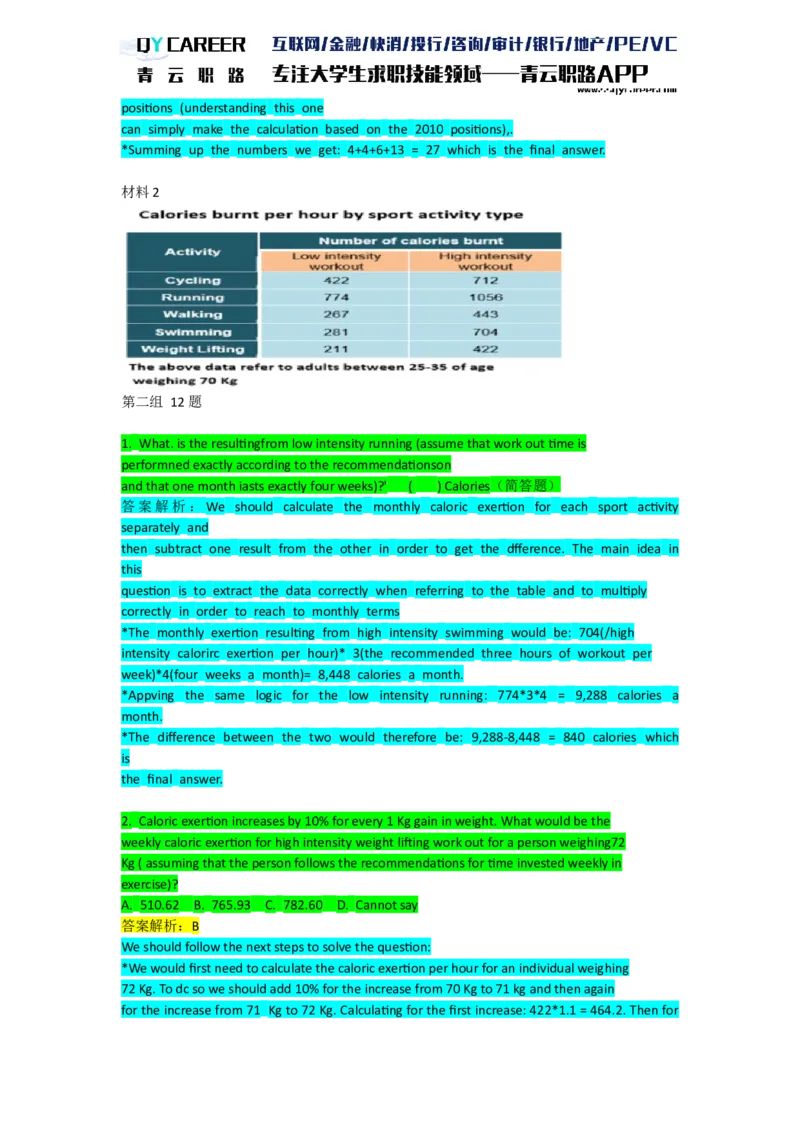
10.In which year did all countries have the smallest range of CO2 emissions?
A. 1975 B. 1980 C. 1985 D. 1990 E. 2000 F. 2005 G. 2010答案解析:C
To find out when all countries had the smallest range of emissions we should look in the
graph for a point where the points representing the countries emissions were nearest to
each other (vertically). There is in fact no need to take into account any numbers or to
make any calculations.
This point in time was 1985 and therefore the correct answer choice is (c).
11.which of the following relates to the smallest absolute change in CO2 emissions?
A. [img=http://jobtiku-1256670704.cos. ap-
beiing.myqcloud.com/qb/341588228488.png(300112)]
B. [img=http://jobtiku-1256670704.cos.
ap-beijing.myqcloud .com/qb/341588228492.png(308130)]
C. [img=http://jobtiku-1256670704.cos. ap-beiing.myqcloud.
com/qb/341588228495.png(317111)]
D. [img=http://jobtiku-1256670704.cos.
ap-beijing.myqcloud .com/qb/341588228497.png(294126)]
答案解析:C
To solve this question we should refer to the graph and check the difference in emissions
between the two years mentioned in each answer choice separately. Then we should
compare our results and choose the one representing the smallest change.
* For answer choice (a)一Bardonia: In 2000 the graph reads 2 and in 1985 it reads 6. The
change was therefore 2-6= -4. However note that the question asks about absolute ()
change, so for this question that would be 4. Following the same logic for the next
answer choices:
*Answer choice (b)- The Near West: 16-7= 9
* Answer choice (c) - Featherlands: 4-4= 0
*. Answer choice (d)- United Republics: 8-2= 6
* Comparing the results we see that answer choice (c) relates to the smallest change in
emissions and is the correct answer. Note that the full calculations were made here for
explanatory purposes. It is advised to solve this kind of question merely by observing the
lines in the graph (noting that the Fetherlands line in the indicated time period increases
and then decreases back to the same height and therefore represents no change in
emissions).
12.If changes in emissions between 2015 and 2020 are the opposite. to the changes
seen between 2010 to 2015 maintaining. absolute degree of change), what will be the
total amount of emissions in 2020 for the four countries combined?
( ) Billion Metric Tons(简答题)
答案解析:To solve this question we should first mentally extend the lines to 2020 as
instructed;
maintaining absolute changes in opposite directions,
*These would be the dfrent line positions in 2020: Bardonia = 4, Featherands = 4;
United
Republics = 6 and The Near West = 13. AS we can see all lines return to their 2010positions (understanding this one
can simply make the calculation based on the 2010 positions),.
*Summing up the numbers we get: 4+4+6+13 = 27 which is the final answer.
材料2
第二组 12题
1. What. is the resultingfrom low intensity running (assume that work out time is
performned exactly according to the recommendationson
and that one month iasts exactly four weeks)?' ( ) Calories(简答题)
答案解析:We should calculate the monthly caloric exertion for each sport activity
separately and
then subtract one result from the other in order to get the dfference. The main idea in
this
question is to extract the data correctly when referring to the table and to multiply
correctly in order to reach to monthly terms
*The monthly exertion resulting from high intensity swimming would be: 704(/high
intensity calorirc exertion per hour)* 3(the recommended three hours of workout per
week)*4(four weeks a month)= 8,448 calories a month.
*Appving the same logic for the low intensity running: 774*3*4 = 9,288 calories a
month.
*The difference between the two would therefore be: 9,288-8,448 = 840 calories which
is
the final answer.
2. Caloric exertion increases by 10% for every 1 Kg gain in weight. What would be the
weekly caloric exertion for high intensity weight lifting work out for a person weighing72
Kg ( assuming that the person follows the recommendations for time invested weekly in
exercise)?
A. 510.62 B. 765.93 C. 782.60 D. Cannot say
答案解析:B
We should follow the next steps to solve the question:
*We would first need to calculate the caloric exertion per hour for an individual weighing
72 Kg. To dc so we should add 10% for the increase from 70 Kg to 71 kg and then again
for the increase from 71 Kg to 72 Kg. Calculating for the first increase: 422*1.1 = 464.2. Then forthe second increase:464.2*1.1 = 510.62 calories per hour.
* Now we should use the result to calculate for a weekly caloric exertion: 510.62*1 .5(a
hour and a half weeklv exercise time) = 765.93 calories a week: the final an swer.
3.Which of the following activities, performed in high intensity at half the recommended
weekly time, will engender the lowest caloric exertion?
A. Cycling B. Running C. Walking D. Swimming
答案解析:B
To solve this question we need to calculate the caloric exertion for each of the four
activities stated in the answer choices, assuming workout at high intensity and half the
recommended weekly workout time. Then we'll need to pick the lowest number.
★Cycling: 712(caloric exertion in high intensity per hour)* 2(recommended workout time
for this activity)*0.5(half the time) = 712 calories a week
* Running: 1056*1*0.5 = 528 calories a week
*Walking: 443*3*0.5 = 664.5 calories a week
* Swimming: 704*3*0.5 = 1,056 calories a week
*As we can see running in high intensity for half the recommended weekly time will
engender the least caloric exertion. Thus, the correct answer choice is(b) .
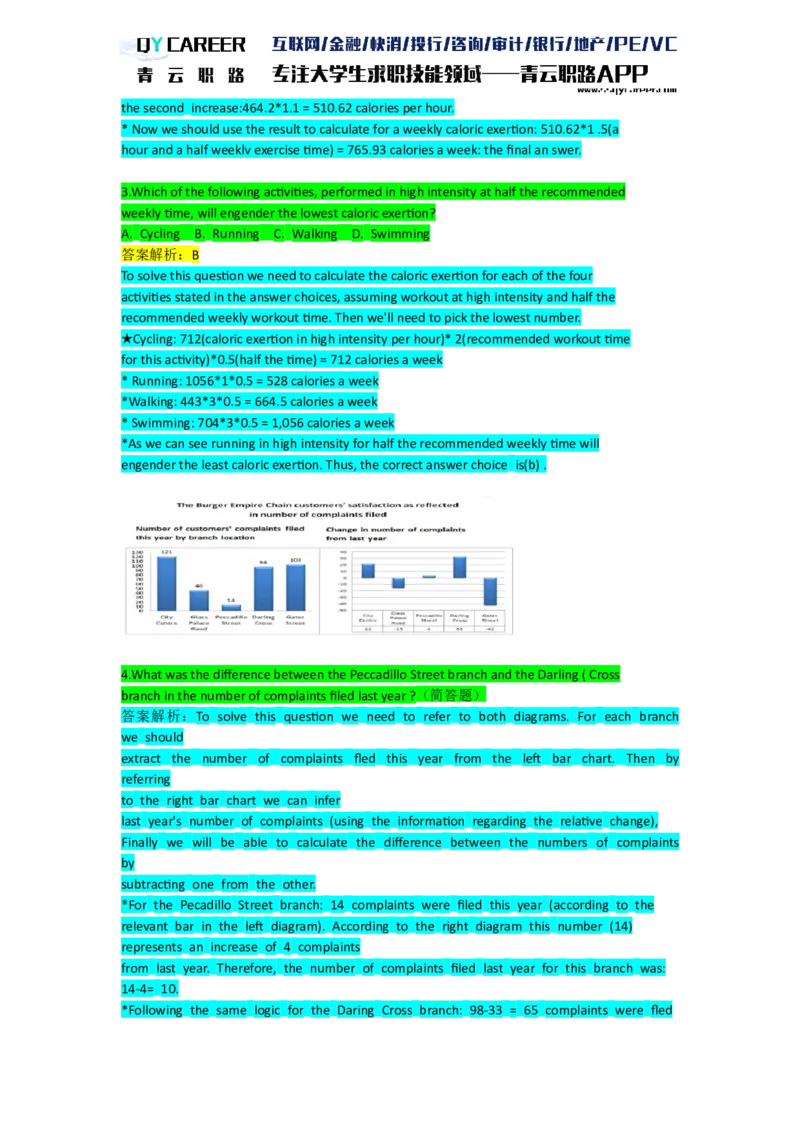
4.What was the difference between the Peccadillo Street branch and the Darling ( Cross
branch in the number of complaints filed last year ?(简答题)
答案解析:To solve this question we need to refer to both diagrams. For each branch
we should
extract the number of complaints fled this year from the left bar chart. Then by
referring
to the right bar chart we can infer
last year's number of complaints (using the information regarding the relative change),
Finally we will be able to calculate the difference between the numbers of complaints
by
subtracting one from the other.
*For the Pecadillo Street branch: 14 complaints were filed this year (according to the
relevant bar in the left diagram). According to the right diagram this number (14)
represents an increase of 4 complaints
from last year. Therefore, the number of complaints filed last year for this branch was:
14-4= 10.
*Following the same logic for the Daring Cross branch: 98-33 = 65 complaints were fledlast year.
*Calculatina the difference bv subtractina one result from the other: 65-10 = 55 (the
final
answer)
5.Which branch demonstrated the greatest degree of relative improvement?
A. City Centre B. Glass Palace road C. Peccadillo D. Darling Cross E. Gater Street
答案解析:E
In figuring out relative improvement we should only take into account relative changes
from last year and not the absolute number of complaints. We should therefore focus
solely on the right diagram. Note that improvement will in fact be denoted by a negative
number in the right diagram
(indicating that this year's number of complaints was less than that of last year). Keeping
that in mind we can straight away rule out all the branches showing positive numbers. We
remain with the Glass Palace Road branch and the Gater Street branch to choose from.
The Gater Street branch column shows a reduction of -42 complaints from last year. This
means that the number of complaints last year was 103+42 = 145 and that the relative
Improvement was of 42/145= 0.28 or 28%。
The Glass Palace Road branch reduction was -15. The number of complaints last year
was 46+15= 61 and the relative improvement was of 15/61 = 0.24 or 24%. It follows that the
branch that showed the greatest improvement was Gater Street Branch which means that
answer choice (e) is the correct one.
6.Three years ago the average number of complaints per branch was 84 complaints.
What percentage is the total number of complaints filed last year from that of three years
ago? Please give your answer to one' decimal point (and do not round your answer)(简答题)
答案解析:To solve this question we need to divide the total number of complaints filed last year
by the total number of complaints filed three years ago. Both these numbers are not diretly
given to us, so we need to calculate them, as flows.
*Calculating for three years ago: the average number of complaints per branch was 84.
From the average formula we know that average-sum of items/number of items. Placing
our numbers in the formula:
84 = sum of complaints/ 5(number of branches)
Cross multiplying we arrive at: sum of complaints three years ago= 84*5 =420.*Calculating for
last year's number of complaints: We should first find the number of complaints filed for each
branch by extracting the number of complaints filed this year from the left diagram and adding
or subtracting the change as indicated in the right diagram. For instance, last years number of
complaints for Pecadillo Street branch would be 14(this year's number of complaints)-4 (minus
four since this year's number indicates an increase(!) from last year)= 10 complaints last year.
Following this reasoning the total number of complaints filed last year was: (121-
22)+(46+15+(14-4)+(98-33)+(103+42)=380.
*Finally, remember that we were asked to find out the percentage of the total number of
complaints filed last year out of that of three years ago. Our calculation should therefore
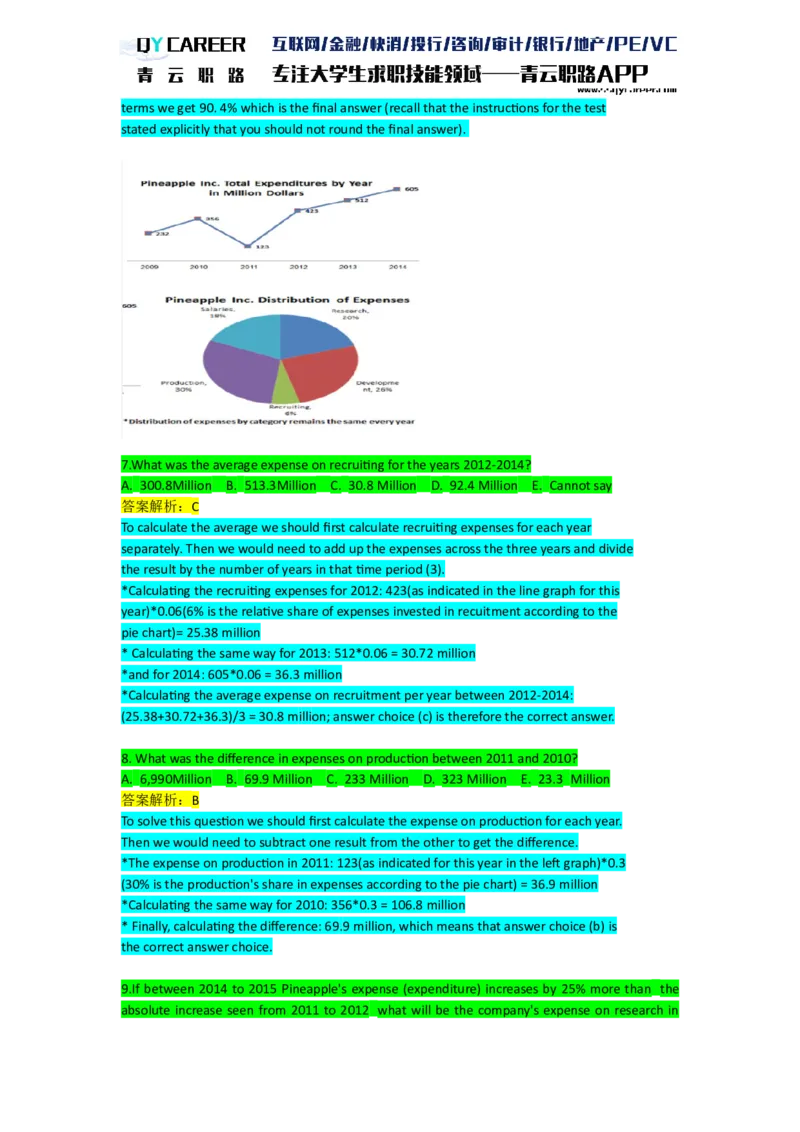
be as fllws: 380/420 = 0.9047. Finally remembering to convert our result to percentageterms we get 90. 4% which is the final answer (recall that the instructions for the test
stated explicitly that you should not round the final answer).
7.What was the average expense on recruiting for the years 2012-2014?
A. 300.8Million B. 513.3Million C. 30.8 Million D. 92.4 Million E. Cannot say
答案解析:C
To calculate the average we should first calculate recruiting expenses for each year
separately. Then we would need to add up the expenses across the three years and divide
the result by the number of years in that time period (3).
*Calculating the recruiting expenses for 2012: 423(as indicated in the line graph for this
year)*0.06(6% is the relative share of expenses invested in recuitment according to the
pie chart)= 25.38 million
* Calculating the same way for 2013: 512*0.06 = 30.72 million
*and for 2014: 605*0.06 = 36.3 million
*Calculating the average expense on recruitment per year between 2012-2014:
(25.38+30.72+36.3)/3 = 30.8 million; answer choice (c) is therefore the correct answer.
8. What was the difference in expenses on production between 2011 and 2010?
A. 6,990Million B. 69.9 Million C. 233 Million D. 323 Million E. 23.3 Million
答案解析:B
To solve this question we should first calculate the expense on production for each year.
Then we would need to subtract one result from the other to get the difference.
*The expense on production in 2011: 123(as indicated for this year in the left graph)*0.3
(30% is the production's share in expenses according to the pie chart) = 36.9 million
*Calculating the same way for 2010: 356*0.3 = 106.8 million
* Finally, calculating the difference: 69.9 million, which means that answer choice (b) is
the correct answer choice.
9.If between 2014 to 2015 Pineapple's expense (expenditure) increases by 25% more than the
absolute increase seen from 2011 to 2012 what will be the company's expense on research in2015?(简答题)
答案解析:To solve this question we need to fllowl the next steps.
*First we would need to determine what the absolute inrease from 2011 to 2012 was.
Refering to the line graph we can see it would be 423-123 = 300 million.
*It is stated that the increase from 2014 to 2015 would be 25% more than that seen
between 2011 and 2012. Therefore, the 201 5 total expense would be: 605(the 2014
expense)+[300 (the prospective increase as we calculated)*1.25(a 25% inrease)] = 980 million.
*Since the question asks speifcallyl about the expense on research in 2015 s0 we should clculate
this rfering to the relevant share of research idicated in the pie chart: 980*0.2(20%) = 196 million
USD which is the final answer.
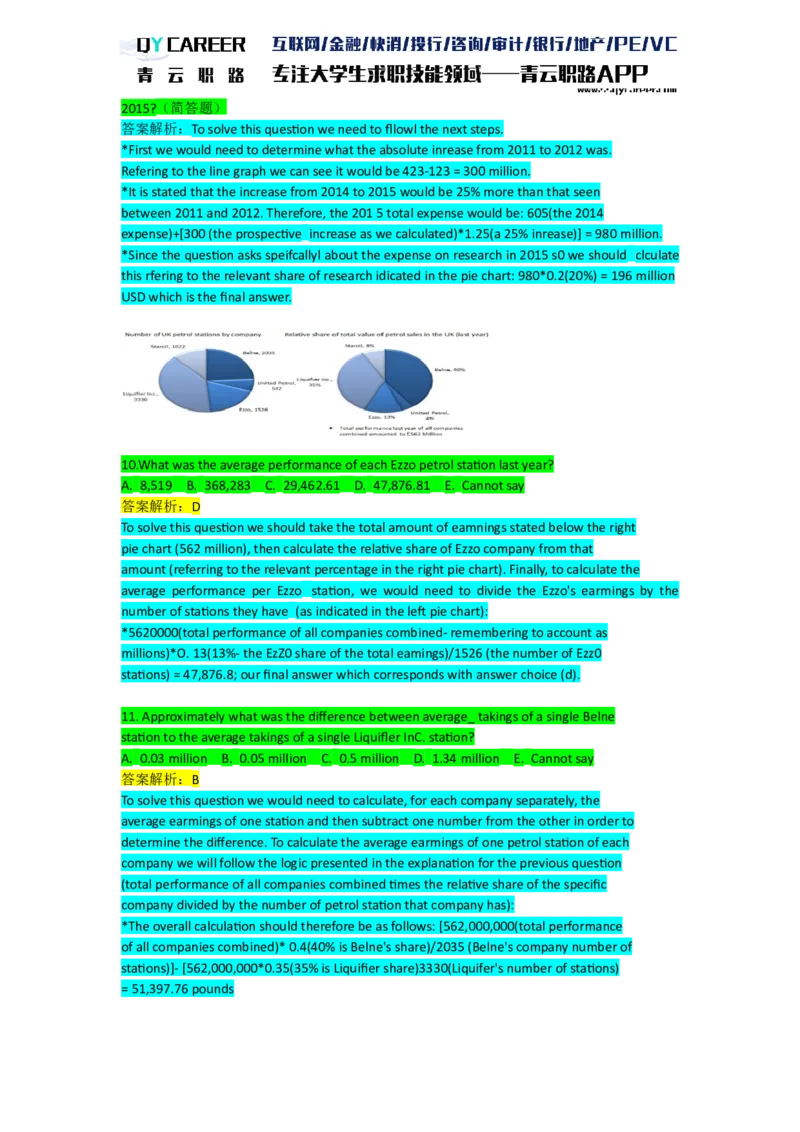
10.What was the average performance of each Ezzo petrol station last year?
A. 8,519 B. 368,283 C. 29,462.61 D. 47,876.81 E. Cannot say
答案解析:D
To solve this question we should take the total amount of eamnings stated below the right
pie chart (562 million), then calculate the relative share of Ezzo company from that
amount (referring to the relevant percentage in the right pie chart). Finally, to calculate the
average performance per Ezzo station, we would need to divide the Ezzo's earmings by the
number of stations they have (as indicated in the left pie chart):
*5620000(total performance of all companies combined- remembering to account as
millions)*O. 13(13%- the EzZ0 share of the total eamings)/1526 (the number of Ezz0
stations) = 47,876.8; our final answer which corresponds with answer choice (d).
11. Approximately what was the difference between average_ takings of a single Belne
station to the average takings of a single Liquifler InC. station?
A. 0.03 million B. 0.05 million C. 0.5 million D. 1.34 million E. Cannot say
答案解析:B
To solve this question we would need to calculate, for each company separately, the
average earmings of one station and then subtract one number from the other in order to
determine the difference. To calculate the average earmings of one petrol station of each
company we will follow the logic presented in the explanation for the previous question
(total performance of all companies combined times the relative share of the specific
company divided by the number of petrol station that company has):
*The overall calculation should therefore be as follows: [562,000,000(total performance
of all companies combined)* 0.4(40% is Belne's share)/2035 (Belne's company number of
stations)]- [562,000,000*0.35(35% is Liquifier share)3330(Liquifer's number of stations)
= 51,397.76 pounds12.The year. before last, Staroil reported earnings of £43.5 million. By what percentage
have they, grown over the last year? Please give your answer to one decimal point (do not
round numbers in your calculations and in your final answer)(简答题)
答案解析:In order to solve this question we would frt need to clculate Sroils eamings
last year, Then we would need to caculate the prentage icrese from the year before
last,
*Clculating Srols earings this year we flol the same lgic as in the two pewious questions
(see exlanations to these qustions); 5.,000*0.08 = 4.90,00 or 4.96 million,
*Given that the year bfore lat Sarol made 43.5 in eanings we should caulate the
prentage inrese as flous (4464-5)43.5 = 033. Covertingto prcent tems 0.033= 3.3% and
this is our final answer.
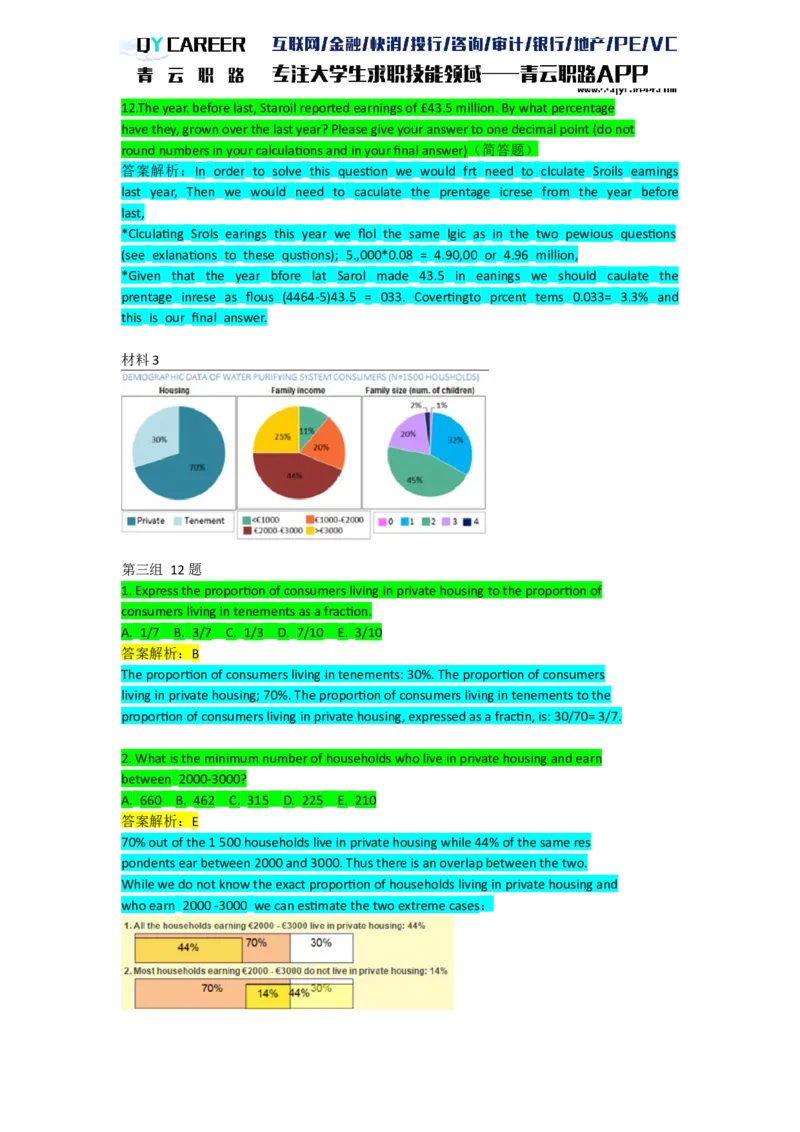
材料3
第三组 12题
1. Express the proportion of consumers living in private housing to the proportion of
consumers living in tenements as a fraction.
A. 1/7 B. 3/7 C. 1/3 D. 7/10 E. 3/10
答案解析:B
The proportion of consumers living in tenements: 30%. The proportion of consumers
living in private housing; 70%. The proportion of consumers living in tenements to the
proportion of consumers living in private housing, expressed as a fractin, is: 30/70= 3/7.
2. What is the minimum number of households who live in private housing and earn
between 2000-3000?
A. 660 B. 462 C. 315 D. 225 E. 210
答案解析:E
70% out of the 1 500 households live in private housing while 44% of the same res
pondents ear between 2000 and 3000. Thus there is an overlap between the two.
While we do not know the exact proportion of households living in private housing and
who earn 2000 -3000 we can estimate the two extreme cases:The question asks us about the second option.14% of 1500 equals 210.
Solving tip- In this type of question, we need to check what happens at the extreme points
In order to determine the minimal I maximal values. This method works as well for,questions
that ask about the range of possibilities (i.e. minimum-maximum).
In this question, the minimal value is when the least number of private households that also
have an income of 2,000 3,000. For this to happen, we need to assert what is the Maximal
number of households that aren't private and may also belong to this income category.
The trick is to use the smallest number (the "restricting element") of either the number of non-
private houses, or the income category as the maximal value. Since we only have 30%
tenements, we are left with: 44%-30% = 14% which falls under the relevant income
category.
The 14% remainder represents the number of households in the relevant income category
that are also residing in a private house. We know the total number of households is 1500
and therefore: 14%x 1500= 0.14x 1500= 210.
3. How many families have 3 children or less?
A. 300 B. 1170 C. 1470 D. 470 E. 710
答案解析:C
First we need to calculate the total percentage of families with 3 children or less and then
multiply by 1500. Rather than adding up all the data for families except those with 4
children, we can deduct the percentage of families with 4 children from 100% to arrive at
the same result: 100-2=98% of the families have less than 4 children. All that remains is to
find the actual number of families out of 1500: 1500*0.98 = 1470 families.
Alternatively, we could have calculated the number of families with 4 children out of 1500:
0.02* 1500 = 30 families, and then deducted that number from the total number of
respondents to arrive at the same result of 1470.
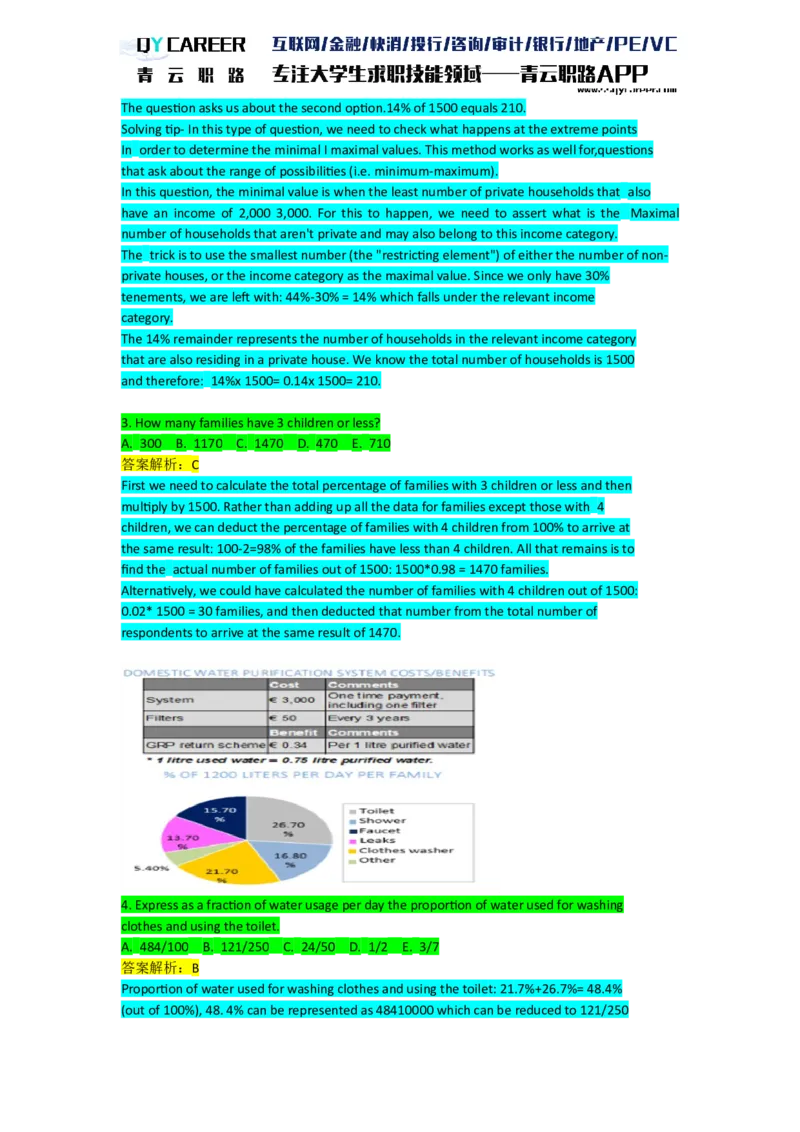
4. Express as a fraction of water usage per day the proportion of water used for washing
clothes and using the toilet.
A. 484/100 B. 121/250 C. 24/50 D. 1/2 E. 3/7
答案解析:B
Proportion of water used for washing clothes and using the toilet: 21.7%+26.7%= 48.4%
(out of 100%), 48. 4% can be represented as 48410000 which can be reduced to 121/250(usinga common denominator of4).
5. If a family produces 45 litres of purified water a day, what is the proportion of daily
water consumption reused by the family?
A. 60% B. 75% C. 28% D. 12% E. 5%
答案解析:E
We know from the table that for every 1 litre of used water, one can produce 0.75 litres of
purified water. So, if a family produces 45 litres of purified water, it actually reuses
45/0.75=60 litres of used water. 60 litres out of the daily 1200 litres equals 5%.
6. How many days will it take for a family to "break even" on the initial expense of
installing a water purification system, if that family reuses 10% of its daily water use?
A. 74 B. 98 C. 73 D. 99 E. 100
答案解析:D
According to the chart a family uses/consumes 1200 liters of water per day.10% of 1200
equals 1 20 liters of water to be reused. We know from the table that 1 liter of used water
equals 0.75 liters of purifed water. Thus, the family can actually reuse 75% out of the 120
used liters of water, which equals 90 liters per day.
According to the table, for every liter of purfied water you receive a GRP return of 0.34.
Thus, the daily GRP return on 90 liters of purified water per day is: 0.34*90= E30.6.
We know that a family spends E3000 on the purifying system, so we can build an equation
with time (in days) as the missing factor (X) and find out how many days will it take for the
family to break even on its initial expense: E3000 = e30.6* X→X= 98.04 days. The correct
answer is 99 days.
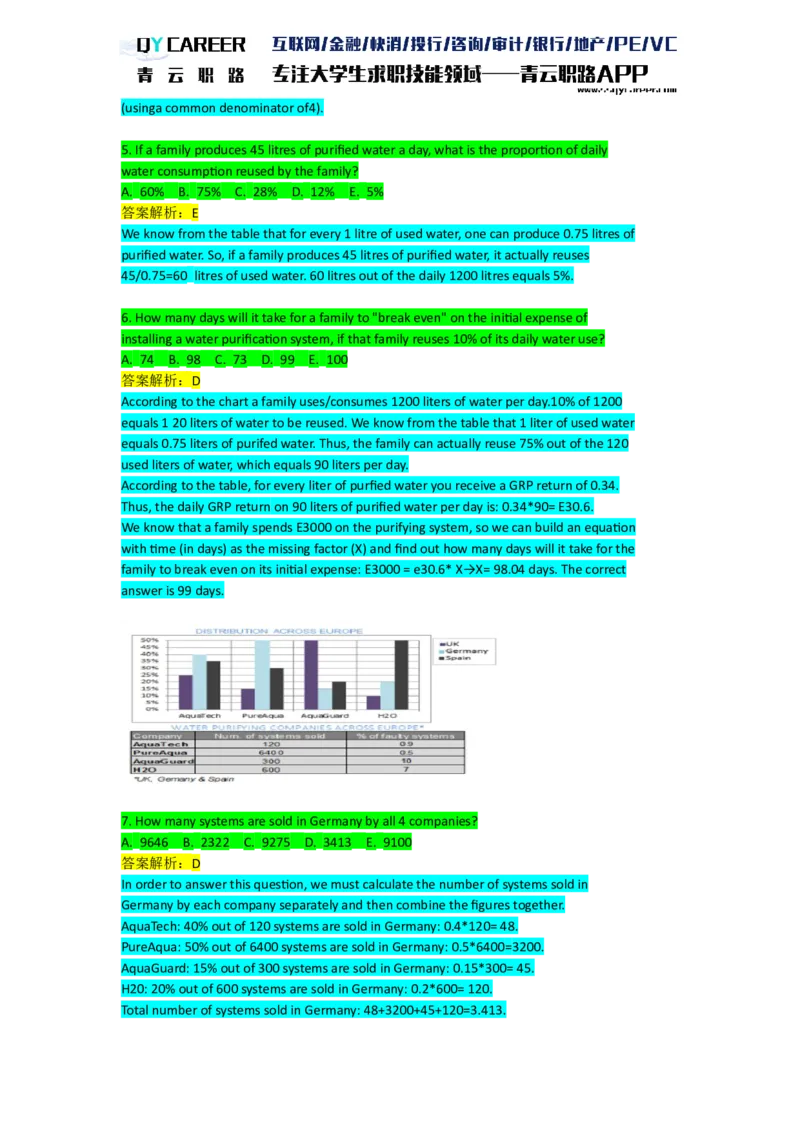
7. How many systems are sold in Germany by all 4 companies?
A. 9646 B. 2322 C. 9275 D. 3413 E. 9100
答案解析:D
In order to answer this question, we must calculate the number of systems sold in
Germany by each company separately and then combine the figures together.
AquaTech: 40% out of 120 systems are sold in Germany: 0.4*120= 48.
PureAqua: 50% out of 6400 systems are sold in Germany: 0.5*6400=3200.
AquaGuard: 15% out of 300 systems are sold in Germany: 0.15*300= 45.
H20: 20% out of 600 systems are sold in Germany: 0.2*600= 120.
Total number of systems sold in Germany: 48+3200+45+120=3.413.8. What is the ratio of functional AquaGuard systems to functional H20 systems in Spain?
A.1:32 B. 6:31 C. 4:37 D. 2:33 E.7:32
答案解析:B
Number of AquaGuard systems sold in Spain: 20% of 300= 60.
Out of 60 systems, 10% are faulty. this means that 6 systems are faulty.
Thus we are left with 54 functional AquaGuard systems. Number of H20 systems sold in
Spain: 50% of 600 = 300.
Out of 300 systems, 7% are faulty: this means that 21 systems are faulty.
Thus we are left with 279 functional PureAqua systems.
The correct ratio is: 54:279.
Reduced by a common denominator of9 to: 6:31.
9. What is the highest number of faulty systems among the companies?
A. 42 B. 32 C. 3,200 D. 108 E. 7
答案解析:A
The question basically asks us to calculate the number of faulty systems out of the total
number of systems for each company. However, we can save time by using estimations
in order to eliminate some answers.
Both AquaGuard and Aqua Tech have low sales numbers as well as low proportions of
faulty systems. Thus, they can be eliminated. Now we are left to calculate the remaining
two companies:
PureAqua: 0.5% out of 6400 = 32 (note that 0.5 is not 5%!).
H20: 7% out of 600= 42.
Thus, the correct answer is 42.
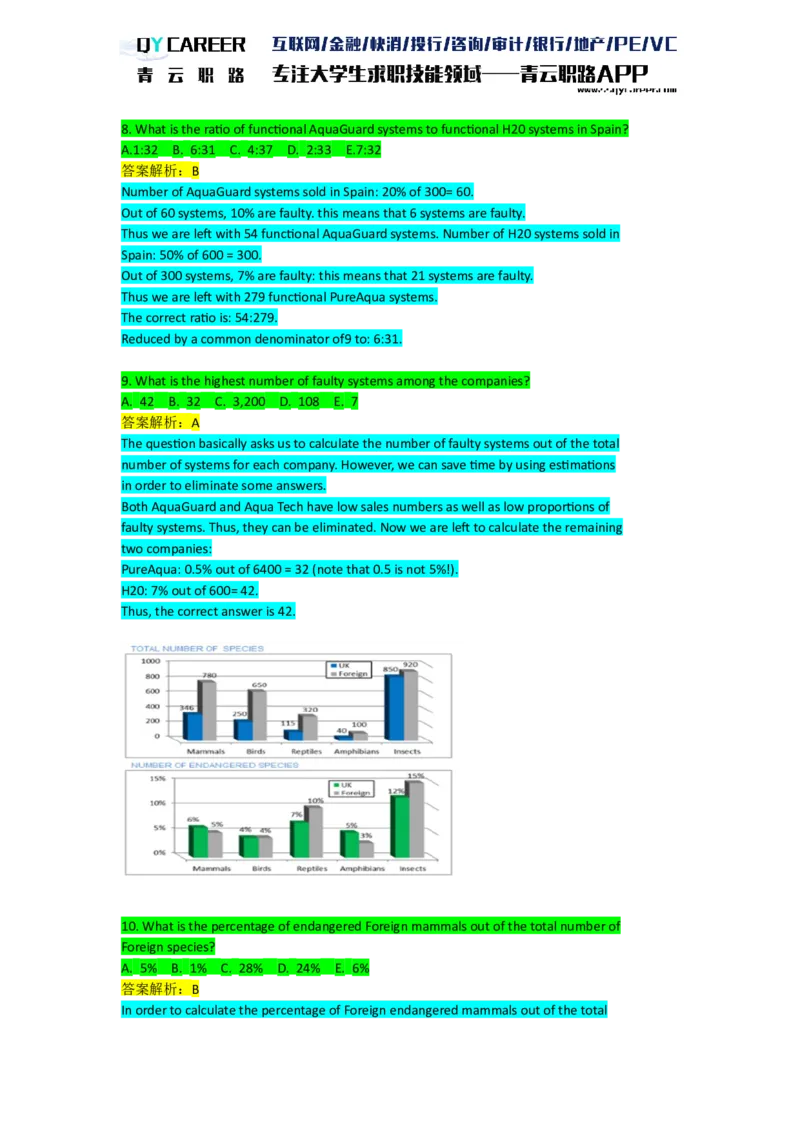
10. What is the percentage of endangered Foreign mammals out of the total number of
Foreign species?
A. 5% B. 1% C. 28% D. 24% E. 6%
答案解析:B
In order to calculate the percentage of Foreign endangered mammals out of the totalnumber of Foreign species we first have to calculate the number of endangered Foreign
mammals:
0.05*780-39. Now we must divide this number by the total number of Foreign species:
39/(780+650+320+100+920)= 0.014=1%
11. What is the ratio of the difference between Foreign and UK endangered Amphibians to
Foreign and UK endangered Insects?
A. 1:48 B. 1:16 C. 1:43 D. 2:3 E. 1:36
答案解析:E
Foreign Amphibian species that are endangered: 0.03*100= 3.
UK Amphibian species that are endangered: 0.05*40=2.
The difference between Foreign and UK endangered Amphibians: 3-2=1.
Foreign Insect species that are endangered: 0.15*920= 138.
UK Insect species that are endangered: 0.12*850=102.
The difference between Foreign and UK endangered Insects: 138- 102=36.
The ratio of the difference between Foreign and UK endangered Amphibians to Foreign
and UK endangered Insects is: 1:36.
12. If 8 already known species of Foreign reptiles became endangered and, as a result,
were added to the number of Foreign endangered reptiles, what would be the percentage
of Foreign endangered reptiles?
A. 12.4% B. 22.5% C. 22.4% D. 12.5% E. 35%
答案解析:D
In order to calculate the new percentage, we don't actually need to calculate the previous
number of Foreign endangered reptiles. All we need to do is calculate the new addition in
percentages and add this to the previous percentage: 8 new species out of 320 Foreign
reptile* species in total equals 8/320=0.025-2.5%
Now we must add this to the previous percentage to arrive at the correct answer: 10%
+2. 5%=12.5%.
* Please note 8 additional species have become endangered, however the total number
of reptile species remain the same as these are not new species.
材料4
第四组 12题
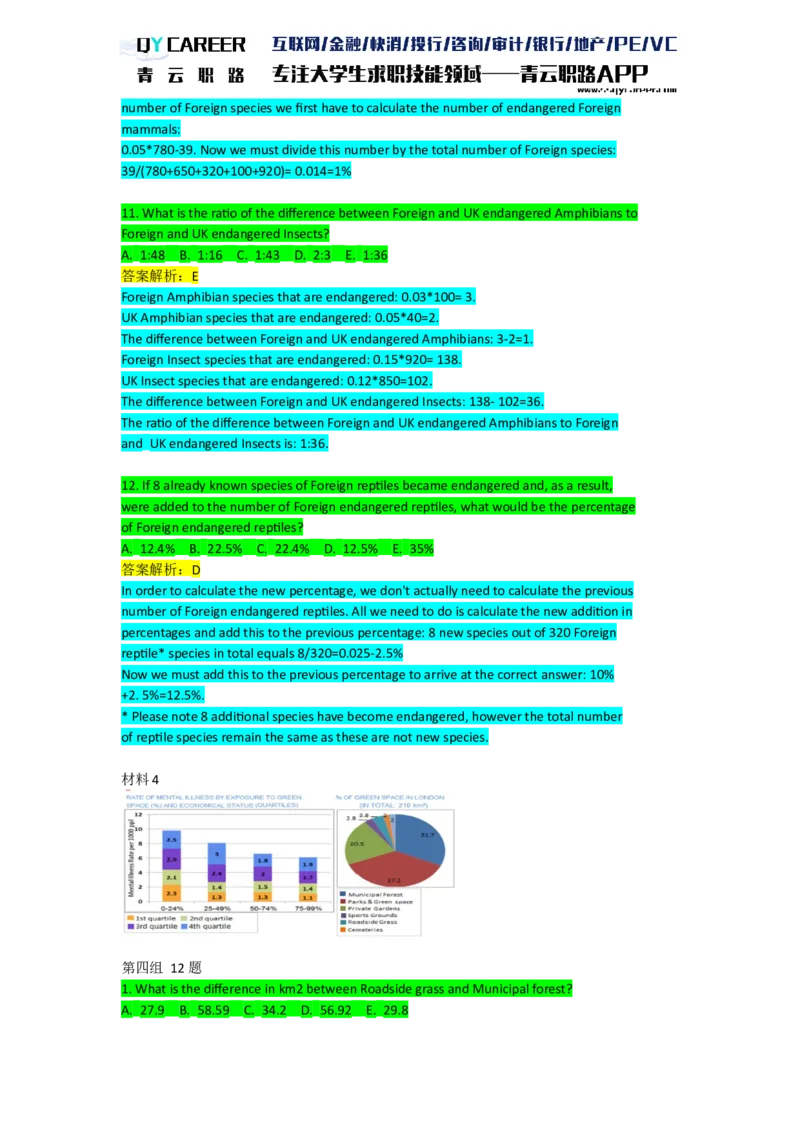
1. What is the difference in km2 between Roadside grass and Municipal forest?
A. 27.9 B. 58.59 C. 34.2 D. 56.92 E. 29.8答案解析:B
The size of land taken up by Roadside Grass: 0.038*210=7.98 km
The size of land taken up by Municipal Forest: 0.317*210=66.57 km
The difference between the two: 66. 57-7.98 = 58. 59 km
2. A family in the 1st quartile moved from a neighborhod with a total of 50 km2 of green
space to a neighborhod with a total of 55 km2 of green space. What is the difference in
mental ilness rates between the family's new neighborhod and its former neighborhod?
A. 1 B. 0 C. 0.2 D. 1.2 E. 2
答案解析:A
In order to answer this question we must estimate the extent of the family's exposure to
green space in percentages.
In the first neighbourhood, they were exposed to 50 out of 210 km2 of green space:
50/210-23.8%, situating them in the first category of 0-24%. The mental ilness rate of the
1st quartile in this category is 2.3.
In the second neighbourhood, they will be exposed to 55 out of 210 km2 of green space:
55/210=26.1% , situating them in the second category of 25.49%. The mental ilness rate
of the 1st quartile in this category is 1.3.
Thus, the difference in mental ilness rate is: 2.3-1.3=1.
3. One of the city's neighbourhoods enjoys exposure to three quarters of the municipal
forest and to 52km° of other green space. What is the difference in prevalence of mental
ilness between people in the 4th and 1st quartiles living in the neighbourhood?
A. 0.6 B. 1.7 C. 0.5 D. 1.1 E. 0.2
答案解析:B
The correct answer is 1.7
In order to answer this question we first need to find out the rate of exposure to green
space in the neighbourhood.
We are told that the neighbourhood is exposed to three quarters (75%) of the municipal
forest.
Since the municipal forest constitutes 31.7% of the green space in London, the
neighbourhood enjoys exposure to 31.7% * 0.75= 23.775% of the green space in the city.
In addition, the neighbourhood is exposed to another 52km° of green space, which
constitute 52/210 = 24.76% of the green space.
Therefore, the neighbourhood is exposed to a total of 23.775% + 24.76% = 48.535% of the
green space.
48. 535% falls under the 25 49% category. The mental ilness rate of the 4th quartile in this
category is 3 and the rate of the 1st quartile is 1.3.
Thus, the difference in preva lence of mental ilness between the two quartiles is
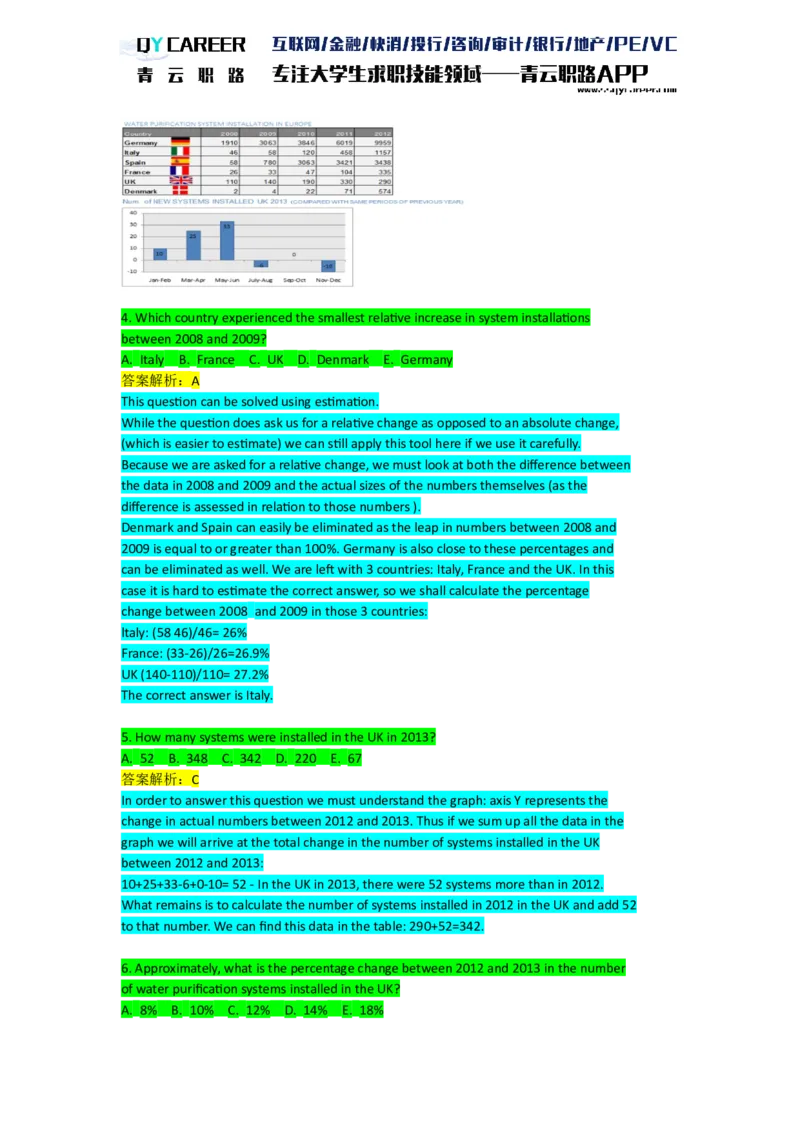
3-1.3=1.74. Which country experienced the smallest relative increase in system installations
between 2008 and 2009?
A. Italy B. France C. UK D. Denmark E. Germany
答案解析:A
This question can be solved using estimation.
While the question does ask us for a relative change as opposed to an absolute change,
(which is easier to estimate) we can still apply this tool here if we use it carefully.
Because we are asked for a relative change, we must look at both the difference between
the data in 2008 and 2009 and the actual sizes of the numbers themselves (as the
difference is assessed in relation to those numbers ).
Denmark and Spain can easily be eliminated as the leap in numbers between 2008 and
2009 is equal to or greater than 100%. Germany is also close to these percentages and
can be eliminated as well. We are left with 3 countries: Italy, France and the UK. In this
case it is hard to estimate the correct answer, so we shall calculate the percentage
change between 2008 and 2009 in those 3 countries:
ltaly: (58 46)/46= 26%
France: (33-26)/26=26.9%
UK (140-110)/110= 27.2%
The correct answer is Italy.
5. How many systems were installed in the UK in 2013?
A. 52 B. 348 C. 342 D. 220 E. 67
答案解析:C
In order to answer this question we must understand the graph: axis Y represents the
change in actual numbers between 2012 and 2013. Thus if we sum up all the data in the
graph we will arrive at the total change in the number of systems installed in the UK
between 2012 and 2013:
10+25+33-6+0-10= 52 - In the UK in 2013, there were 52 systems more than in 2012.
What remains is to calculate the number of systems installed in 2012 in the UK and add 52
to that number. We can find this data in the table: 290+52=342.
6. Approximately, what is the percentage change between 2012 and 2013 in the number
of water purification systems installed in the UK?
A. 8% B. 10% C. 12% D. 14% E. 18%答案解析:E
Since we have already summed up the total number of aditinal systems istalled in 2013,in
relation to 2012, we can use the resuit from the previous question in order to calculate the
answer to this question; 52.1/290*100=17.93~18%
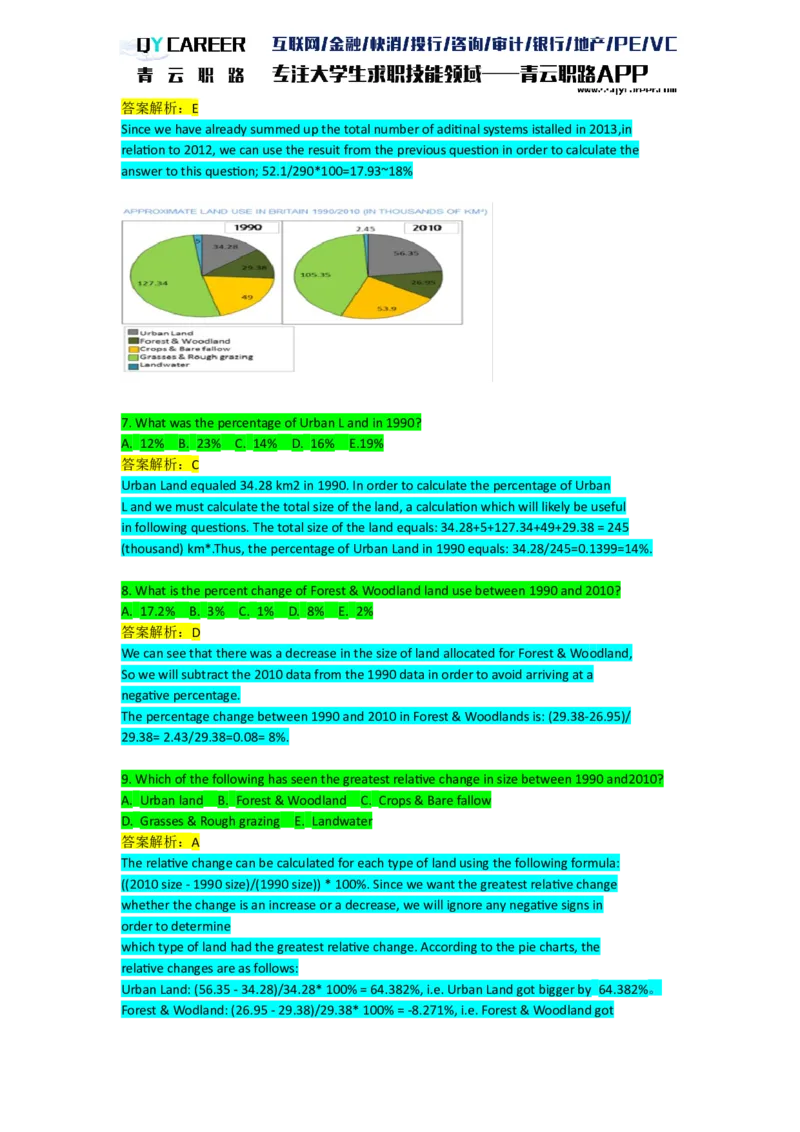
7. What was the percentage of Urban L and in 1990?
A. 12% B. 23% C. 14% D. 16% E.19%
答案解析:C
Urban Land equaled 34.28 km2 in 1990. In order to calculate the percentage of Urban
L and we must calculate the total size of the land, a calculation which will likely be useful
in following questions. The total size of the land equals: 34.28+5+127.34+49+29.38 = 245
(thousand) km*.Thus, the percentage of Urban Land in 1990 equals: 34.28/245=0.1399=14%.
8. What is the percent change of Forest & Woodland land use between 1990 and 2010?
A. 17.2% B. 3% C. 1% D. 8% E. 2%
答案解析:D
We can see that there was a decrease in the size of land allocated for Forest & Woodland,
So we will subtract the 2010 data from the 1990 data in order to avoid arriving at a
negative percentage.
The percentage change between 1990 and 2010 in Forest & Woodlands is: (29.38-26.95)/
29.38= 2.43/29.38=0.08= 8%.
9. Which of the following has seen the greatest relative change in size between 1990 and2010?
A. Urban land B. Forest & Woodland C. Crops & Bare fallow
D. Grasses & Rough grazing E. Landwater
答案解析:A
The relative change can be calculated for each type of land using the following formula:
((2010 size - 1990 size)/(1990 size)) * 100%. Since we want the greatest relative change
whether the change is an increase or a decrease, we will ignore any negative signs in
order to determine
which type of land had the greatest relative change. According to the pie charts, the
relative changes are as follows:
Urban Land: (56.35 - 34.28)/34.28* 100% = 64.382%, i.e. Urban Land got bigger by 64.382%。
Forest & Wodland: (26.95 - 29.38)/29.38* 100% = -8.271%, i.e. Forest & Woodland gotsmaller by 8.271%.
Crops & Bare fllow: (53.9- 49)/49 * 100% = 10%, i.e. Crops & Bare fallow got bigger by 10%.
Grasses & Rough grazing: (105.35- 127.34)/127.34* 100% =-17.269% , i.e Grasses &
Rough grazing got smaller by 17.269%.
Landwater: (2 45- 5)/5* 100% = -51 %, i.e. Landwater got smaller by 51%.
Therefore, Urban land experienced the greatest relative change with an increase of 64.382%.
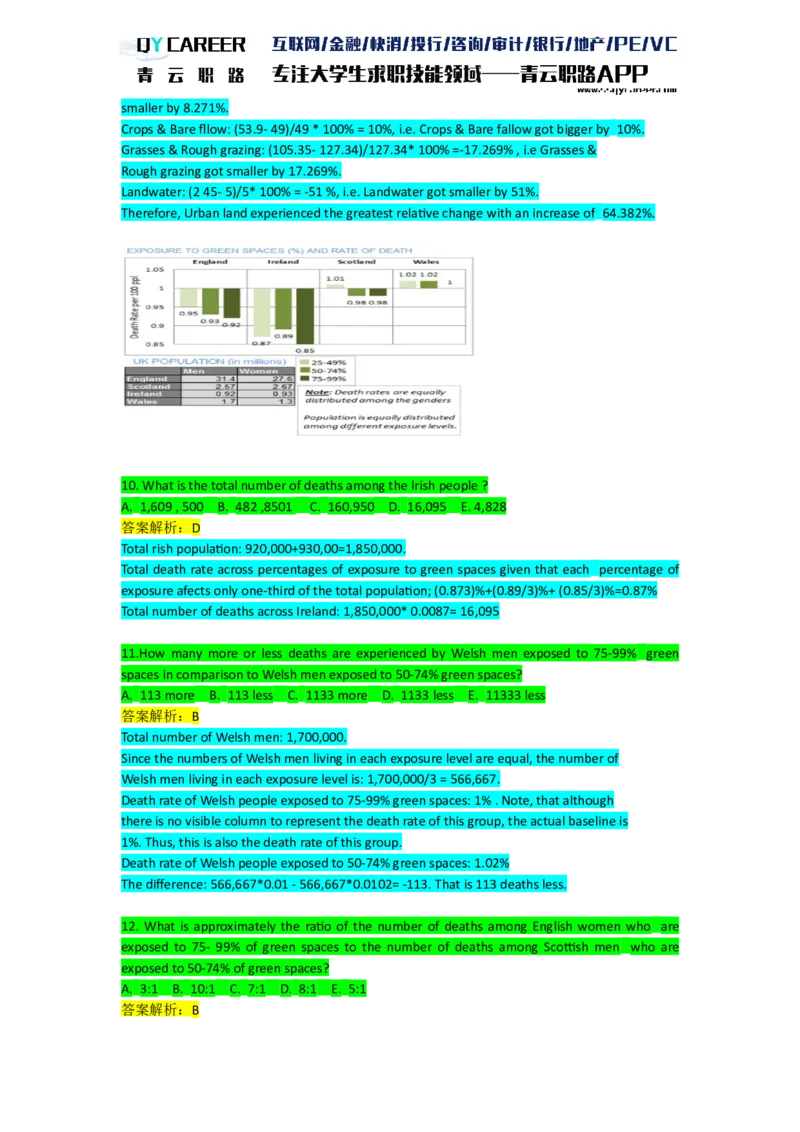
10. What is the total number of deaths among the lrish people ?
A. 1,609 , 500 B. 482 ,8501 C. 160,950 D. 16,095 E. 4,828
答案解析:D
Total rish population: 920,000+930,00=1,850,000.
Total death rate across percentages of exposure to green spaces given that each percentage of
exposure afects only one-third of the total population; (0.873)%+(0.89/3)%+ (0.85/3)%=0.87%
Total number of deaths across Ireland: 1,850,000* 0.0087= 16,095
11.How many more or less deaths are experienced by Welsh men exposed to 75-99% green
spaces in comparison to Welsh men exposed to 50-74% green spaces?
A. 113 more B. 113 less C. 1133 more D. 1133 less E. 11333 less
答案解析:B
Total number of Welsh men: 1,700,000.
Since the numbers of Welsh men living in each exposure level are equal, the number of
Welsh men living in each exposure level is: 1,700,000/3 = 566,667.
Death rate of Welsh people exposed to 75-99% green spaces: 1% . Note, that although
there is no visible column to represent the death rate of this group, the actual baseline is
1%. Thus, this is also the death rate of this group.
Death rate of Welsh people exposed to 50-74% green spaces: 1.02%
The difference: 566,667*0.01 - 566,667*0.0102= -113. That is 113 deaths less.
12. What is approximately the ratio of the number of deaths among English women who are
exposed to 75- 99% of green spaces to the number of deaths among Scottish men who are
exposed to 50-74% of green spaces?
A. 3:1 B. 10:1 C. 7:1 D. 8:1 E. 5:1
答案解析:BThe English women population according to the table is 27.6 million. Since exposure
levels are distributed evenly among the entire population, the number of English women
exposed to 75- 99% green spaces is: 27.6 million/3= 9.2 million. The rate of deaths for
people in England who are exposed to 75-99% green spaces is: 0.92%. Since deaths are
distributed evenly among the genders, the rate of deaths for women in England who are
exposed to 75-99% green spaces is: 0.92%12= 0.46%.
Thus, the number of deaths among this population is: 9,200,000*0.0046 = 42,320.
The Scottish men population according to the table is 2.57 million. Since exposure levels
are distributed evenly among the entire population, the number of Scottish men exposed
to 50- 74% green spaces is: 2.75 million/3 = 0.917 million. The rate of deaths for people in
Scotland who are exposed to 50- 74% green spaces is: 0.98% , Since deaths are
distributed evenly among the genders, the rate of deaths for Scottish men who are exposed to
50-74% green spaces is: 0.98% 12 = 0.49%. Thus, the number of deaths among this population is:
917,000*0.0049 = 4,490.
The ratio of the number of deaths among English women and Scottish men is:42,320:4,490.
The ratio can be reduced to approximately 10:1.
材料5
第五组 10题
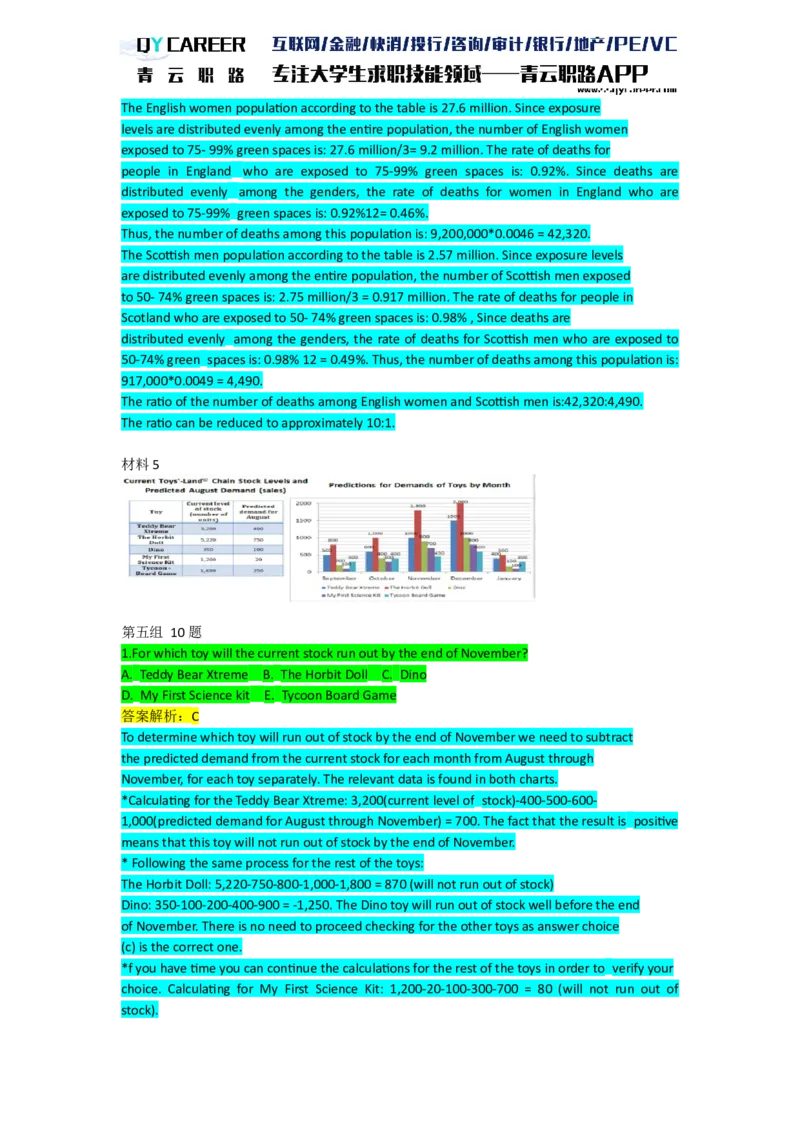
1.For which toy will the current stock run out by the end of November?
A. Teddy Bear Xtreme B. The Horbit Doll C. Dino
D. My First Science kit E. Tycoon Board Game
答案解析:C
To determine which toy will run out of stock by the end of November we need to subtract
the predicted demand from the current stock for each month from August through
November, for each toy separately. The relevant data is found in both charts.
*Calculating for the Teddy Bear Xtreme: 3,200(current level of stock)-400-500-600-
1,000(predicted demand for August through November) = 700. The fact that the result is positive
means that this toy will not run out of stock by the end of November.
* Following the same process for the rest of the toys:
The Horbit Doll: 5,220-750-800-1,000-1,800 = 870 (will not run out of stock)
Dino: 350-100-200-400-900 = -1,250. The Dino toy will run out of stock well before the end
of November. There is no need to proceed checking for the other toys as answer choice
(c) is the correct one.
*f you have time you can continue the calculations for the rest of the toys in order to verify your
choice. Calculating for My First Science Kit: 1,200-20-100-300-700 = 80 (will not run out of
stock).*Tycoon Board Game: 1 ,600-250-300-400-450 = 200 (will not run out of stock).
* Solving tip: Since the Dino has the lowest initial stock level it is reasonable to guess that
it will run out of stock the quickest. It is therefore worthwhile to begin your inspection
with this toy. One can quite quickly make the calculations starting off with an initial low
number such as 350.
2.If actual total sales until the end of October fall 10% below the total predicted demand,
what would be the percentage of actual sales out of the predicted demand?(简答题)
答案解析:Stopping for a minute to think about this question will help you realize that
no calculations are in fact necessary. If total sales fell short 10% below the total
predicted demand, then the percentage of actual sales out of the predicted demand
would simply be 90% (10% short).
*This question tries to trick you into making elaborate calculations, such as adding up all
predicted demands and calculating 90% of the result. Eventually you would have realized
that the result is simply 90% of the total predicted demands. This kind of question is
meant to test your ability to make the required logical leap and demonstrate basic
understanding in the subject of percentages.
3.Assuming the predictions materialize exactly as stated in the graph, which toy will have
the greatest percentage increase in sales from October to November and what will be
that change?
A. [img=http://jobtiku-1256670704.cos. ap-
beiing.myqcloud.com/qb/341588235807.png(233131)]
B. [img=http://jobtiku-1256670704.cos.
ap-beijing.myqcloud .com/qb/341588235811.png(225151)]
C. [img=http://jobtiku-1256670704.cos.
ap-beiing.myqcloud. com/qb/341588235814.png(244148)]
D. [img=http://jobtiku-1256670704.cos.
ap-beijing.myqcloud .com/qb/341588235818.png(222121)]
E. [img=http://jobtiku-1256670704.cos.
ap-beijing.myqcloud .com/qb/341588235822.png(234159)]
答案解析:E
To solve this question we need to examine each statement separately by referring to the
numbers presented in the bar chart for October and November.
*Answer choice (a): The increase in sales from October to November for the Horbit doll
would be (1 ,800-1 ,00)/1,000 = 800/1,000= 0.8 (80%) increase. As this matches the 80%
increase stated,
we should note this answer and see if there was any greater increase for another toy.
* Answer choice (b): Following the same reason for the "My First Science Kit' toy:
(700-300)/300 = 1.3333 (133.3%) increase. This does not match the statement.
* Answer choice (c): We already saw when we calculated for answer choice (a) that the
increase for The Horbit Doll would be an 80% increase which does not match the
statement in this Answer choice.
* Answer choice (d): Calculating for the Dino toy. (900-400)/400= 1.25 (125%) increase.This does not match the 25% stated in this answer choice.
* Answer choice (e): This answer choice states the correct percent increase for the "My
First Science Kit" and it is also the highest correct increase stated in all answer choices.
Answer choice (e) is therefore the correct one.
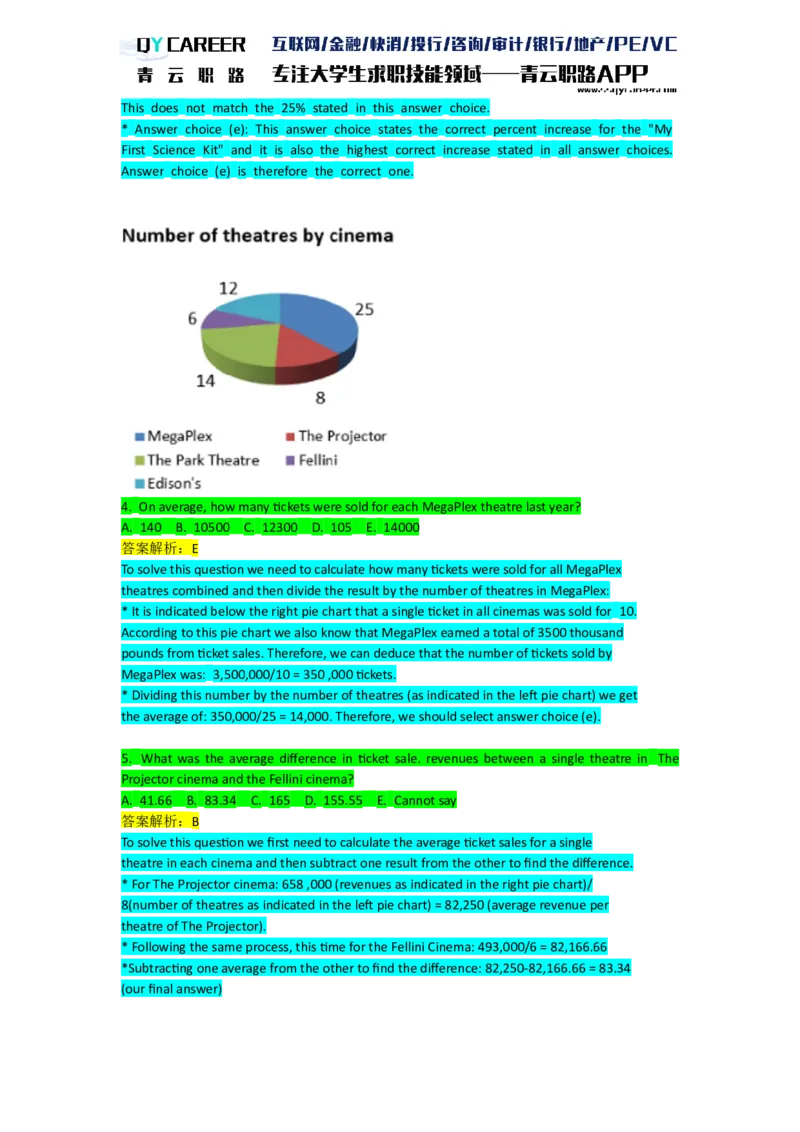
4. On average, how many tickets were sold for each MegaPlex theatre last year?
A. 140 B. 10500 C. 12300 D. 105 E. 14000
答案解析:E
To solve this question we need to calculate how many tickets were sold for all MegaPlex
theatres combined and then divide the result by the number of theatres in MegaPlex:
* It is indicated below the right pie chart that a single ticket in all cinemas was sold for 10.
According to this pie chart we also know that MegaPlex eamed a total of 3500 thousand
pounds from ticket sales. Therefore, we can deduce that the number of tickets sold by
MegaPlex was: 3,500,000/10 = 350 ,000 tickets.
* Dividing this number by the number of theatres (as indicated in the left pie chart) we get
the average of: 350,000/25 = 14,000. Therefore, we should select answer choice (e).
5. What was the average difference in ticket sale. revenues between a single theatre in The
Projector cinema and the Fellini cinema?
A. 41.66 B. 83.34 C. 165 D. 155.55 E. Cannot say
答案解析:B
To solve this question we first need to calculate the average ticket sales for a single
theatre in each cinema and then subtract one result from the other to find the difference.
* For The Projector cinema: 658 ,000 (revenues as indicated in the right pie chart)/
8(number of theatres as indicated in the left pie chart) = 82,250 (average revenue per
theatre of The Projector).
* Following the same process, this time for the Fellini Cinema: 493,000/6 = 82,166.66
*Subtracting one average from the other to find the difference: 82,250-82,166.66 = 83.34
(our final answer)6 .If The Park Theatre had raised its ticket selling price by 20%, what would have been its
revenues from ticket sales?(简答题)
答案解析:In order to solve this question we simply need to multiply The Park Theatre
revenues as presented in the right pie chart by 1.2 (a 20% increase):
*2,650,000*1.2= 3,180,000 pounds; this is our final answer.
*Note that the main point in this question is to realise that if the cinema raised each
individual's ticket by 20% this means that the total revenue from sales would rise by
20% as well, There is therefore no need at all to recalculate a single ticket's price after
the increase to reach the answer.
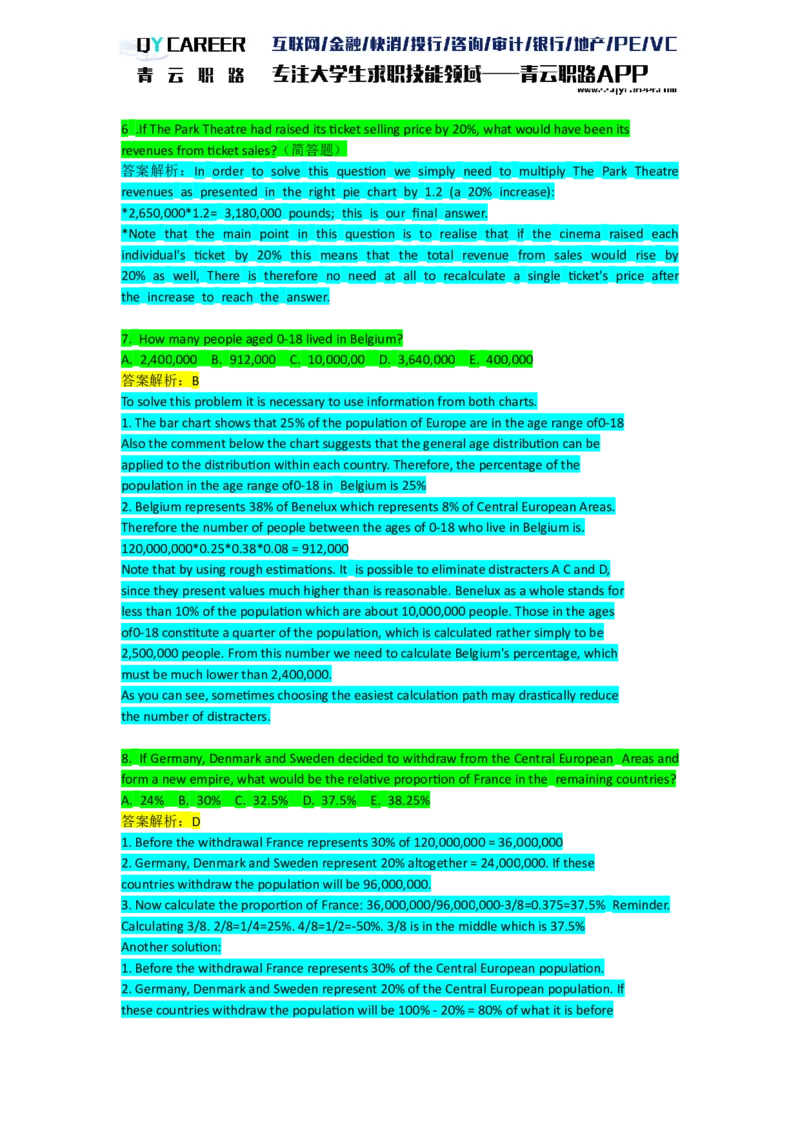
7. How many people aged 0-18 lived in Belgium?
A. 2,400,000 B. 912,000 C. 10,000,00 D. 3,640,000 E. 400,000
答案解析:B
To solve this problem it is necessary to use information from both charts.
1. The bar chart shows that 25% of the population of Europe are in the age range of0-18
Also the comment below the chart suggests that the general age distribution can be
applied to the distribution within each country. Therefore, the percentage of the
population in the age range of0-18 in Belgium is 25%
2. Belgium represents 38% of Benelux which represents 8% of Central European Areas.
Therefore the number of people between the ages of 0-18 who live in Belgium is.
120,000,000*0.25*0.38*0.08 = 912,000
Note that by using rough estimations. It is possible to eliminate distracters A C and D,
since they present values much higher than is reasonable. Benelux as a whole stands for
less than 10% of the population which are about 10,000,000 people. Those in the ages
of0-18 constitute a quarter of the population, which is calculated rather simply to be
2,500,000 people. From this number we need to calculate Belgium's percentage, which
must be much lower than 2,400,000.
As you can see, sometimes choosing the easiest calculation path may drastically reduce
the number of distracters.
8. If Germany, Denmark and Sweden decided to withdraw from the Central European Areas and
form a new empire, what would be the relative proportion of France in the remaining countries?
A. 24% B. 30% C. 32.5% D. 37.5% E. 38.25%
答案解析:D
1. Before the withdrawal France represents 30% of 120,000,000 = 36,000,000
2. Germany, Denmark and Sweden represent 20% altogether = 24,000,000. If these
countries withdraw the population will be 96,000,000.
3. Now calculate the proportion of France: 36,000,000/96,000,000-3/8=0.375=37.5% Reminder.
Calculating 3/8. 2/8=1/4=25%. 4/8=1/2=-50%. 3/8 is in the middle which is 37.5%
Another solution:
1. Before the withdrawal France represents 30% of the Central European population.
2. Germany, Denmark and Sweden represent 20% of the Central European population. If
these countries withdraw the population will be 100% - 20% = 80% of what it is beforethese countries withdraw.
3. Now calculate the proportion of France: 30%/80%-3/8=0.375-37.5%
9. New laws stated that all UK senior citizens (age 60+) are entited to 25 guineas each
year. In France, the same population type received 55 Sous.If 1 guinea = 2 sous, what was
the total special grant in these countries, in guineas?
A. 126,500,000 B. 198,000,000 C. 225,000,000 D. 275,500,000 E. 300,750,000
答案解析:C
In order to solve this problem the following calculations should be made:
Find the number of senior citizens in Great Britain and those of France, multiply by the
amount of the grant and then convert the total grant in France from sous to guineas.
1. Great Britain: 120,000,000*0.1*0.42*25=126,000,000
2. France: 1200000*0.1*0.3*55=198,000,000
Convert into guineas 198,000,000/2 = 99,000,000
3. Total amount: 126M + 99M = 225M = 225,000,000 guineas.
Solving tips - working with distracters;
1. Have a look at the answer choices. What can you see?
You see that all answer choices are given in millions. This should tell you that you are able
to perform the calculations without adding all the zeroes. This can save you a lot of time.
All you'll have to do is to look only on the first few figures. E.g. calculating the senior's grant the
French state.120 (instead of 120,000,000)*0.1*0.3*55= 198.
2. There could have been a distracter option of 324,000,000 You would get this amount if
you add the British grant to the French grant and forgot to convert the French coin to
guineas. This number does not appear here within the distracters. Probably, the goal is to try and
help you to avoid making mistakes based solely on a minor lack of attention.
Our message is: if you ever feel really sure with your answer, yet you cannot find it within
the answer choices, it might just be a hint that you have skipped a small step. Revise the
question and get the score you deserve.10. What is the ratio of the population of senior citizens (60+) in Great Britain to the population
of young citizens (0-18) in the Netherlands?
A. 21:10 B. 2:7 C. 8:7 D. 2:21 E. 7:2
答案解析:E
The proportion of senior citizens in Great Britain is 0.42*0.1=0.042
The proportion of young citizens in the Netherlands is 0.08*0.6*0.25=0.012
Moving the decimal point three places to the right will give 42:12 =(/2)= 21:6 =(/3)= 7:2.
Remember that any ratio has directionality, thus answer choice E is correct.
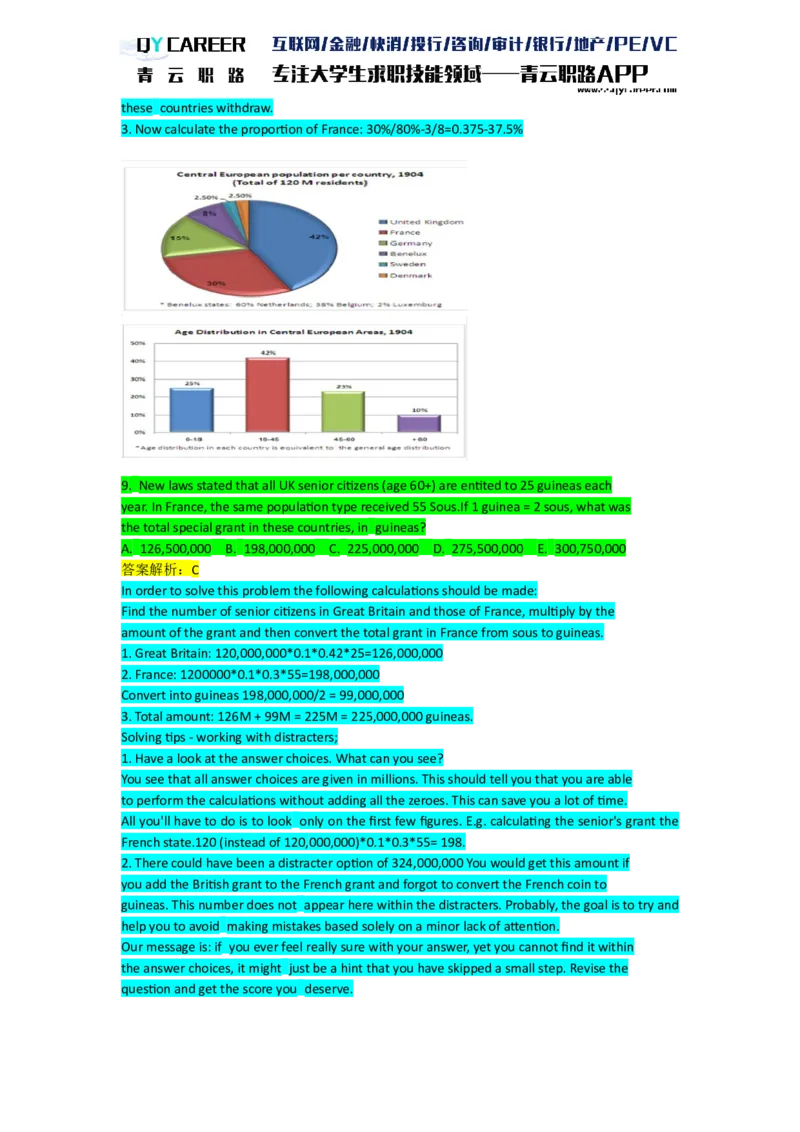
材料6
第六组 12题
1.Which hospital had the largest annual proft (total costs subtracted from income)?
A. [img=http://jobtiku-1256670704.cos.
ap-beiing.myqcloud.com/qb/341588239661.png(241158)]
B. [img=http://jobtiku-1256670704.cos.
ap-beijing.myqcloud .com/qb/341588239665.png(260106)]
C. [img=http://jobtiku-1256670704.cos.
ap-beiing.myqcloud. com/qb/341588239670.png(257126)]
D. [img=http://jobtiku-1256670704.cos.
ap-beijing.myqcloud .com/qb/341588239673.png(248124)]
E. [img=http://jobtiku-1256670704.cos.
ap-beijing.myqcloud .com/qb/341588239676.png(300120)]
答案解析:D
The way to solve this question is rather straightforward and is more than hinted at in the
question itself. For each hospital separately we should calculate the annual profit by
subtracting the relevant total costs (as stated for each hospital in the row highlighted in
light green) from the total income for that hospital. Then we should pick the hospital for which
the result came up the highest.
* Answer choice (a) Saint Peter Hospital: 527-477= 50
*Answer choice (b) Sunnyview Medical Centre: 224-259.2 = -35.3 (this hospital is in fact in debt!)
* Answer choice (c) Dllinaton General Hospital: 1522-1030.3 = 491.7
* Answer choice (d) Bunginshire County Hospital: 2675-2175.8 = 499.2
* Answer choice (e) Clara McFaint Community Hospital: 150-130= 20
As one can see from the above calculations, Bunginshire County Hospital had the largest annual
profit- answer choice (d) is therefore the correct one.2.Which hospital has the most equipment and supplies?
A. [img=http://jobtiku-1256670704.cos.
ap-beiing.myqcloud.com/qb/341588240030.png(233933)]
B. [img=http://jobtiku-1256670704.cos.
ap-beijing.myqcloud .com/qb/341588240036.png(262126)]
C. [img=http://jobtiku-1256670704.cos.
ap-beiing.myqcloud. com/qb/341588240039.png(259132)]
D. [img=http://jobtiku-1256670704.cos.
ap-beijing.myqcloud .com/qb/341588240042.png(261129)]
E. [img=http://jobtiku-1256670704.cos.
ap-beijing.myqcloud .com/qb/341588240045.png(314121)]
F. [img=http://jobtiku-1256670704.cos.
ap-beijing.myqcloud .com/qb/341588240049.png(250900)]
答案解析:F
This question tries to trick you into thinking that you can deduce the number of equipment and
supplies simply by inspecting the differences in expenses in this area across the different
hospitals.
Such a strategy would be essentially erroneous since we do not know whether or not all
hospitals buy the same equipment for the same prices. It is quite possible, for example,
that one hospital that invested more money than another in supplies actually ends up with
less supply as it makes its purchases from a more expensive purveyor. It therefore stems that it is
not possible to tell and answer choice (f) is the correct one.
3.Clara McFaint Community Hospital can increase its total income by E10,000 (from
additional subsidies) if it increases its investment in Equipment and' Supplies by 50%.
What would be the net benefit or cost of doing this?
A. [img=http://jobtiku-1256670704.cos.
ap-beiing.myqcloud.com/qb/341588240467.png(250900)]
B. [img=http://jobtiku-1256670704.cos.
ap-beijing.myqcloud .com/qb/341588240474.png(295178)]
C. [img=http://jobtiku-1256670704.cos.
ap-beiing.myqcloud. com/qb/341588240477.png(312158)]
D. [img=http://jobtiku-1256670704.cos.
ap-beijing.myqcloud .com/qb/341588240482.png(299181)]
E. [img=http://jobtiku-1256670704.cos.
ap-beijing.myqcloud .com/qb/341588240485.png(293190)]
F. [img=http://jobtiku-1256670704.cos.
ap-beijing.myqcloud .com/qb/341588240488.png(269109)]
答案解析:D
To solve this question, we would first need to calculate the hospital's current profit (or "net
income" ) and its possible net income assuming it applied the change. Then we would need to
compare between the two:
*Current profit (total income minus total costs) = 150-130= 20* Equipment and Supplies expenses would increase by 50%, which is an addition of 20*0.5=10
* Answer choice (d) Bunginshire County Hospital: 2675-2175.8= 499.2
* Answer choice (e) Clara McFaint Community Hospital: 150-130= 20
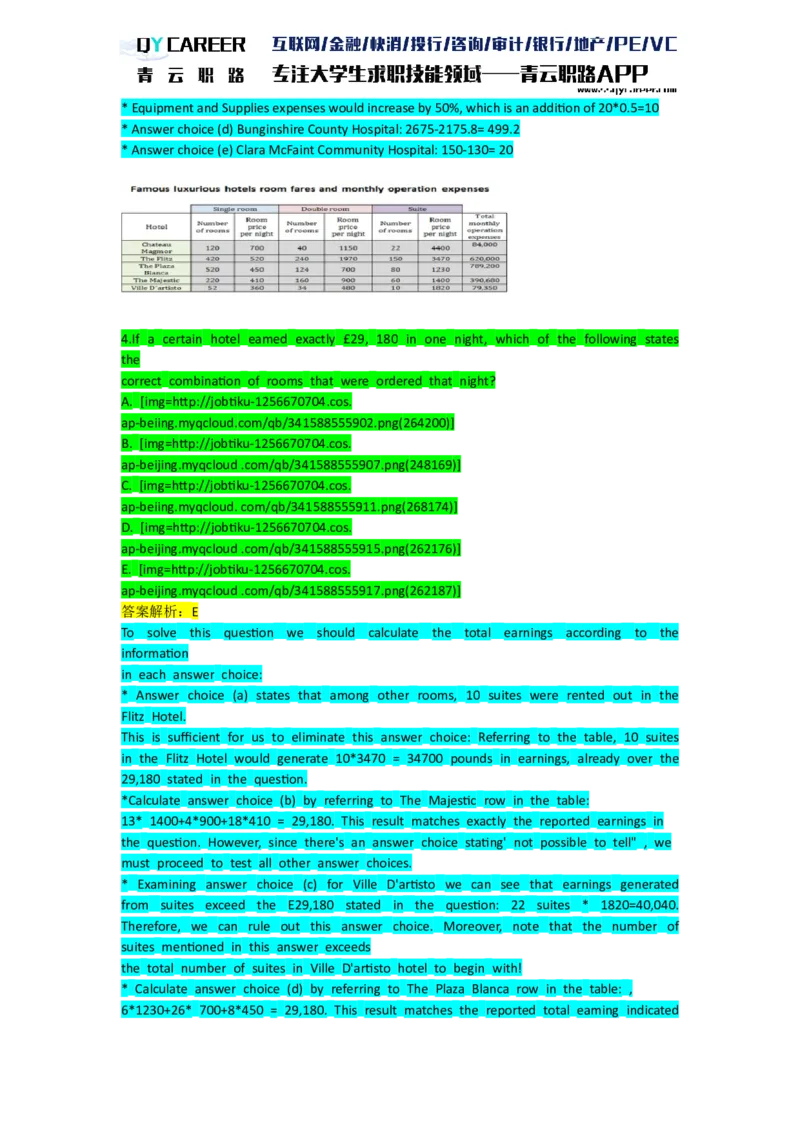
4.If a certain hotel eamed exactly £29, 180 in one night, which of the following states
the
correct combination of rooms that were ordered that night?
A. [img=http://jobtiku-1256670704.cos.
ap-beiing.myqcloud.com/qb/341588555902.png(264200)]
B. [img=http://jobtiku-1256670704.cos.
ap-beijing.myqcloud .com/qb/341588555907.png(248169)]
C. [img=http://jobtiku-1256670704.cos.
ap-beiing.myqcloud. com/qb/341588555911.png(268174)]
D. [img=http://jobtiku-1256670704.cos.
ap-beijing.myqcloud .com/qb/341588555915.png(262176)]
E. [img=http://jobtiku-1256670704.cos.
ap-beijing.myqcloud .com/qb/341588555917.png(262187)]
答案解析:E
To solve this question we should calculate the total earnings according to the
information
in each answer choice:
* Answer choice (a) states that among other rooms, 10 suites were rented out in the
Flitz Hotel.
This is sufficient for us to eliminate this answer choice: Referring to the table, 10 suites
in the Flitz Hotel would generate 10*3470 = 34700 pounds in earnings, already over the
29,180 stated in the question.
*Calculate answer choice (b) by referring to The Majestic row in the table:
13* 1400+4*900+18*410 = 29,180. This result matches exactly the reported earnings in
the question. However, since there's an answer choice stating' not possible to tell" , we
must proceed to test all other answer choices.
* Examining answer choice (c) for Ville D'artisto we can see that earnings generated
from suites exceed the E29,180 stated in the question: 22 suites * 1820=40,040.
Therefore, we can rule out this answer choice. Moreover, note that the number of
suites mentioned in this answer exceeds
the total number of suites in Ville D'artisto hotel to begin with!
* Calculate answer choice (d) by referring to The Plaza Blanca row in the table: ,
6*1230+26* 700+8*450 = 29,180. This result matches the reported total eaming indicatedin the question as well.
* Since both answer choices (b) and (d) present possible room combinations that match
the exact total earning, we cannot tell which of them was responsible for the eamings.
Hence, answer choice (e) is the correct one.
5.How much would each person in a group of 10 friends need to pay for a four-night visit
to Ville D'aristo if renting five double rooms with a 30% discount for each room on the last
night? Please give your answer to one decimal point without rounding.(简答题)
答案解析:To solve this question, we first need to calculate the total price the 10
friends would need to pay for the described combination of rooms and nights. Then we
should divide the resulting number by the number C
people,i.e. by 10: Calculting the total price for all friends and the described combination:
5 double rooms * 3 nights of normal price * 480 (one double room price at Ville
D'artisto) + 5 double rooms* 1 last night* (1-0.3)*480(price per room accounting for the
30% discount) = 8880
* Now, remember to divide this number by the number of friends (10 friends):
8880/10=888
Note: Alteratively, we could solve this question by making the calculations for one
person
from the beginning. If a group of 10 friends are renting 5 double rooms, we know
there are
two people in a room (this could be extracted from the word 'double). The price fora
room per night in Ville Dartisto is 480. For one person, it would be half the price:
480/2=
240. We know there is a 30% discount for the last night,meaning that one will only pay
70% of the rate. 70% of 240 is 7/10*240 = 168. Total:(240*3)+168 = 720+ 168-888.
6.If in all hotels 10% of the total monthly operation expenses are invested in maintenance
of single rooms, what is the difference between the average maintenance costs of one
single room in The Majestic to that of The Flitz?
A. 22,932 B. 352,420 C. 29.97 D. 229,320 E. 31.42
答案解析:C
To solve this question we should follow two steps. First, we need to calculate the average
maintenance cost for one night in a single room in each of the hotels mentioned. We
should do this for each hotel separately by calculating 10 percent of the total monthly
operation expenses (single rooms' maintenance expense) and then dividing the resulting figure
by the number of rooms. In the second step we need to calculate the difference between the
two
maintenance costs (of a single room in each hotel):
* For The Majestic hotel- one single room maintenance cost = 0.1 (10 percent)* 390,680
(total monthly operation expenses)/220 (number of single rooms in the Majestic) =177.58
(average maintenance cost for one single room)
*Following the same procedure, this time for The Flitz: 0.1* 620,000/420= 147.61
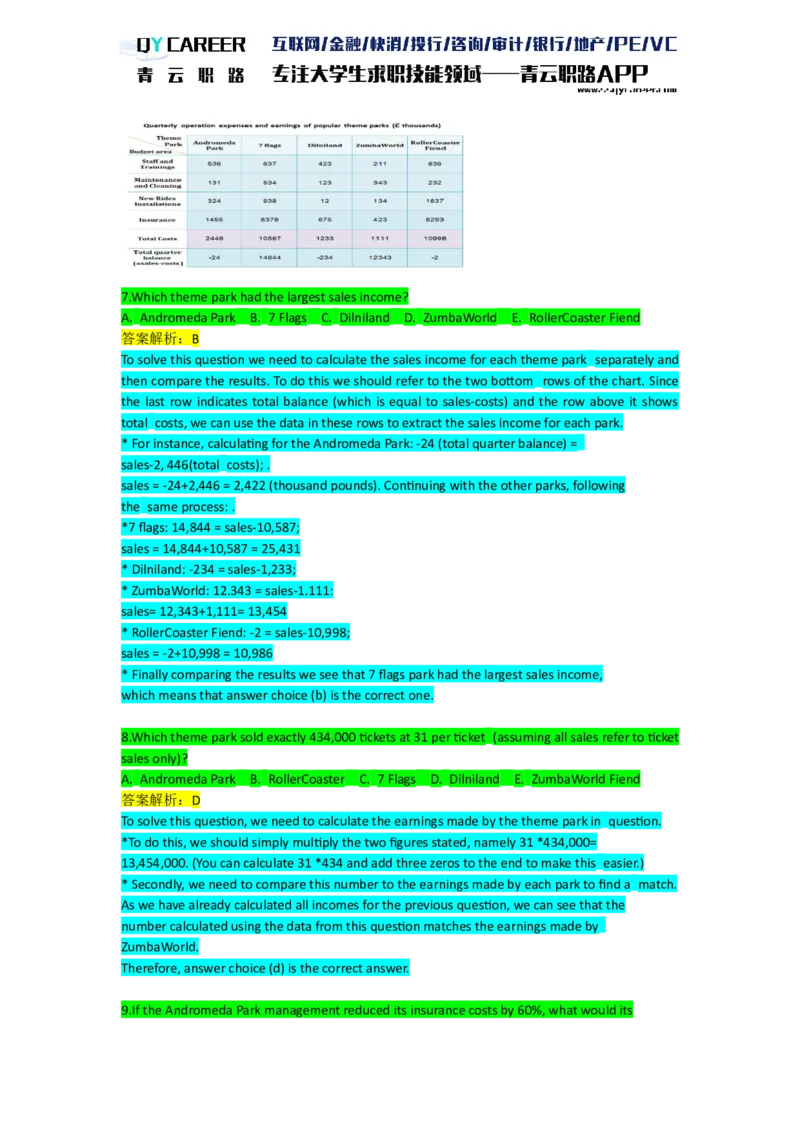
*The difference between the two fiaures = 177.58-147.61= 29.977.Which theme park had the largest sales income?
A. Andromeda Park B. 7 Flags C. Dilniland D. ZumbaWorld E. RollerCoaster Fiend
答案解析:B
To solve this question we need to calculate the sales income for each theme park separately and
then compare the results. To do this we should refer to the two bottom rows of the chart. Since
the last row indicates total balance (which is equal to sales-costs) and the row above it shows
total costs, we can use the data in these rows to extract the sales income for each park.
* For instance, calculating for the Andromeda Park: -24 (total quarter balance) =
sales-2, 446(total costs); .
sales = -24+2,446 = 2,422 (thousand pounds). Continuing with the other parks, following
the same process: .
*7 flags: 14,844 = sales-10,587;
sales = 14,844+10,587 = 25,431
* Dilniland: -234 = sales-1,233;
* ZumbaWorld: 12.343 = sales-1.111:
sales= 12,343+1,111= 13,454
* RollerCoaster Fiend: -2 = sales-10,998;
sales = -2+10,998 = 10,986
* Finally comparing the results we see that 7 flags park had the largest sales income,
which means that answer choice (b) is the correct one.
8.Which theme park sold exactly 434,000 tickets at 31 per ticket (assuming all sales refer to ticket
sales only)?
A. Andromeda Park B. RollerCoaster C. 7 Flags D. Dilniland E. ZumbaWorld Fiend
答案解析:D
To solve this question, we need to calculate the earnings made by the theme park in question.
*To do this, we should simply multiply the two figures stated, namely 31 *434,000=
13,454,000. (You can calculate 31 *434 and add three zeros to the end to make this easier.)
* Secondly, we need to compare this number to the earnings made by each park to find a match.
As we have already calculated all incomes for the previous question, we can see that the
number calculated using the data from this question matches the earnings made by
ZumbaWorld.
Therefore, answer choice (d) is the correct answer.
9.If the Andromeda Park management reduced its insurance costs by 60%, what would itsquarterly balance be?
A. 8,490 B. 849,000 C. 423 ,000 D. 78,000
答案解析:B
Alternatively, you could solve this question using the concept of balance.
Total quarter balance = sales-costs
The reduction in the insurance costs results in a reduction in total costs. The sales stay
constant, consistent with this change. If total costs are lower, the balance would
therefore be higher. For example: if one decides t spend less money on outings this
month and his/her income and other expenditures stay the same, it will lead to having a
more positive balance in one's account.
We know that the insurance is reduced by 60%, which is a 0.6* 1455= 873 thousand pound
reduction. Andromeda Park will have an extra 873 thousand pounds of income. The
original balance was -24 thousand pounds. Therefore, the current balance is -24+873-849
thousand pounds = 849 ,000.
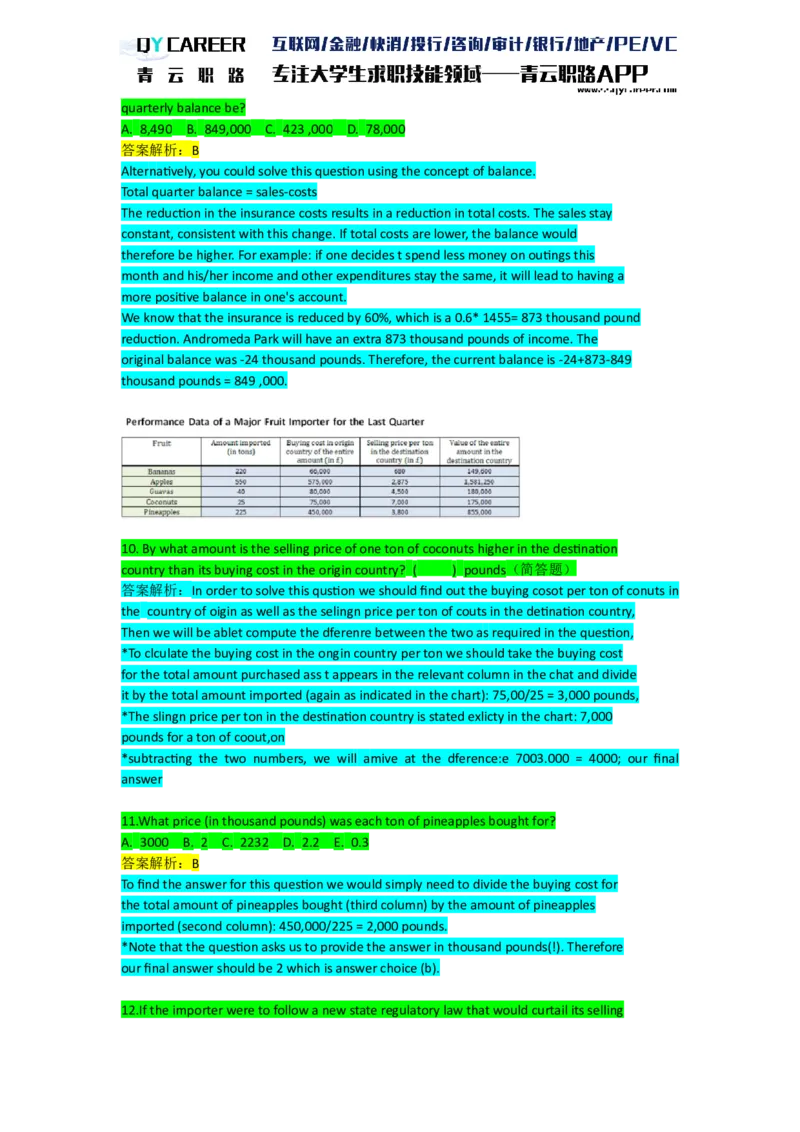
10. By what amount is the selling price of one ton of coconuts higher in the destination
country than its buying cost in the origin country? ( ) pounds(简答题)
答案解析:In order to solve this qustion we should find out the buying cosot per ton of conuts in
the country of oigin as well as the selingn price per ton of couts in the detination country,
Then we will be ablet compute the dferenre between the two as required in the question,
*To clculate the buying cost in the ongin country per ton we should take the buying cost
for the total amount purchased ass t appears in the relevant column in the chat and divide
it by the total amount imported (again as indicated in the chart): 75,00/25 = 3,000 pounds,
*The slingn price per ton in the destination country is stated exlicty in the chart: 7,000
pounds for a ton of coout,on
*subtracting the two numbers, we will amive at the dference:e 7003.000 = 4000; our final
answer
11.What price (in thousand pounds) was each ton of pineapples bought for?
A. 3000 B. 2 C. 2232 D. 2.2 E. 0.3
答案解析:B
To find the answer for this question we would simply need to divide the buying cost for
the total amount of pineapples bought (third column) by the amount of pineapples
imported (second column): 450,000/225 = 2,000 pounds.
*Note that the question asks us to provide the answer in thousand pounds(!). Therefore
our final answer should be 2 which is answer choice (b).
12.If the importer were to follow a new state regulatory law that would curtail its sellingprice (per ton) of apples by 30%, what would the new value of the entire amount be?
A. 1 ,506,875 B. 987,992 C. 1,106,875 D. 1,536,119 E.1,120,000
答案解析:C
In order to solve this question we would need to follow these two steps:
*First we would need to calculate the new selling price per ton after the 30% reduction.
The current price appears in the apples row in the third column. The new selling price per
ton would therefore change into: 2875*(1-0.3)= 2875*0.7 = 2012.5 pounds per ton.
* Secondly, we need to multiply the new selling price by the amount of apples imported
(as indicated in the second column): 2012 5*550 = 1,106,875; the correct answer choice
is therefore (c).
材料7
第七组 12题
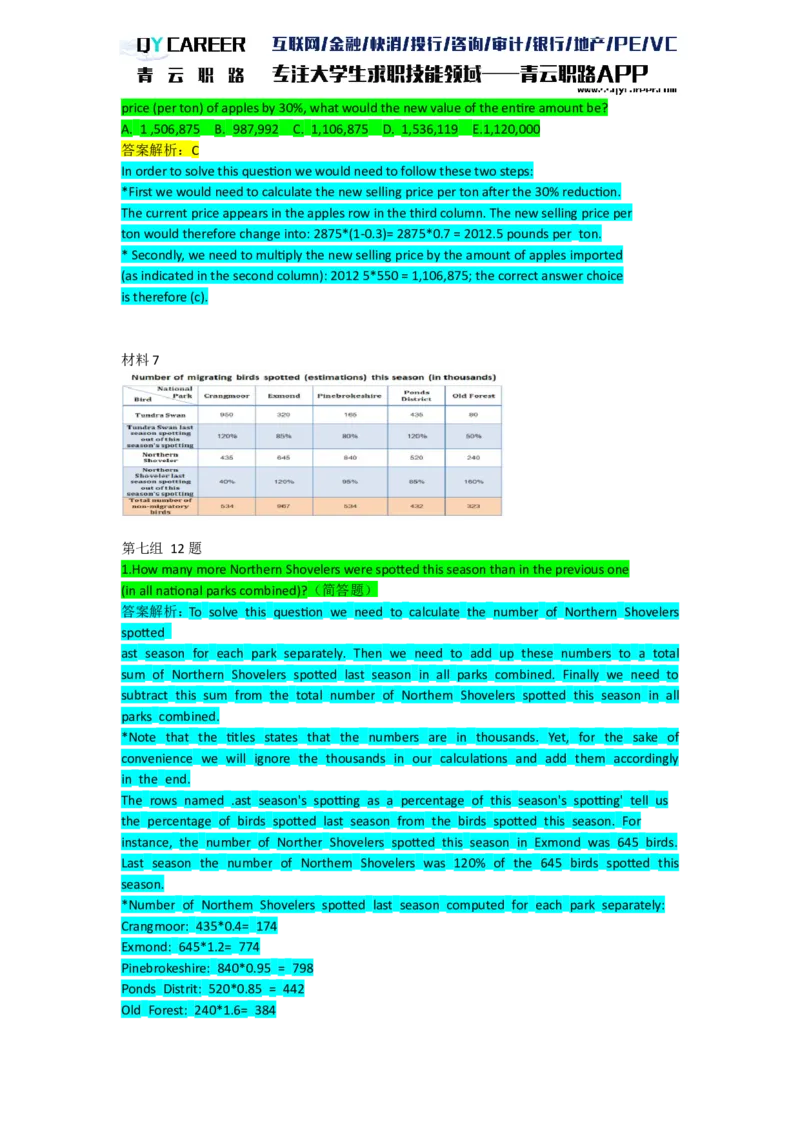
1.How many more Northern Shovelers were spotted this season than in the previous one
(in all national parks combined)?(简答题)
答案解析:To solve this question we need to calculate the number of Northern Shovelers
spotted
ast season for each park separately. Then we need to add up these numbers to a total
sum of Northern Shovelers spotted last season in all parks combined. Finally we need to
subtract this sum from the total number of Northem Shovelers spotted this season in all
parks combined.
*Note that the titles states that the numbers are in thousands. Yet, for the sake of
convenience we will ignore the thousands in our calculations and add them accordingly
in the end.
The rows named .ast season's spotting as a percentage of this season's spotting' tell us
the percentage of birds spotted last season from the birds spotted this season. For
instance, the number of Norther Shovelers spotted this season in Exmond was 645 birds.
Last season the number of Northem Shovelers was 120% of the 645 birds spotted this
season.
*Number of Northem Shovelers spotted last season computed for each park separately:
Crangmoor: 435*0.4= 174
Exmond: 645*1.2= 774
Pinebrokeshire: 840*0.95 = 798
Ponds Distrit: 520*0.85 = 442
Old Forest: 240*1.6= 384*Total number of Northerm Shovelers spotted last season: 174+774+798+442+384=2572
*Total number of Northem Shovelers spotted this season (rom the table):
435+645+840+520+240 = 2680
*ifference in number of Northem Shovelers spotted: 2680-2572 = 108
* Conclusion: 108,000 more Northern Shovelers were spotted last season compared to
this season.(recall that the numbers in the table are in thousands, hence the final
answer is 108,000
and not 108) Take notice:
An incorrect way to approach this question is to sum all the percentages indicated in
the
"last season" row. If we do so we will get 500%, indicating a 5-times increase in the :
number of Northerm Shovelers
spotted this season compared to the last season. This is wrong since We cannot add up
percentages refering to changes made to dfferent 'wholes'. This will always yield a
dfferent result than applying the individual percentage separately to each such 'whole.
For example, 10% of 100+ 10% of 200 = 30 which is unequal to (10%+10%) of
(100+200)= 20% of 300= 60.
2.In which national park was the percentage of Tundra Swans to all other birds the greatest?
A. Not possible B. Crangmoor C. Exmond D. Pinebrokeshire I Ponds District
E. Old Forest F. to tell
答案解析:A
To solve this question we need to divide the number of Tundra Swans in each park by the
number
of other birds in that park (Northerm Shovelers+non-migratory birds). Then we need to
compare the results to see which park had the largest proportion of swans to all other birds.
*Crangmoor.950/(435+534) =0.98
Exmond: 320/(645+967)= 0.19
Pinebrokeshire: 165/(840+534) = 0.12
Ponds District: 435/(520+432) = 0.45
Old Forest: 80/(240+323) = 0.14
* Conclusion: The greatest result is that of Crangmoor, hence this is the correct answer choice.
Take notice:
Although the question asks you about the greatest percentage of Tundra Swans from all
other birds, this is only meant as a distraction. You do not actually need to convert the
resulting DroDortions into Dercentaoes (0.45 translates to 45%).
3. Which of the following. sentences states a correct change observed this season in the
number of Tundra Swans compared to the previous season?
A. [img=http://jobtiku-1256670704.cos.
ap-beiing.myqcloud.com/qb/341588558728.png(275213)]
B. [img=http://jobtiku-1256670704.cos.
ap-beijing.myqcloud .com/qb/341588558731.png(314198)]
C. [img=http://jobtiku-1256670704.cos.ap-beiing.myqcloud. com/qb/341588558734.png(270217)]
D. [img=http://jobtiku-1256670704.cos.
ap-beijing.myqcloud .com/qb/341588558737.png(318191)]
E. [img=http://jobtiku-1256670704.cos.
ap-beijing.myqcloud .com/qb/341588558741.png(319993)]
答案解析:C
To solve this question we should examine each answer choice separately.
* Answer choice (a) states that there was an increase in the number of Tundra Swans
spotted in Crangmoor this season, but in the table we can see that there was actuallya
decrease in the number of swans (last season's number was " 120%”of this season's
number). This helps us eliminate this answer choice.
* Answer choice (b), like answer choice (a), indicates a wrong direction of change. It
states a decrease in the number of swans in Pinebrokeshire while according to the table,
there was an increase from last season (last season's number was 80% of this season's
number). This helps us eliminate this answer choice.
*Answer choice (c) indicates a correct direction and a correct absolute change.
Calculating the absolute decrease in number of swans:
Last season's number of swans = 950,000*1.20
Last season's number of swans = 1,140,000
Difference: 1,14000-950,000 = 190,000
* Answer choice (d) states a correct direction of change (increase in the number of
swans in Pinebrokeshire this season). However, note that the absolute number of increase stated
is a fraction (495.23), which doesn't make sense since number of swans spotted must be an
integer.
This helps us eliminate this answer choice.
k Answer choice (e) which states that "none of the above is correct" cannot be true since
we found that answer choice (C) is correct. In conclusion answer choice (c) is the correct one.
Solving tip:
* DO not make any calculations before you examine whether it is possible to eliminate
answer choices based on general trends of change or other irational statements (e.g. an
indication of a fraction where only integers can apply- there are only whole birds, not part
birds! )
* Remember to take into account the correct units (e.g. thousands in this question's
case).
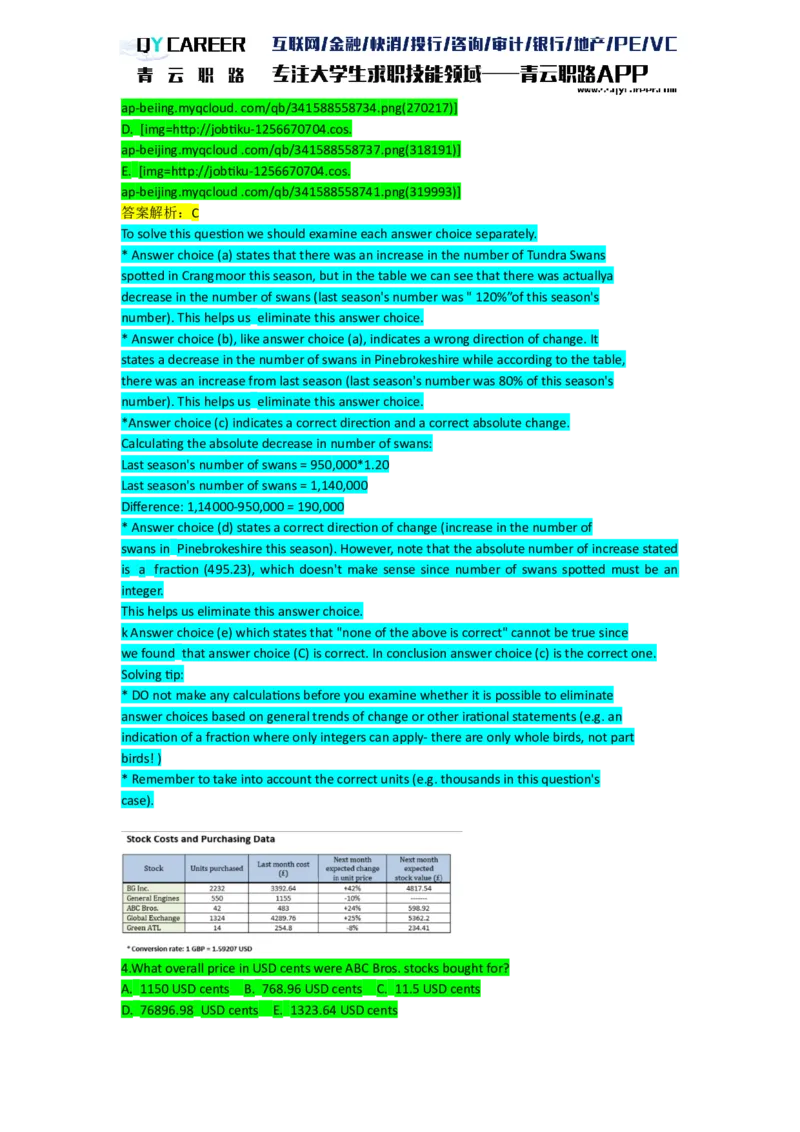
4.What overall price in USD cents were ABC Bros. stocks bought for?
A. 1150 USD cents B. 768.96 USD cents C. 11.5 USD cents
D. 76896.98 USD cents E. 1323.64 USD cents答案解析:D
To solve this question we need to refer to the ABC Bros. row in the table and note that
ABC Bros.
stock was bought for 483 pounds. Then using the conversion rate stated below the chart
we should convert the 483 pounds to USD and multiply by 100 to find the sum in cents:
483*1.59207*100 = 76,896.98 USD cents. Therefore answer choice (d) is the correct one.
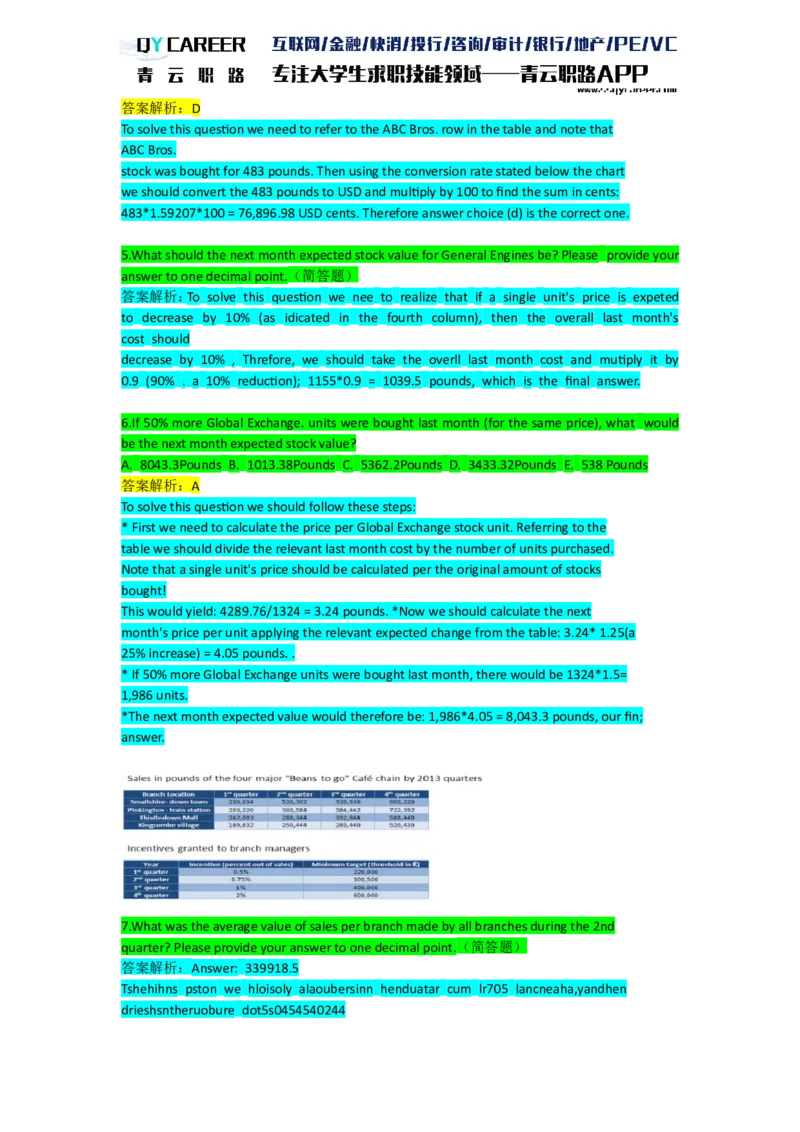
5.What should the next month expected stock value for General Engines be? Please provide your
answer to one decimal point.(简答题)
答案解析:To solve this question we nee to realize that if a single unit's price is expeted
to decrease by 10% (as idicated in the fourth column), then the overall last month's
cost should
decrease by 10% , Threfore, we should take the overll last month cost and mutiply it by
0.9 (90% . a 10% reduction); 1155*0.9 = 1039.5 pounds, which is the final answer.
6.If 50% more Global Exchange. units were bought last month (for the same price), what would
be the next month expected stock value?
A. 8043.3Pounds B. 1013.38Pounds C. 5362.2Pounds D. 3433.32Pounds E. 538 Pounds
答案解析:A
To solve this question we should follow these steps:
* First we need to calculate the price per Global Exchange stock unit. Referring to the
table we should divide the relevant last month cost by the number of units purchased.
Note that a single unit's price should be calculated per the original amount of stocks
bought!
This would yield: 4289.76/1324 = 3.24 pounds. *Now we should calculate the next
month's price per unit applying the relevant expected change from the table: 3.24* 1.25(a
25% increase) = 4.05 pounds. .
* If 50% more Global Exchange units were bought last month, there would be 1324*1.5=
1,986 units.
*The next month expected value would therefore be: 1,986*4.05 = 8,043.3 pounds, our fin;
answer.
7.What was the average value of sales per branch made by all branches during the 2nd
quarter? Please provide your answer to one decimal point.(简答题)
答案解析:Answer: 339918.5
Tshehihns pston we hloisoly alaoubersinn henduatar cum lr705 lancneaha,yandhen
drieshsntheruobure dot5s045454024439895 pounds- our fial answer
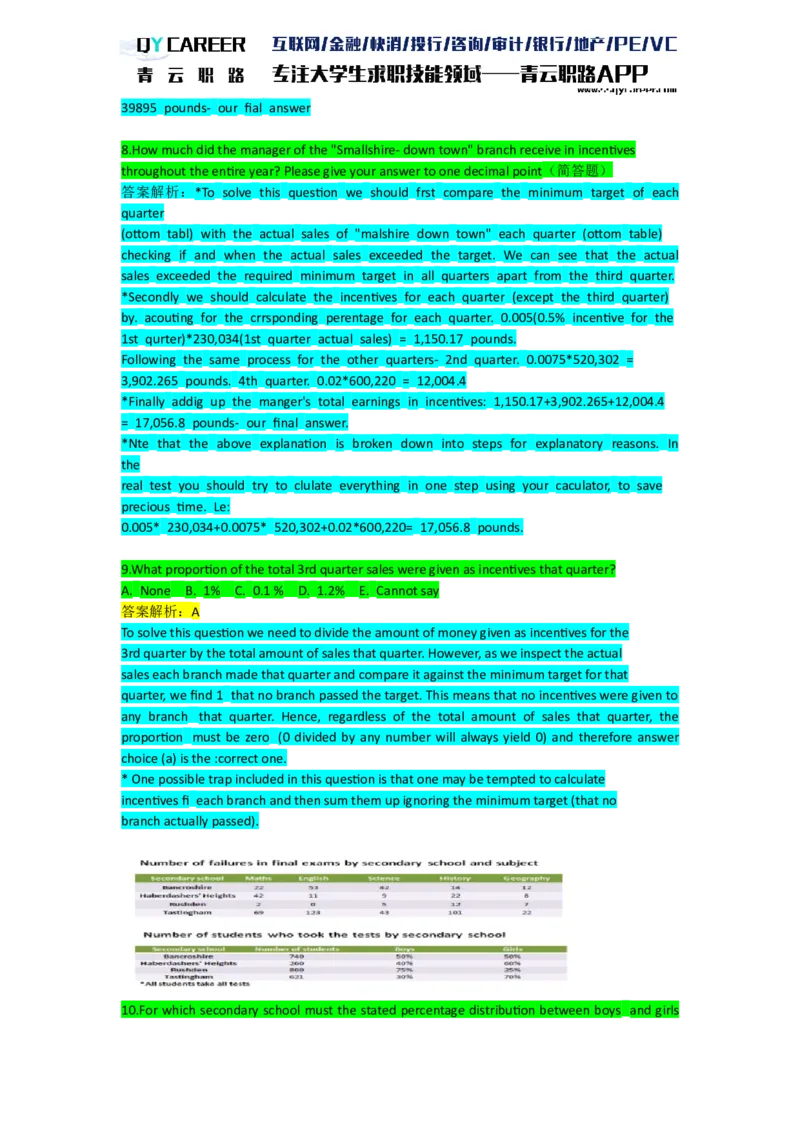
8.How much did the manager of the "Smallshire- down town" branch receive in incentives
throughout the entire year? Please give your answer to one decimal point(简答题)
答案解析:*To solve this question we should frst compare the minimum target of each
quarter
(ottom tabl) with the actual sales of "malshire down town" each quarter (ottom table)
checking if and when the actual sales exceeded the target. We can see that the actual
sales exceeded the required minimum target in all quarters apart from the third quarter.
*Secondly we should calculate the incentives for each quarter (except the third quarter)
by. acouting for the crrsponding perentage for each quarter. 0.005(0.5% incentive for the
1st qurter)*230,034(1st quarter actual sales) = 1,150.17 pounds.
Following the same process for the other quarters- 2nd quarter. 0.0075*520,302 =
3,902.265 pounds. 4th quarter. 0.02*600,220 = 12,004.4
*Finally addig up the manger's total earnings in incentives: 1,150.17+3,902.265+12,004.4
= 17,056.8 pounds- our final answer.
*Nte that the above explanation is broken down into steps for explanatory reasons. In
the
real test you should try to clulate everything in one step using your caculator, to save
precious time. Le:
0.005* 230,034+0.0075* 520,302+0.02*600,220= 17,056.8 pounds.
9.What proportion of the total 3rd quarter sales were given as incentives that quarter?
A. None B. 1% C. 0.1 % D. 1.2% E. Cannot say
答案解析:A
To solve this question we need to divide the amount of money given as incentives for the
3rd quarter by the total amount of sales that quarter. However, as we inspect the actual
sales each branch made that quarter and compare it against the minimum target for that
quarter, we find 1 that no branch passed the target. This means that no incentives were given to
any branch that quarter. Hence, regardless of the total amount of sales that quarter, the
proportion must be zero (0 divided by any number will always yield 0) and therefore answer
choice (a) is the :correct one.
* One possible trap included in this question is that one may be tempted to calculate
incentives fi each branch and then sum them up ignoring the minimum target (that no
branch actually passed).
10.For which secondary school must the stated percentage distribution between boys and girlsbe wrong?
A. Banroshire B. Haberdashers" Heights C. Rushden D. Tastingham E. Not possible to
tell
答案解析:D
The question implies that we should relate to the percentage distribution in determining
our answer.Doing So for each secondary school:
*Answer choice(a)-Bancroshire:740*0.5(percent of boys)= 375;740*0.5(percent of
girls)=375.This is a viable distribution.
*Answer choice(b)-Haberdashers' Heights:260*O.4(percent of boys)= 104;
260*0.6(percent of girls)= 156.This is another viable distribution.
*Answer choice (c)-Rushden:800*0.75(percent of boys)= 600;800*0.25(percent of girls)
=200.Yet another possible distribution.
*Answer choice (d)-Tastingham:621*0.3(percent of boys)= 186.3;We can stop here and
conclude that this percentage distribution is the wrong one.A number of people cannot
be a fraction- there can't be 0.3 of a boy.Therefore answer choice (d) is the correct one.
11.In which school was the percentage of students who failed.(out of the overall.
number of students in that school) the he lowest? Assume that no student failed in more
than one subject.
A. Banroshire B. Haberdashers"Heights C. Rushden D. Tastingham
答案解析:C
Explanation:To solve this question we should first calculate the percentage of failed
students for each school separately and then compare the numbers to find the lowest
percentage.To do so we need to refer to the first table and sum up, for each school, the
total number of failed students across all subjects.Then we need to divide that number by the
total number of students as indicated in the lower table.
*Answer choice(a)- Bancroshire:(22+53+42+14+12)/740=0.19 (19%)
*Answer choice (b)-Haberdashers' Heights: (42+11+9+22+8)/260= 0.35(35%)
*Answer choice (c)-Rushden:(2+0+5+12+7)/800= 0.03(3%)
Answer choice(d)-Tastingham:(69+123+43+101+22)/621=0.57(57%)
*By comparing the results we see that Rushden school had the lowest percentage of
students who failed,hence answer choice(c) is the correct one.
12.1% of the boys who study at Rushden failed their final history exam.How many girls at
Rushden failed their final history exams? ( )female students(简答题)
答案解析:To figure out the number of girls who failed their history exam at Rushden
we first need to find out how many boys failed and then subtract that number from
the total number of
students who failed (in History).
We should follow the next steps:
*Refrring to the bottom table we will figure out the number of boys who failed in
histry (at
Rushden):0.75(75% of students are boys)* 800 (number of students)= 600(number of
boys who study at Rushden)*0.01(the given percent of boys who failed in history)* 600(the number of boys as we
found out)= 6(six boys failed in history)
*Referring to the upper table:12(total number of students who failed their history exam
at
Rushden)- 6(number of boys who failed) = 6(number of girls who failed their history
exam at Rushden- our final answer).
材料8
第八组 13题
1.How many tons of sea-food products were imported to the UK from Canada?( ) tons(简答
题)
答案解析:Answer:77800
Explanation
To find the answer to this question we should simply add up all the figures appearing
in
the Canada row (across all fish types) in the upper chart:
10,500+15,000+12000+28,300+12,000 = 77800 tons.This is our final answer.
2.How many tons of imported salmon and imported shrimp were used by restaurants?
( ) tons .
答案解析:Answer: 40958.4
Explanation
To solve this question we should follow these steps:
*First we should refer to the upper table and calculate the total amount of salmon and
the
total amount of shrimp (separately) imported from all countries combined.To do this we
should add up all the number:
in the salmon column (across all countries) and then do the same for the amount of
shrimp.Total amount of salmon imported:18,000+28,300+3,500+12,300= 62,100 tons.
Total amount of shrimp importe 30,660+12,000+14,200+8,000= 64,860 tons.
*Secondly we should calculate how much of the total amount of salmon and shrimp
was
used by restaurants in the UK using the relevant percentages provided in the bottom
table:
amount of salmon used by restaurants would be 0.2(20%)*62,100= 12,420.Amount ofshrimp used by restaurants would be:0.44(44%)*64,860= 28,538.4
*Finally adding up the two amounts:12,420+28,538.4= 40958.4 tons-our final answer.
3.Herring was sold by China at480 per ton and Shrimp at 231 per ton.How much did
the canned food industry pay for these two types of fish(assume that percentages of
allocation are identical for the specific exporting countries)? Please give your answer to
one decimal point ( )pounds(简答题)
答案解析:Answer 649273.8
Explanation
To solve this question we would need to fllow the next steps.
*First we would need to clculate the total amount of Hering and the total amount of
Shrimp alolatedl to the canned food industry from the amount of these fish imorted
from
China.Using both tables,calculating for the amount of Hring:0.13(139%)>7,000 (amount of
Hering imported from China)= 910 tons, Now clulating for the amount of
Shrimp:0.03*30,660= 919.8 tons.
*Secondly, we should clulate the total sum paid for the amount of Shrimp and that paid
for
the amount of Hrrin, using the Chinese slling prices,and then add up the two results:910
(tons of Hering)*480(the Chinese slinin price per ton of Hrin)+919.8(tons of
Shimpl*231the
Chinese slin price per ton of Shrimp)= 649273.8 pounds.This is the price the canned
food
industry paid for Herring and Shrimp imported from China.
4.In January 2008,average family expenditures on fruit and vegetables were 220.What
were total family costs in January 2010, if expenditures on the same cons um ption group
increased by 15%?[explanation]
A. 66661 B. 7667 C. 7229 D. 80021 E. Cannot say
答案解析:B
First,find the amount of money spent on that group in 2010:220x1.15= 253
The fruit and vegetables share in January 2010 is 3.3% ,and since $253 represents 3.3%,
by using reverse average operation,you get:
253 x(100*3.3)= 7666.66= 7667
For a more in-depth explanation on reverse percentages, please refer to our percentages
video tutorial.5.What was the total family cost in 2009 if total family cost in January 2007 was 5850 and in
2008 prices rose by 3.7%?[explanation]
A. 6066 B. 6291 C. 6524 D. 7667 E. Cannot say
答案解析:E
There is not enough information to answer this question.The price change in 2009 is not
given, so you cannot calculate the family cost for that year. In addition, information about
the inflation rate in 2007 is unknown.Therefore, the answer is 'cannot say'.
6.What was the average annual % change in housing maintenance during the years 2008-2010?
A. 3.28% B. 2.82% C. 6.66% D. 3.33% E. 6.67%
答案解析:A
We are looking for an annual average change.The table refers to the years 2008 and 201
o (and not to 2009).The average annual change is the change that took place "twice"
during a two-year period.
The relative change from 2010 to 2008 is:10.4/9.75=1.066666667.How do we calculate
the annual average change? Note that treating this as simple average and dividing by two
would be a mistake, as changes in percentages over years are treated like interest,i.e.the
Change from 2009 to 2010 applies not only over the base-rate of 2008, but also on the change
from 2008 to 2009.
The correct solution will be to find a multiplying coefficient,that if we multiply the base-
rate by this coefficient to the power of the number of annual changes, we would get the
final rate.The above -mentioned relative change indicates exactly the result of the
change coefficient (which we are looking for) by the power of 2 (the number of annual changes
from 2008 to 2010).
So, we must take the squared root of 1.066666667;which is 1.0328,and we get the
annual average change.
(1.0328-1)*100=3.28%
Expansion: If the question had given information about a 3-year period, and we had
known only the total relative change, we could calculate the annual average change by
taking the 3rd root.A 4-vear Deriod-> 4th root.etc.
Alternatively, you can solve the question by using the average annual percent change formula.
Where :
n=Number of periods (months,years,etc.)Substitute:
7.When comparing the two age groups in experiment 1, what is the difference in success
rates for the vocabulary test?[explanation]
A. 0.332 B. 0.177 C. 0.227 D. 0.477 E. 0.572
答案解析:C
Success rate = (average score/maximal score)
The table specifies that the maximal score for the vocabulary test is 33.In experiment 1, the
average score for older people is 23.2, and for young people-15.7.Now we can calculate the
difference: (23.2-15.7)/33= 0.227
8.Approximately, what is the weighted average success rate of young people who took
the fluid a bility test,from Experiments 1 and 2 combined?
A. 75 B. 80 C. 94 D. 90 E. 85
答案解析:A
The weighted average success rate can be found by giving each experiment group a new
average score which is proportional to the size of the two groups com bined.
Number of young people in experiments 1 and 2 combined: 20+15=35.
Success rate = average score/maximal test score
Group 1:
Proportinal size:20/35.
Average success rate: 99.5/130=0.765=76.5%
Group 2:
Proportional size:15/35
Average success rate: 94.2/130=0.725=72.5%
Weighting:[(15/35)*72.5]+[(20/35)*76.5]~759.Approximately, what is the percent increase in the profit contribution of the sports
department between 2008 and 2009? [explanation]
A. 15.6 B. 10.4 C. 11.2 D. 5.7 E. 17.7
答案解析:B
A simple percentage calculation.
Either: (85/77)-1=0.1038=10.38% or (85-77)/77=0.1038=10.38%~10.4%
10.What is the sum of profits gained through foreign investments +affiliates
departments, in billions of Euros, in 2008 and 2009?[explanation]
A. 1.278 B. 0.897 C. 1.21 D. 1.932 E. 2,000
答案解析:C
Adding the numbers gives:
570+592+82-34=1210 million, which is 1.21 billion.
11.In 2011, foreign investments profits are expected to increase by 10%, and sports are to
increase by 7 %.What would be the difference between the two departments, in millions of
Euros? [explanation]
A. 81.24 B. 56.86 C. 79.36 D. 42.5 E. 58
答案解析:B
(1.1*112)-(1.07*62)=56.86
12.Of the total increase in profits between 2009 and 201 o, what percent is the increase
in profit for the consultancy department?
A. 5.314 B. 4.391 C. 7.36 D. 4.591 E. 8.477
答案解析:B
We need the relative share of consultancy ( 58 49 = 9 million),out of the whole increase:
9/(610-592)+(406 381)+(112-(-34))+(58 49)+(62-85)+(5-(-25))]*100%= 4.39%
*Note that in this question you are required to deal with a change (increase) and not absolute
values.
13.What is the ratio of absolute differences in profits between affiliates and consultancy
departments to the remaining departments, between the years 2008 and 2009?
[explanation]
A. 11:27 B. 24:96 C. 39:166 D. 1:4 E. 13:50
答案解析:C
The ratio is between two departments and the rest:Affiliates and cons ultancy:
Affiliates:592- 570= 22
Consultancy: 49-32=17
Total Affiliates and Consultancy: 39
The rest:
Sales:410-381= 29
Foreign investments: 82+34= 116
Sports: 85-77=8
Others: 25-12=13
Totalrest: 1 66
Thus, the ratio is 39 : 166
*Please note that the question is asking about the absolute difference.
材料9
第九组 12题
1.Which brewery produced the least in 2004?
A. Ux bridge,u K B. Malmo,Sweden C. Torino,lta ly
D. Ottawa,Canada E. Canberra,Austra lia
答案解析:D
In order to determine which brewery produced the least in 2004, we
need to use the 2005 monthly output and the total output as a
percentage for 2004.
Monthly output for 2004= (monthly output 2005x100%)/ total
output as a percentage for 2004.Monthly output for 2004x12=
vosrlv nuitniit for 20∩4
Ottawa, Canada-(1000 x 100)/ 80 = 1250K per month in 2004
1250×12=15000K litres in 2004
TlP: In this question, Ottawa,Canada's low output stands out.
Therefore,you can make an educated guess by looking at the data
without having to do the actual calculation.
2.If production for the brewery in ottawa,Canada was expected to increase by 400 in 2006,l byl
how many thousands oflitres would its monthly output differ in 200 6 com pared with the
output in 2004?
A. 80 less B. The same C. 150 more D. 400more E. can not Say
答案解析:CWe need to determine how many litres the Canadian brewery is expected to produce monthly in
2006=(monthly output for 2005x expected increase in %)1 100%= monthly output for 2006
(1000 x 140)1 100= 1400K litres per month in 2006
We need to calculate how many litres the Canadian brewery produced monthly in
2004=(monthly output 2005x1 00) 1 total output as a percentage for 2004(1000x
100%%)/80%=1250K per month in 2004
Monthly output for 2006- monthly output for 2004= 1400K- 1250K= 1 50K litres more beer was
produced per month in 2006 compared with 2004.
The answer is 150 more.
3.If the Month ly Output for the Torin.brewery represented a pproximate ly 609 of the total
output ( with the rema inder being water) for the Torino brewery,l how many thousands of litres
of water were produced every month by the Torinol brewery ?
A. 33200 B. 13333 C. 8000 D. 5333 E. cannot Say
答案解析:D
We first have to determine how many thousands of litres of beer and water were produced. We
know the amount of beer produced (8000 litres), which represents 60% of the total output.
(Monthly output Torino beer x 100)/ 60 = monthly output of beer and water = (8000 xx100)/ 60=
13333 litres Subtract the amount of beer produced from the total amount of water and beer
produced to determine the amount of water produced.
Monthly output of water and beer—monthly output of beer =monthly output of water = 13333-
8000= 5333 litres of water The answer is 5333.
Another way to tackle this question is by using the "triangle trick";
step 1-arrange tne inrormation in twO columns so the real real values are adjacent to their
corresponding %(? represent the
amount of water):
8000.60% 40%
step 2-multiply the numbers along the dlagonal ana then divide by
the remaining number:
? = (8000/60)*40=>'The amount of water = 5333 litres.
4.Which of these breweries has the highest ratio of operationa l costs to revenues?
A. Uxbridge, UK B. Malmo,Sweden C. Torino,ltaly D. Ottawa,Canada E. Can
berra,Austra lia
答案解析:C
The ratio is calculated in the following manner: operational costs /
revenues = ratio
Uxbridge,UK= 3.6/25=0.144Malmo,Sweden = 0.3/3=0.1
Torino, Italy = 2.8114=0.2
Ottawa, Canada = 0.28/3= 0.0933
Canberra,Australia =0.3/8=0.0375
Therefore, the answer is Torino, Italy.
5.If a 25%% increase in marketing and development costs will lead to a 35% increase in
revenues, what will the ratio of marketing and devel lopment costs to revenues be in Canberra,.
Australia following the rise?
A. 0.081:1 B. 0.085:1 C. 0.81:1 D. 0.85:1 E. Cannot Say
答案解析:C
Calculate the 25%% increase in marketing and development costs:
marketinganddevelopmentcostsX1.25=、7x1.25=8.75
Calculate the 35%% increase in revenues: revenues x 1.35= 8×1.35=10.8
Calculate the new ratio for marketing and development costs to revenues = 8.75110.8=0.81
6.When does the train with the greatest number of passengers on it leave the station?
A. 07:00 B. 08:00 C. 12:00 D. 17:00 E. 21:00
答案解析:E
The train with the greatest number of passengers on it is the train with the greatest
number of occupied seats,calculated as:Num.of seats-Num.of vacant seats:The correct answer is 21 :00
7.On average, how often do trains leave the Paris train station (in a 24 hour period)?
A. Every 4.8 hours B. Every 2.6 hours C. Every 3.2 hours D. Every 4.0 hours E. Every 3.6
hours
答案解析:A
Five trains leave the station each day at different times. In order to calculate the average
frequency of the trains, divide 24 hours by the number of trains:24/5=4.8.
Note that the exact hour of each train does not matter since all you need to know is that
there are five trains in 24 hour period.
8.What is the total number of people who depart from Paris to Barcelona by train?
A. 1115 B. 1080 C. 1280 D. 1005 E. 1170
答案解析:E
In order to answer this question we need to calculate the number of occupied seats in
each train and then sum up all the data to arrive at the correct answer:
Total number of people who depart from Paris to Barcelona on train:
290+250+175+140+325= 1170.9. Which ISP scored 50 and below the least number of times?
A. ISP1 B. ISP2 C. ISP3 D. ISP4 E.ISP5
答案解析:D
ISP4 received only 25 scores of 50 and below, which is the lowest in comparison to all of the
other ISP's. The answer is ISP4.
10. Which ISP had the lowest percentage of 86 and above scores?
A. ISP1 B. ISP2 C. ISP3 D. ISP4 E.ISP5
答案解析:C
First we have to calculate the percentage of 86 and above scores for each category: (The
number of scores that were 86 and above for each ISP / total number of scores for each
ISP)x 100
ISP1: (4581 2168) X 100= 21.1%
ISP2: (4701 1937) X 100= 24.3% ,
ISP3: (751 1437) x 100= 5.2%
ISP4: (1241 1493)x 100= 8.3%
ISP5: (389/ 1540) X 100= 25.3%
ISP3 had the lowest percentage of 86 and above scores with 5.2%.
The answer is ISP3.
11. How many scores of 66-85 did ISP1 and ISP3 receive combined?
A. 1743 B. 2597 C. 369 D. 687 E. 1056
答案解析:A
ISP1 received 1056 scores of 65-85 and ISP3 received 687 scores of 66-85. Between
them they received= 1056 + 687= 1743.
The answer is 1743.
12. What proportion of scores were 50 and below for ISP5?
A. 13.75% B. 11.2% C. 9.8% D. 20% E. 7.2%
答案解析:E
The proportion of scores that were 50 and below for ISP5 = (The number of scores that
were 50 and below for ISP5 I total number of scores forlSP5)x 100= (1121 1540)x 100=7.2%.
7.2% of the scores given to ISP5 were 50 and below.
材料10第十组 14题
1.How much does it cost to deliver a newspaper successfully in Sydney ( excluding lost papers)?
A. 1.2 B. 1.4 C. 1.6 D. 1.8 E. 2.0 F. 2.2 G. 2.4 H. Cannot Say
答案解析:H
There is no information about newspaper prices,therefore we can't
figure out the answer based on the existing data.
The answer is Cannot Say.
2.What is the ratio of successfully delivered newspapers to lost newspapers in London ?
A. 1:5 B. 1:19 C. 20:1 D. 1:20 E. 19:1 F. cannot Say
答案解析:E
out of a total of 100% of newspapers that leave the factory,5% are
lost.This means that for every 1 00 newspapers,95 papers are
delivered and five newspapers are lost.Dividing 95 by 5= 19.The
ratio of successfully delivered newspapers to lost newspapers in
London is 19:1.
The answer is 19:1.
3.Estimate how many newspapers were lost during delivery in New York per day.
A. 930 B. 1000 C. 1200 D. 900 E. 1500 F. cannot Say
答案解析:B
15,600 newspapers were successfully delivered in NY, excluding
those that were lost.
We know that 6% of the total number of newspapers in New York are lost.
This means that 15.600 newspapers make up 94% of the total
amount (100-6= 94).So (15.600 ×6)/94= 995.74=1000
newspapers are lost ln New York every day.
Another method for calculating:(15.600 x 100)/94=16.595.74
(this is the total number of newspapers in New York per day).The total number of newspapers
minus the number of newspapers succesfuly delivered is the number of newspapers lost per
day:
16.595.74-15.600 = 995.74
The answer is 1000.
4.What would Sydney's lost rate have to be. to match he number of successful deliveries in Paris
( excluding lost papers) per day ?
A. 5% B. 7.50% C. 10% D. 12.5% E. 15% F. They will never match.答案解析:B
With a loss rate of 11%,the 7,704 newspapers that are successfully delivered in Sydney make up
89% of the total newspapers delivered(100%-11 %).
The total number of deliveries in Sydney (including lost papers) is(7,704x100)/89= 8,656.
In Paris,8,007 newspapers are delivered successfully.In order for
Sydney to have the same number of successfully delivered papers,
Sydney must only lose 8,656-8,007 = 649 newspapers.Therefore,
the new Sydney lost rate must be(649/ 8,656)*100%=7.5%.
The answer is 7.5%.
5.Which sector had the lowest unem ployment in absolute values in 2006 in the UK and
Australia CD mlbined?
A. Hea lthcare B. Tourisn B Hospita lity C. IT D. Education E. Construction
答案解析:E
We must add the unem ployment figures for each sector in the UK and Australia and the
smallest number will indicate the sector with the lowest unemployment. In this particular case
we may also look at the actual percentages of the unemployment rate to give us an indication.
Healthcare = 122000十54000= 176000
Tourism &F Hospitality = 1 68000十65000= 233000
-IT=82000+119000=20100,
Education = 54000十87000= 141000
-Construction = 79000十26000= 105000
The answer is Construction.
6.Which sector had the greatest ratio of Australian to UK unemployed in 2006?
A. Tourism and Hospitality B. IT C. Education D. Construction E. other
答案解析:C
The quickest way to solve this question is to look at the data before starting any calculations.The
question asks about the ratio of Australian to UK unemployed.This means that the higher the
Australian number and the smaller the UK number,the greater the ratio.
We can immediately eliminate the Health care,Tourism & Hospitality and Construction
sectors,since the number of unemployed over the UK is greater than that of Australia.
Between It and Education, in which the number of unemployed is greater in Australia, we can
perform a direct calculation and find in which sector the requested ratio is higher.
The it sector's ratio is 119000: 82000=1.45
The Education sector's ratio is 87000:54000= 1.61.
The ratio is higher for the education sector; therefore, this is the correct answer
7.Which sector had a ratio of the . number of UK to Australia unemployed of approximately 3:1?A. Tourism and Hospitality B. IT C. Education D. Construction E. other
答案解析:D
At a glance we can spot the only two sectors that have a UK to Australian ratio that is around 3:1
are the Construction and Other sectors .
The detailed calculation shows:
Construction UK : Construction Australia = 79000: 26000= 3.03
Other UK : Other Australia = 3605000 : 1009000= 3.57
The Construction sector has an approximate UK to Australian ratio of 3:1.
The answer is Construction.
8.Approximately what proportion of UK and Australia IT unemployed in 2006 were UK residents?
A. 25% B. 40% C. 45% D. 50% E. 55% F. Cannot Say
答案解析:B
The proportion of IT unemployed in 2006that were UK residents=
(IT Unemployed in UK/(IT Unemployed in UKHIT unemployed in
Australia))x 100
(82,000/(82,000+119,000))x 100= 40.8%
Another way to calculate:82,000+119,000= 201 ,000
(82,000/201.0O0)*100= 40.8%
The answer is 40%.
9.If the total number of unenployed in the UK reflects approxinately 6.80 of the total population
of ltaly. what is the population of ltaly ?
A. 60 million B. 55 million C. 6 million D. 600 million E. Cannot Say
答案解析:A
The population of ltaly = (Total number of unemployed in UK 16.8)>K
100 = Population of Italy = (411000016.8)x100= 60.4Million
The answer is 60 million.
10.Approximately what percentage of the tota 1 value of extracted coal produce is the USA
responsible for?
A. 32 B. 35 C. 37 D. 40 E. 43 F. Cannot Say
答案解析:D
According to the table,the USA coal market is worth 1,375 million and the total extracted coalproduce is 3,456 million.
In order to answer the question, we need to divide the USA coal produce by the total value of
extracted coal produce and multiply the result by 100:
1,375/3456×100=0.397x100= 39.7%=40%
The answer is 40.
11.Which product shows the highest ratio of the value of extracted produce in the USA to that in
Asia?
A. Oil B. Copper C. Coal D. Uranium E. silver
答案解析:B
The ratio can be calculated by roughly dividing the value of extracted produce in the USA by the
value in Asia.
In oils, it is roughly 3:1 (1574/487), in Copper 1:1, in Coal:2:1 (1375/728), in Uranium
8:1(3208/427), and in Silver 2.5:1 (1789/700).
Thus, Uranium shows the highest ratio of the value in the USA to the value in Asia.
The answer is Uranium.
Tip: In this case, we could have saved a considerable amount of time and avoided unnecessary
calculations if we had just looked at the table.
The question asks a bout the ratio of USA'S value of extracted produce to that of Asia.This means
that the higher the value in the USA and the lower the value in Asia, the greater the ratio.we
can easily see that Uranium is both responsible for the highest value in the USA and the lowest
value in Asia, thus it is the product with the highest ratio of USA's value of extracted produce to
that of Asia.
The answer is Copper.
12.Which product has the lowest overal value of extra cted produce per employee?
A. Oil B. Copper C. Coal D. Uranium E. silver
答案解析:B
In order to find the value of extracted produce per em ployee for each product, we need to
divide each product's value of extracted produce by the number of associated em ployees:
Oil: 7,568,000,000/2.572.000 = 2942 per employee
Copper: 3,587 ,000,000/1.235.000 = 2904 per employee
Coal:3,456.000.000/957.000 = 3611 per em ployee
Uranium: 6,875.000,000/1.542.000 = 4458 per em ployee
Silver: 3,500,00o,000/1,012,000 = 3458 per em ployee
Thus, the product with the lowest value of extracted product per employee is Copper.
13.By how much does the overall value of extracted silver perenm ployee exceed that of
Copper ?
A. 5,859 B. 54 C. 3,789 D. 554,000 E. 75,258 F. 554 G. 150,000
答案解析:F
The value of extracted silver per employee-=3,500,000,000/1,012,000 = $3458 .
The value of extracted Copper per employee = 3,587,000,000/1,235,000=2904.
Deduct the first from the latter = 3458-2904=554.The value of extracted silver is 5554 higher than the value of
14.On average,l how much value does a Uranium employee in Asia create per week(52 weeks a
year), if the number of Asian Uranium employees comprises approximately 59/0 of the total
number of Uranium employees?
A. 5.3 B. 5,538.26 C. 0.106 D. 287,989.52 E. 106.505 F. 22.44
答案解析:E
First, let's calculate the number of Uranium em ployees in Asia :
1,542.000x0.05=77.100
Next, we need to calculate how much value each Asian em ployee
creates per year by dividing the total value of extracted Uranium in
Asia by the number of employees:
427,000,000/77,100 = 5,538.26
Now, we need to find out how much value each employee creates per
week by dividing the result by 52:
5,538.26/52= 106.505
The answer is 106.505
材料11
第十一组 12题
1.If the rates of changes in Urban:Rural split and population growth in Thailand continue to
2015,approximately how many more people will live in cities compared to 2005?
A. 4.04m B. 8.11m C. 9.72m D. 8.36m E. 13.26m
答案解析:D
Answering this question requires several calculations.First,we can see that from 1995to2005there
was an increase in the Urban:Rural ratio.This relative change from 1/7 to 1/5 actually means
that:
1995:One of every 8 people lives in urban areas, on in decimals:0.125 of the population live in
urban areas.
2005:One of every 6 people lives in urban areas, and in decimals: 0.166of the population live in
urban areas.
*note that when we have a certain ratio A:B it means that the total amount is A+B.Thus,
if we have a ratio of 1:7 it means that the total amount is 1+7=8 and if the ratio is 1:5the
total amount is 1+5=6.
The increase factor is the percentage of the population that lives in northern areas in1995vs.2005:
0.125x increase factor= 0.166
Increase factor= 0.166+0.125
Increase factor= 1.33.
Therefore, in 2015,the urban population will comprise:
1.33 x0.166=0.22 of the total population.
Secondly,the population grew by 2.9% annually. Extending that growth over an additional
10 years would result in: 66.3x 1.029^10= 88.24 million.
We can achieve this calculation on a standard pocket calculator by typing 66.3x 1.029
and then pressing the equality sign (=) ten times.This will duplicate the last component of
the calculation each time the key is pressed.On advanced calculators,there is a power function
that saves the exhausting calculation.
Next we calculate the number of people living in cites in 2015:
Multiply 0.22 by the absolute number of people in 2015
88.24x0.22=19.41 million.
Lastly, keep in mind that you were asked about the change in number of people.The number of
people living in cities in 2005 was:66.3×0.166=11.05 million.
The difference between 2005 and 2015 is:19.41-11.05=8.36 million.
2.In which year and country was the number of literate females the smallest?
A. Thailand 1995 B. Thailand 2005 C. Nepal1995 D. Nepal 2005 E. Cannot say
答案解析:E
The answer can be easily discovered without any calculations.Nepal has fewer people than
Thailand. If there is a similar percentage, Nepal will naturally have a lower number of people
that correspond to that percentage.
Since Nepal has less than half the population that Thailand does,and in 1995had a
similar percentage of literate females which was the lowest of any given time frame,
Nepal will have the lowest number that year.
Note:Always pay attention to the asterisks! In this question, the asterisk provides us with
the ratio of men to women.Without this piece of information, the answer would be Cannot say.
3.If you were to buy and then sell 150,000 of Calico's shares,what is the greatest amount of
profit you could have made?
A. 39,000 B. 51 ,000 C. 72,000 D. 78,000 E. 84,000
答案解析:D
The highest proft can be made by buying at the lowest value, and slling at the highest.
Assuming the lowest point came before the highest during the course of the day, thegreatest possible proft would be (3.41-2.89)*150,000= 78,000.
4.Which company had the lowest absolute percentage change in share price from opening to
closing:
A. Pinks B. calico C. Treiley D. Baegon E. Cannot say
答案解析:D
While we can calculate the change in percentage of the stock price for each company,we could
simply search through the table for a possible option.
We can see that Baegon's difference is the smallest, while it has the second highest opening
stock price of all the companies.Therefore, an educated guess without any calculations would be
that lowest percentage change.
The full calculation is as follows:
Percentage change = (close price-open price)/open price
Pinks:(1.41-1.32)/1.32=0.0681= 6.81%increase
Calico:(2.93-3.27)/3.27=-0.104= 10.4% decrease
Treiley:(1.79-1.63)/1.63= 0.0982= 9.82%
Baegon:(2.51-2.45)/2.45=0.0245= 2.45%
5.If in the following trading day Pinks'share price at closing rises by16.3% and Teiley's
drops by 7.8%,approximately how much would you be left with if you were to both sell
130,000 of Treiley's shares and buy 100,000 of Pinks' at closing tomorrow?
A. 41,000 B. 49,200 C. 50,500 D. 76,500 E. Cannot say
答案解析:C
First find the corrected share prices of the following day:
Pinks: 1.41*(100%+16.3%)=1.41*1.163~1.64.
Treiley: 1.79*(100%-7.8%)=1.79*0.922~1.65
Next we need to find the cost associated with the number of shares.
Selling Treiley's:130,000*1.65= 214,500
Buying Pinks': 100,000*1.64=164,000
Finally we calculate the difference between the two to find the amount lef.
214,500-164,000 = 50,500
6.Approximately how many units of Product D were found defective during production?
A. 1,207 B. 2,233 C. 2,777 D. 1,585 E. 3,570
答案解析:B
From product D 5,467 units were sold.Since 29% of all units produced were found defective,the
remaining 71%compose the portion of the units sold. 5,467/0.71= 7,700
Therefore, the number of defective units is: 7,700*0.29= 2,233.Alternatively, it can becalculated by deducting the number of sellable units from the total: 7,700-5.467= 2,233.
7.Which product has the lowest defective units to total work hours ratio?
A. Product A B. Product B C. Product C D. Product D E. Product E
答案解析:B
This question can be solved without any calculations.The lower the numerator and the higher
the denominator,the lower the ratio will be.We need to look for a product with a high number of
work hours, and a low number of defective units.
Product B has the highest number of work hours.Now look for the number of defective units:
The data in the table shows the percentage of defective units, not the absolute figures.
Product B has one of the two lowest percentages, but a low percentage does not necessarily
mean a low absolute number, However,we do have the absolute figures of the market-worthy
units,and the smallest number does belong to Product B.Therefore we can estimate that Product
B has the lowest total number of units, which means we may in fact assume that the low
percentage of defective units also means a low absolute number.
The full calculation for Product B is as follows:
% of defective units:24%
% of market-worthy units:100%-24%= 76%
Number of market-worthy units: 2,380
lf2,380 are 76% of the units,the total number of units is:
2380/0.76=3,131.58
Defective units are 24% of the total:
3,131.58*0.24= 751.58
The same can be done with the other products.Eventually you will see that Product B has
the lowest number of defective units,and thus the lowest ratio.
8.Next year the company plans to stop making the product that requires the longest amount of
time to produce.Which product will be cut?
A. Product A B. Product B C. Product C D. Product D E. Product E
答案解析:B
In this question we must find the amount of time needed to produce each product.Since the
decision about defective products is made after production has been completed,we can assume
all products of a certain type are produced at the same time, defective or functional.
First we calculate the total number of units produced per year.
For example:Product A:We know from the table that the number of market-worthy units is
6,347.Additionally, since the percentage of defective units from total production is 36%, we can
infer that the 6,347
market-worthy units are 64% of the total production (100%-36%).
Therefore,the total number of units is:
6347/0.64= 9917.19.
Then we calculate how many units of every product are manufactured per hour.
For example: ProductA:9917.19/5462= 1.816
*Note that using your calculator,you can calculate this answer using one step(6347/0.64/5462).
Following the same logic:Product B: 2380/0.76= 3131.58=>3131.58/5736=0.546.
Product C: 2849/0.77= 3700=>3700/4270=0.867
Product D:5467/0.71=7700=>7700/3055=2.52
Product E:3620/0.75= 4826.67=>4826.67/4380= 1.102
Therefore, production will cease on product B.
However, this question can be solved without any calculations simply by examining the
table.Product B has the least amounts of units made, both defective and functional,while having
the highest total work hours, and will therefore have the highest ratio.
9.Based on average consumption, if a driver covered 500 miles for Navut, and 325 miles
for Muto, how many gallons did he end up using?
A. 19.81 B. 7.17 C. 12.31 D. 18.66 E. cannot say
答案解析:D
To find how many gallons were used for this trip, we look at the mileage covered by the driver
with each company and divide it by the fuel consumption specifed for that company.That is
Gallons of fuel used = (distance covered in miles)/ (fuel consumption in km/itre)
Let's see how many gallons were used by the driver while driving for Navut.
1.Let's convert the distance covered by the driver to kilometres:
(500 miles)/(0.62km/mile)=806.45km
2.We now divide by the fuel consumption to get:(806.45km)/(16.4km/litre)=49.17 litres.
3.Now divide by 4.546 to get the amount in gallons.10.82 gallons.
Performing the same operation with the next company (Muto):
1.(325 miles)/(0.62 mile/km)=524.19km
2.(524.19 km)/(14.7 km/litre)=35.66 litres
3.(3566 litre)/4 .546=7.84 gallons
Adding these numbers together:
(7.84+10.81)=18.66 gallons in total.
10.Approximately how much did Hindale and Supai spend on fuel in USD, combined?
A. 2,596 B. 3,235 C. 3,733 D. 4,055 E. 4,585
答案解析:D
We begin by calculating the total expenditure by both companies in GBP,and then converting the
sum to USD.
Hindale: Purchased 286 gallons, at1.03 per litre.
In order to find the total, we can find the price per gallon, by converting the price per litre to per
gallon.
1.03*4.546=4.68
Supai:Purchased 274 gallons,at1.01 per litre.Price per gallonis.1.01*4.546=4.59
Therefore,Hindale paid:286*4.68= 1,338.48
Supai:274*4.59=1,257.66
The totalis 1 ,338.48+1,257.66=2,596.14.
Finally, we convert the sum to USD and find that 2,596.14*1.562 = 4,055.17
11.Assuming Navut has a single delivery route of 150 miles in total, how many delivery
routes did its drivers complete if they used all the fuel that they purchased?
A. 94 B. 96 C. 97 D. 98 E. lnsufficient information
答案解析:B
Navut purchased 312 gallons of fuel, and each car has a fuel consumption of 16.4km/
itre.Translated to miles per gallon,Navut has:16.4*0.62*4.546= 46.22 mpg.
The total number of miles covered by Navut is 312*46.22= 14,420.64 miles
If each route trip is 150 miles, the total number of deliveries would be 14,420.64/150=96.14
Since the number contains a fraction, and rounding it up will result in one incomplete journey,
we must round down to the closest number.
12.Approximately how many miles were covered by Muto's drivers in 2011?
A. 9,452 B. 11,353 C. 12,057 D. 15,752 E. 19,446
答案解析:C
We know the amount of gas purchased by Muto, as well as the average fuel consumption. In
order to find the covered distance, we need to multiply the average consumption by the amount
of gas used.The only thing we have to pay attention to is the unit conversions.
(a)Muto purchased 291 gallons of fuel.Convert to litres:
291*4.546=1,322.89 litres.
(b)Muto averaged 14.7 km per litre.For 1,322.89 liters the distance was:
14.7*1322.89=19,446 48kilometres.
(c)Convert to miles.
19446.48*0.62=12,056.82
材料12
第十二组 12题
1. What would be the overall manufacturing cost to manufacture 435 units of each
product if the manufacturing costs for Calir-type products were to increase by 27%?
A. 723,840 B. 774,578 C. 822,498 D. 860,082 E. None of the above答案解析:C
First we need to add up the individual manufacturing costs, both for the unaltered Bared
products and for the Calir products with a27% increase.This will give us the cost of
manufacturing one unit of each product (a total of five products).Then we will multiply the result
by 435,in order to find the combined cost for 435 units of each product.
Notice that while we can multiply each product's manufacturing cost by its unit number, it is
unnecessary in this case as the number of items is equal per each product- 435.It would be
easier to add the single manufacturing costs first, and then to multiply the overall result by 435:
(408+432)*1.27+236+268+320= 1890.8
1890.8*435=822,498.
2. Which product has the lowest ratio of total costs to sale price?
A. Bared 120 B. Bared 260 C. Bared 450 D. Calir XC E. Calir XR
答案解析:E
This question can be solved by combining all three parts of costs and dividing them by the sale
price.
Total costs Bared 120:236+37+95= 368
Sale price:792
Ratio:368 :792
0.46:1
Total costs Bared 260:268+37+96= 401
sale price:797
Ratio:401 :797
0.51:1
Total costs Bared 450:320+38+130= 808
Sale price:987
Ratio :8o8 : 987
0.82:1
Total costs Calir XC:408+56+240=704
Sale price:1734
Ratio:704:1734
0.41:1
Total costs Calir XR:
432+57+256= 745
Sale price: 2326
Ratio:745:2326
0.32:1
3. When the sale prices of the Calir product line were decreased by 25% (after the table was
generated)65,277 in sales were generated from Calir products in less than 2 weeks. If the sales
ratio of XC to XR units was 3:4 respectively, what is the difference in the number of units sold
between the two product types?
A. 5 B. 18 C. 6 D. 22 E. Cannot say
答案解析:CRemember that ratios do not represent real numbers.We need to find the multiplication factor
which connects us to the real numbers.
In this question,3.4 regresents the ratio between XC and XR unis. This is only the ratio (and not
the real number of XC and XR unis).the real numbers of xC and xR mignt be,respectively: 3 and 4.
or (3*2=)6and(4*2=)8,or (3*10=)30 and (4*10=)40,etc.That is,as long as the ratio 3/4 remains
(6/8m 30140=3/4).
Therefore.we can call the real numbers of XC and XR unit: X*3 and X*4,respectively .If we will
find the value of"×";
we will know the exact number of units.
Let’s look at the entire mathematical expression that represents the data and the solution"x"
0.75*(1734*3X+ 2326*4X)= 65,277
0.75*(14506X)= 65,277
10879.5X=65,277
X=6
*0.75 is the 25% price reduction that applies on both products (100%-25%=75%=0.75).
1734 and 2326 are the prices of ×C and xR units,respectively.
X is the multiplication factor that tells the real number of units sold,instead of just a ratio. In
fact it is also the difference were looking for.
Solving this gives us x=6.When applying the multiplication factor to the basic ratio we get
3*6=18 units of xC
4"6= 24 units of XR
4. Which type of activity consumes the highest amount of energy per week, in calorie
units?
A. Sitting B. Walking C. Running D. cycling E. Cannot say
答案解析:A
We need to calculate the energy expenditure of each activity type,and measure it over the entire
week.
Notice we do not need to change our units to kcal, since we are comparing them to each other,
and multiplying each by the same number will not change the relationship between them.
Also note that Energy Expenditure is measured in joules per minute, not hour, but since all
activities are to be multiplied by 60 minutes, we could actually negelct this factor.
we simply need to multiply:
(hours)'(expenditure per minute)(days)
sitting:8*6*7= 336
Walking:1*21*5= 105Running: 0.75*36*3=81
Cycling: 1.25*2*28=70
Therefore,sitting is the right answer choice.
5. Assuming the average daily energy intake for males is 2450kcal,
approximately how many hours of walking are needed to counteract it?
A. 6.328 B. 7.624 C. 8.135 D. 11.27 E. 13.56
答案解析:C
First we must find the energy equivalent of the daily calorie intake.
2450 kcal = 2450*4.184= 10,250.8 kJ.
Walking consumes 21 kJ per minute.
Per hour the expenditure is 21*60=1,260 kJ per hour.
The number of hours needed to balance the daily calories
intake would be:10,250.8/1,260= 8.135 hours.
6. What is Adam's weekly energy expenditure difference
between walking and cycling, in mega joules?
A. 1.45 B. 2.1 C. 3.6 D. 4.9 E. Cannot say
答案解析:B
We begin by examining each activity before finding the difference between them, and note that
we don't forget to convert units.
Walking: 1 hour = 60 minutes, 5 days a week, 21 kJ per minute.
Total expenditure is:5*21*60 = 6,300 kJ.
Cycling: 1.25 hours = 75 minutes, twice a week,28 kJ per minute.
Total expenditure is:2*28*75= 4,200 kJ
The relation between kilojoule and mega joules is 1 MJ= 1,000 kJ
Therefore, the answer will be 6.3-4.2=2.1 MJ.
7.Given that one megabyte equals 1024 kilobytes, what is the size difference between an
average
file downloaded in February to an average file downloaded in May, in thousands of bits?
A. 1,258.291 B. 1,356,999 C. 1,288.8 D. 1,288,800 E. Cannot say
答案解析:A
We need to calculate the difference between average files size in February and May.
The important thing to remember here is to pay attention to the unit conversions:
Average size in February: 3.4 megabytes.
Average size in May: 3.25 megabytes.(a)The difference in megabytes (MB):
3.4-3.25=0.15 MB
(b)Convert to kilobytes
The question states that 1 MB= 1024 kilobytes.Therefore,0.15 MB is equal to:
0.15*1024= 153.6 kilobytes.
(c)Convert to bits:
According to the table,1 kilobyte = 8192 bits.Therefore,153.6 kilobytes equal to:
153.6*8192=1,258,291 bits.
Now, divide by a thousand to get 1258.291 thousands of bits.
8.Given that one megabyte equals 1024 kilobytes,what is the increase in average file size
(in kilobytes) in June compared to May, if the absolute increase in average file size seen
between April and May continues?
A. 1,945 B. 55.5 C. 210.60 D. 94.56 E. 194.56
答案解析:E
In April the average file size was 3.06 megabytes, while in May it was 3.25megabytes.This is a
0.19 megabyte difference.
Since the same amount of growth occurs in the following month, we need only calculate the
equivalent size in kilobytes.
We know that 1 megabyte is 1024 times greater than 1 kilobyte.
0.19*1024= 194.56 kilobytes
9.How many grams of dietary fibre should a person who follows a 2000 calorie-diet:
consume if he already ate an entire container of product x today?
A.22 B. 13 C. 19 D. 8 E. Cannot say
答案解析:B
The table indicates nutritional values per one serving size of productX and not per the whole
container
The whole container has four servings, and thus one serving equais one quarter.
one serving contains 3 grams which constitute 12% of the daily recommended amount.A person who eats a whole container of product x consumes (3*4)=12 grams.
Tip: Dividing a certain partial amount by its relative size will always give the total amount!
Since 3 grams represent 12%,or0.12 of the total amount, we can divide 3
by 0.12 to get the full amount required:3/0.12=25.
Since he ate 12 grams, he still needs to eat(25-12)=13 grams of dietary fibre.
To get a full review of percentages practice with our numerical reasoning packs!
10.How many calories originated in fat will be consumed when eating 1.5 cups of
product x?
A. 120 B. 135 C. 45 D. 90 E. Cannot say
答案解析:D
The table indicates nutritional values per one serving size of product X,
which is equivalent to half a cup.
Each half cup of Product x contains 30 calories from fat.
Eating 1.5 cups of Product X will result in the consumption of (30*3)=90 calories
11. Approximately what is the population of Malawi in 2010?
A. 14,086,702 B. 15,831,663 C. 16,125,500 D. 16,800,000 E. 17,250,225
答案解析:B
Dividing the total number of deaths by the death rate, and then multiplying by 100,000 gives the
population size:
(15,800/99.8)*100,000=15,831,663
12.In the past 20 years, which country has shown the greatest relative change in mortality rate?
A. Nigeria B. Malawi C. Tanzania D. South Africa E. Cannot say
答案解析:D
This question should best be answered by estimating, rather than calculating, in order to save
precious time.
In this case,South Africa shows a big absolute difference between the two periods, which makes
it easier to spot the greatest change:
(216.15-148.16)/216.15=31%
For the remaining countries:
Nigeria = 4%
Malawi = 27%Tanzania = 21%
A good tip for using estimations in percentage questions is found in our numerical reasoning tips
video tutorial.
材料13
第十三组 12题
1.In 2010 there were 5,880,483 more women than men.What was the total GDP?
A. 333,450,000 B. 257,831,770 C. 512,475,987 D. 490,887,252 E. 527,479,325
答案解析:E
According to .the table.the gender rate in 2010js 44.%:56%.
This means that the 5,880 483 corresponds to the difference between the genders
(0.56-0.44=0.12)[i.e.= 12%].
5,880,483/0.12=49,004,025, which is the population of 2010.
49.004.025*10.764=527.479,325
2.What is South Africa's total area if total GDP in 2000 is $425,872,765.6?
A. 1,219,090km² B. 1,219,160 km² C. 984,193km² D. 984,192 km² E. Cannot say
答案解析:B
The correct answer is (B).
The question requires you to find South Africa’s total area, whilst only the total GDP for
that year is given.
The 'Densiy' row states that here are 35.82 persons per sq km.Therefore, if the number
of people is known, you can easily find the area, by dividing the population by 35.82.
Sgt Afisas
P9.752=436738.
ulated through the GDP.It is given that the GDP per capita is $9.752.If tfe total GDP is
s425.872,765,the populaion of South Aricais
After determining the populatin, you can proceed to finding the area. I there are 35.82
persons per sq. km, and the population is 43.670,300, the area is 43,670,300+ 35.82=
1,219.,160 km-
Note:The calculations in this question are based on the subject of ratios.
ins;1sqkm
For more practice, watch the Ratio and Table and Table and Graph Analysis video tutorials
and solve the Ratios Dills.3.Given that the HIV rate in urban areas in 2010 was 320 per 1000, what was that year's
HIV rate(per 1000) in rural areas?
*Assume that HIV is equally distributed throughout different areas in South Africa.
A. 220 B. 280 C. 240 D. 200 E. Cannot say
答案解析:A
First. notice that the overall HlV.rate in 2010 is 240 per,1000.This rate is.composed of the urban
and rural populations.
-urban to rural population ratio is 1:4,which means a total of5 ratio units.So each population has'
A ailerent weignt in the overal rate.ana we are looking for value or the rural popuagon.
Te value df i uroai bopuiationis already given tb us.320.Now We tan calituilati this like a weighted
average.
We will multiply each value by its proper weight, and divide by the sum of weighs:
339,+4*X)/5=240:
x=220.
There is a shorter way of analvsina this auestion. bv measuringa the diference between the rural
rate and the overall weiahted ral.
one uroan ratio unitequals 320,wWhlle tour remaining ratio units nave managed to decrease the
summed
up value by 80 (320-240=80),hence each rato unit equals 240-(804)=220.
4.Approximately what is the % change in profit per unit when a12.5% discount is given for
purchasing 150 units of Houston A?
A. 13 B. 16 C. 23 D. 18 E. 14
答案解析:C
When a discount is given, the proft per unit is reduced while the costs remain constant.
The fxeg g are (sale 8928238319.16=16.14
New proft per unit:30.8875-16.14=14.7475
The percentage change in profits: 1-(14.7475/19.16)*100=23%
Notice that there is no need to consider 150 units, as a single unit is suficient for
calculating the loss in proft.er.is agtther, shgter way to solve this question, if you realise that the percentage change
correlates with the discount value.Thus, we can calculate the absolute discount value:
28818235 old proftper unit value
5.What is the minimum number of Ramon 2 units that must be sold in order to equal the
profit made from selling 25 Ramon 1 units, after a 13% increase in Ramon 1's profit?
A. 23 B. 24 C. 25 D. 26 E. 27
答案解析:C
First.calculate the profit of selling 25 Ramon 1 units after
a 13% increase:
25x1.13x63.4=957.11
This.sum should egual the profit made by selling a number
of Ramon 2 units.
Let this number be represehted by s.
38.8*s=957.11
S=957.11/38.8
s=24.66
Since it is more than 24 units, it must be counted as 25.
6.Which product has the highest calibration cost, relative to its total cost?
A. Houston A B. Houston AA C. Houston AA+ D. Ramon 1 E. Ramon 2
答案解析:B
In order to solve the question, we need to follow 3 steps:
1.For each product. we need to find the total cost price per unit
(sale price per unit)-(profit per unit).
2.Next.we feed to 'divide the calibration cost
Of each product by its total cost price.
3.Finally. we need to look for the biggest result
which'represents the highest'calibration cost relative to total costs).
Houston A:0.34/(135.3-19.16)=0.021
Houston:0.75/(39.2-19.55)=0.038
Houston AA+:0.012/(42.7-23.388)=0.0006
Houston 1:0.92/(63.4-33.88)=0.031
Houston 2:1.1/(82.4-38.8)=0.025
Therefore,the correct answer is Houston AA.7.Which year had the lowest cost of sales relative to revenue values?
A. 2006 B. 2007 C. 2008 D. 2009 E. 2010
答案解析:E
8.What were the operating expenses in 2005 if in 2006 gross profit increased by 10% and
operating profit by 15%?
A. 3068.8 B. 3120.9 C. 2774.1 D. 2940.7 E. Cannot say
答案解析:A
Since the profits and expenses are given only in 2006,you can find the 2005 values using the
percent changes from the question.
Let the gross profit of 2005 be x.
gross profit of 2005-x 100%
gross profit of 2006-8979.4 110%
The gross profit of 2005 was 8,163.10.
Similarly, let the operating profit of 2005 be x.
Operating profit of 2005-x 100%
Operating profit of 2006-5,858.5 115%The operating profit of 2005 was 5,094.30
Operating expenses:8,163.10-5,094.30=3,068.80
9.If operating expenses in 2010 were 5% higher, approximately what would be the net
profit of that year?
A. 3339 B. 3196 C. 3235 D. 3506 E. 3421
答案解析:C
2010's Operating, expensesi
New opefating expeh
=3014
New operating profit
?92-8248=
Tax is a fixed percentage of the operating profit= 27%
Net profit(after tax):4431*0.73=3234.6~3235
10.Which of the four cities had the biggest average cost per person last year?
A. Geremaia B. Klara City C. Northern Core D. White Castle E. Not enough information
答案解析:C
Given the percent changes from last year,calculate the average expenditures.
Northern Core's is highest: 55/1.06=51.88
11.12,000 people per month spend their time at bars in Northerm Core, and 2,000 people
per month do the same in Klara City. What is the female annual bars costs difference
between the two cities ffemales spend 50% of the average monthly cost at bars?
A. 293,700 B. 795,300 C. 1,762,200 D. 9,543,600 E. 6,019,200
答案解析:C12.If 10% of the bars in White Castle close and 20% of the clubs in Geremaia close, what
will be the ratio between all businesses in White Castle and Geremaia respectively?
A. 346:171 B. 342:692 C. 171:692 D. 264:132 E. None of the above
答案解析:A
In this question we must first find the total number of active businesses left in each city.
In Geremaia:[140+(15*0.8)+190]=342
This gives US a ratio of 692:342.
In grder to find,the correct ratio we must first place White Castle and then Geremaia, in
that order.Notice it is specifed in the question, and it is the point behind distractor B.
Removing the greatest common divisor of 2 gives us the answer 346:171.

