 夜雨聆风
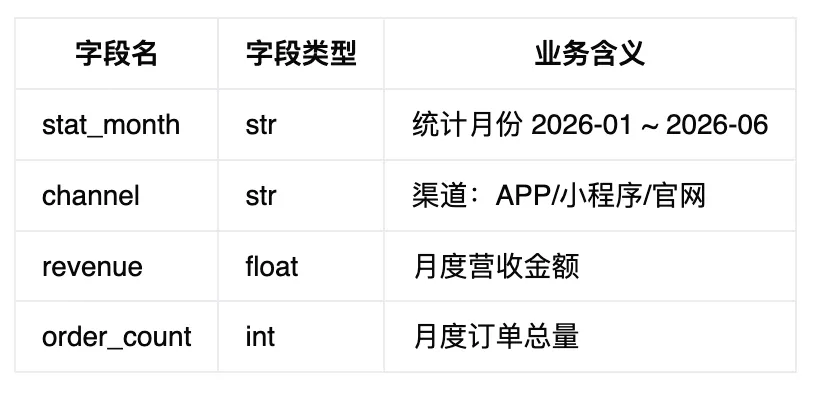
夜雨聆风① 字段含义说明
② 生成多渠道测试数据
import pandas as pdimport numpy as npmonth_list = ["2026-01","2026-02","2026-03","2026-04","2026-05","2026-06"]channel_list = ["APP","小程序","官网"]df_list = []for chan in channel_list:temp = pd.DataFrame({"stat_month": month_list,"channel": [chan]*6,"revenue": np.random.uniform(80000, 180000, 6).round(2),"order_count": np.random.randint(300, 1200, 6)})df_list.append(temp)df_all = pd.concat(df_list)# 分Sheet写入Excelwith pd.ExcelWriter("channel_month_sales.xlsx", engine="openpyxl") as writer:for chan in channel_list:sub = df_all[df_all["channel"] == chan]sub.to_excel(writer, sheet_name=chan, index=False)print("多渠道分Sheet销售数据生成完成")
③ 核心PDF批量导出代码
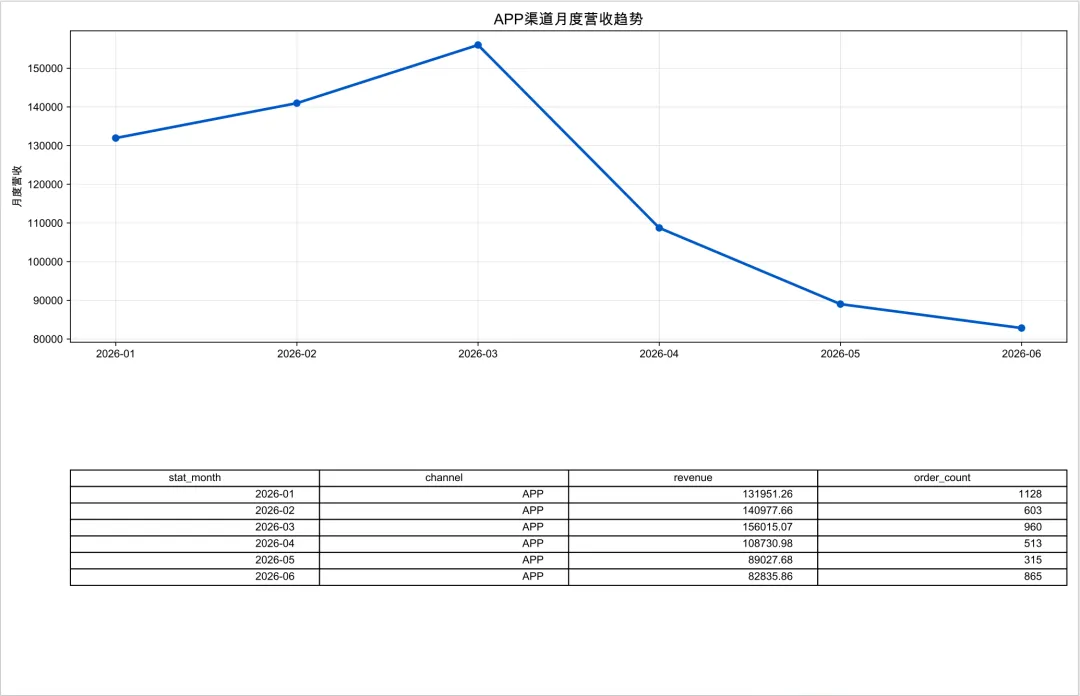
import pandas as pdimport matplotlib.pyplot as pltfrom matplotlib.backends.backend_pdf import PdfPagesplt.rcParams['font.sans-serif'] = ['Arial Unicode MS','SimHei']# 读取Excel全部工作表excel_file = pd.ExcelFile("channel_month_sales.xlsx")sheet_names = excel_file.sheet_names# 创建PDF文件,循环多页输出with PdfPages("渠道月度销售汇报.pdf") as pdf:for sheet in sheet_names:df = pd.read_excel("channel_month_sales.xlsx", sheet_name=sheet)# 新建画布:上半部分图表,下半部分表格fig, (ax1, ax2) = plt.subplots(2, 1, figsize=(14,9), dpi=100)# 绘制营收趋势折线图ax1.plot(df["stat_month"], df["revenue"], marker="o", linewidth=2.5, color="#1f56bd")ax1.set_title(f"{sheet}渠道月度营收趋势", fontsize=14)ax1.set_ylabel("月度营收")ax1.grid(alpha=0.3)# 表格绘图table = ax2.table(cellText=df.values, colLabels=df.columns, loc="center")table.auto_set_font_size(False)table.set_fontsize(10)ax2.axis("off")plt.tight_layout()pdf.savefig(fig)plt.close()print("多渠道图表+明细PDF报表导出完成")
总结
借助PdfPages实现多页PDF自动化生成,将可视化图表与原始明细表格整合输出,替代手动截图、导出Excel再转PDF的繁琐流程,适合月度、季度固定汇报文件自动化产出。