文档内容
Guidelines
Welcome to the first step of the recruitment process at Bain & Company, Inc. You are about to
get a firsthand experience on practical Bain casework. The test is based on modified Bain cases
and is designed to assess your approach to problem solving using strategic thinking and deductive
reasoning. At Bain, we are more interested in ‘how you think’ rather than ‘what you’ve learnt’.
We work on diverse complex situations spanning across multiple industries and sectors, but
present only concise, relevant information to our clients. In order to do the same, we understand
the data, interpret the insights, and finally present what we infer in an organized manner. This
test is designed to simulate the same experience for you!
While attempting this paper:
Understand: Read the case studies carefully and identify the underlying problem. Make sure
you do not leave out any inputs or key data points
Interpret: Focus on details in the text and charts. Pay attention to the period of analyses and
units used
Structure your approach: Manage your time by answering the questions smartly. For instance,
some questions do not require calculations but only involve simple elimination of choices. Always
do a quick check before answering
Instructions
This booklet consists of 25 questions with multiple choices. Each question has a single correct
answer
It not necessary to answer all questions. You may attempt these questions according to your
strengths and time. Read the question extremely well and attempt it only when you have fully
understood what is to be done
Use of any electronic devices (calculators, mobile phones, etc.) is strictly prohibited while
answering the test
You have 60 minutes to complete the test. Keep your composure and best of luck!Case 1
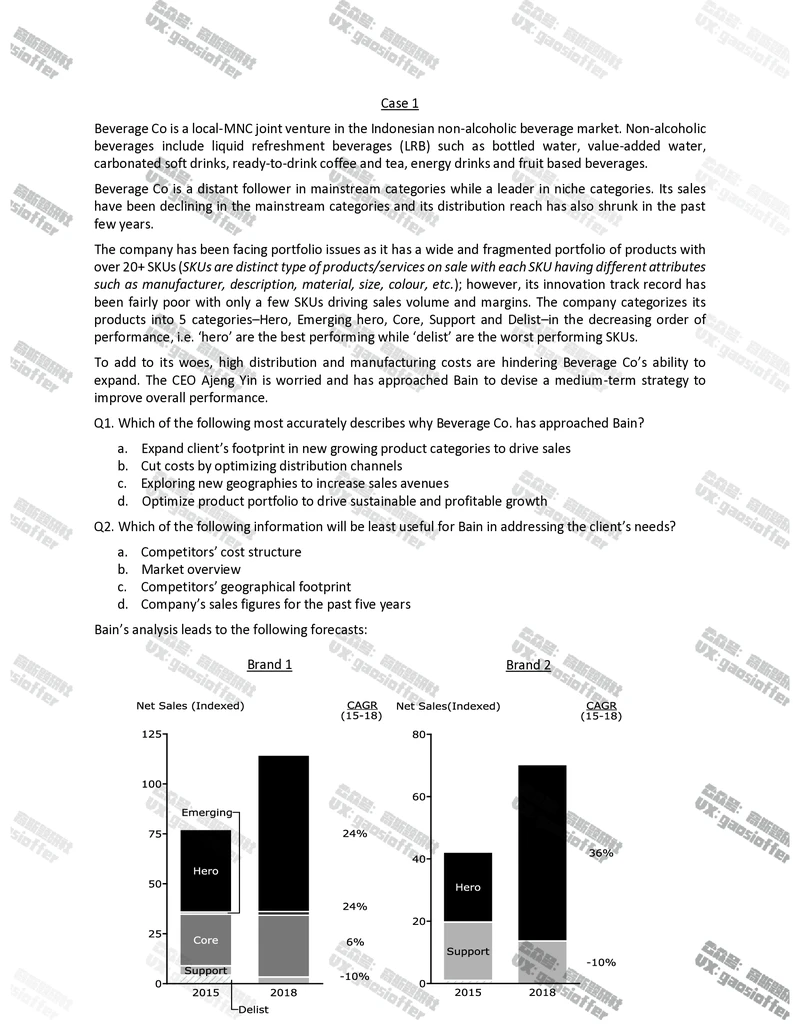
Beverage Co is a local-MNC joint venture in the Indonesian non-alcoholic beverage market. Non-alcoholic
beverages include liquid refreshment beverages (LRB) such as bottled water, value-added water,
carbonated soft drinks, ready-to-drink coffee and tea, energy drinks and fruit based beverages.
Beverage Co is a distant follower in mainstream categories while a leader in niche categories. Its sales
have been declining in the mainstream categories and its distribution reach has also shrunk in the past
few years.
The company has been facing portfolio issues as it has a wide and fragmented portfolio of products with
over 20+ SKUs (SKUs are distinct type of products/services on sale with each SKU having different attributes
such as manufacturer, description, material, size, colour, etc.); however, its innovation track record has
been fairly poor with only a few SKUs driving sales volume and margins. The company categorizes its
products into 5 categories–Hero, Emerging hero, Core, Support and Delist–in the decreasing order of
performance, i.e. ‘hero’ are the best performing while ‘delist’ are the worst performing SKUs.
To add to its woes, high distribution and manufacturing costs are hindering Beverage Co’s ability to
expand. The CEO Ajeng Yin is worried and has approached Bain to devise a medium-term strategy to
improve overall performance.
Q1. Which of the following most accurately describes why Beverage Co. has approached Bain?
a. Expand client’s footprint in new growing product categories to drive sales
b. Cut costs by optimizing distribution channels
c. Exploring new geographies to increase sales avenues
d. Optimize product portfolio to drive sustainable and profitable growth
Q2. Which of the following information will be least useful for Bain in addressing the client’s needs?
a. Competitors’ cost structure
b. Market overview
c. Competitors’ geographical footprint
d. Company’s sales figures for the past five years
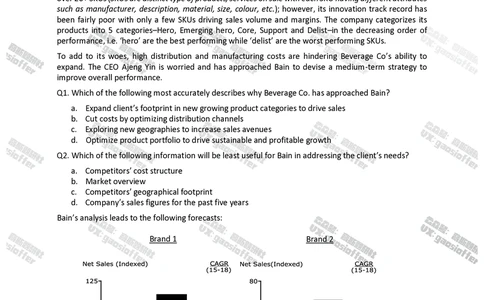
Bain’s analysis leads to the following forecasts:
Brand 1 Brand 2Q3. The above forecast is based on three sequential modules.
1. Focus the sales force on select SKUs
2. Determine product mix that fits shoppers’ needs
3. Analyst the improvement in margins through greater volume sales
What according to you was the most likely sequence that Bain followed to crack Beverage Co’s issues?
a. 1 →2→3
b. 3→2→1
c. 3→1→2
d. 2→ 1→3
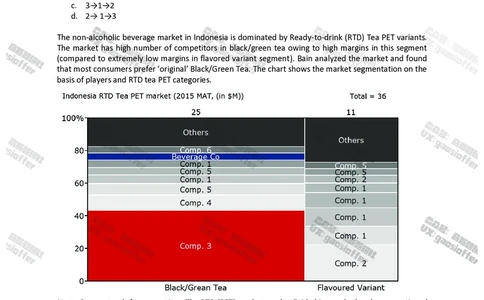
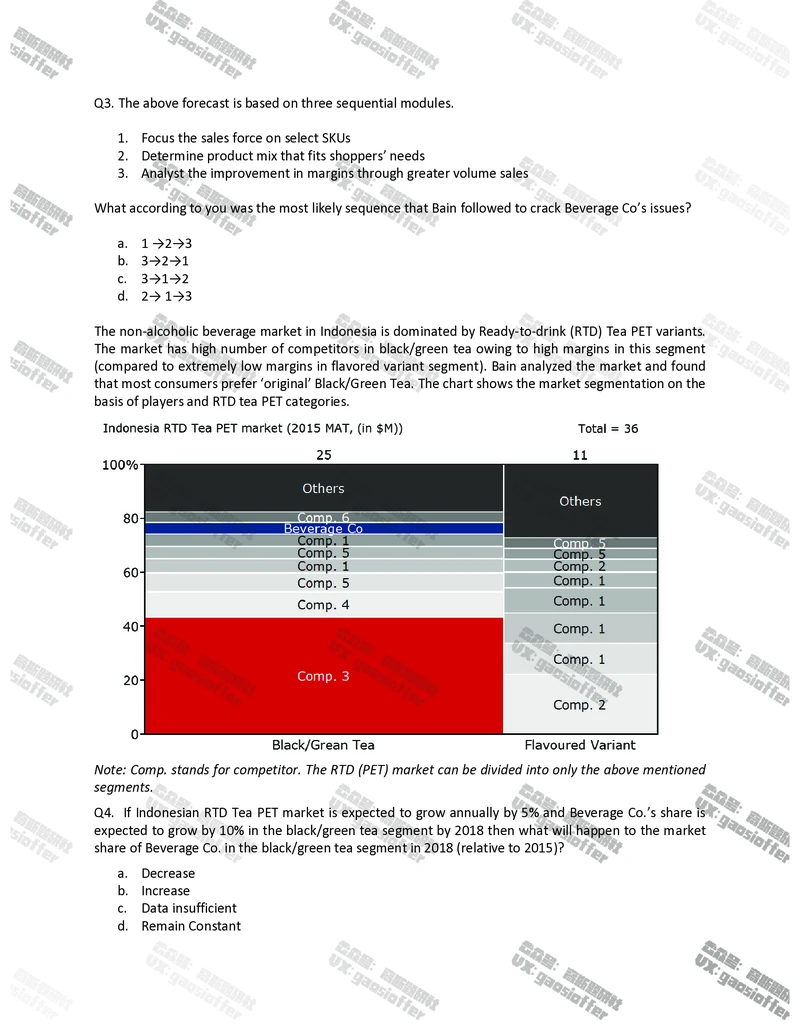
The non-alcoholic beverage market in Indonesia is dominated by Ready-to-drink (RTD) Tea PET variants.
The market has high number of competitors in black/green tea owing to high margins in this segment
(compared to extremely low margins in flavored variant segment). Bain analyzed the market and found
that most consumers prefer ‘original’ Black/Green Tea. The chart shows the market segmentation on the
basis of players and RTD tea PET categories.
Note: Comp. stands for competitor. The RTD (PET) market can be divided into only the above mentioned
segments.
Q4. If Indonesian RTD Tea PET market is expected to grow annually by 5% and Beverage Co.’s share is
expected to grow by 10% in the black/green tea segment by 2018 then what will happen to the market
share of Beverage Co. in the black/green tea segment in 2018 (relative to 2015)?
a. Decrease
b. Increase
c. Data insufficient
d. Remain ConstantQ5. If it is known that competitor 3 is the market leader in black/green tea and offers 10 different SKUs in
the same segment, which of the following will most likely not be the potential course of action for
Beverage co?
Assumptions:
1) Beverage co has SKUs across all the top 3 performing categories (hero, emerging hero, core) in
Black/ Green tea segment
2) Beverage co has presence throughout Indonesia whereas competitor 3 is present only in highly
populated areas of Indonesia
3) Black/green tea shoppers are increasingly getting price sensitive
a. Focus on producing new ‘hero’ SKUs or upgrading ‘non-hero’ SKUs to ‘hero’ in the black/green
tea segment
b. Divert resources to flavored variants segment to develop market leadership there
c. Follow price leadership strategy for ‘hero’ SKUs to gain market share
d. Both a and c
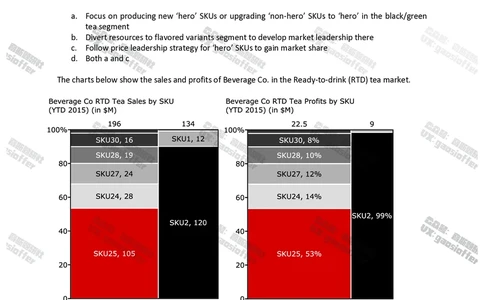
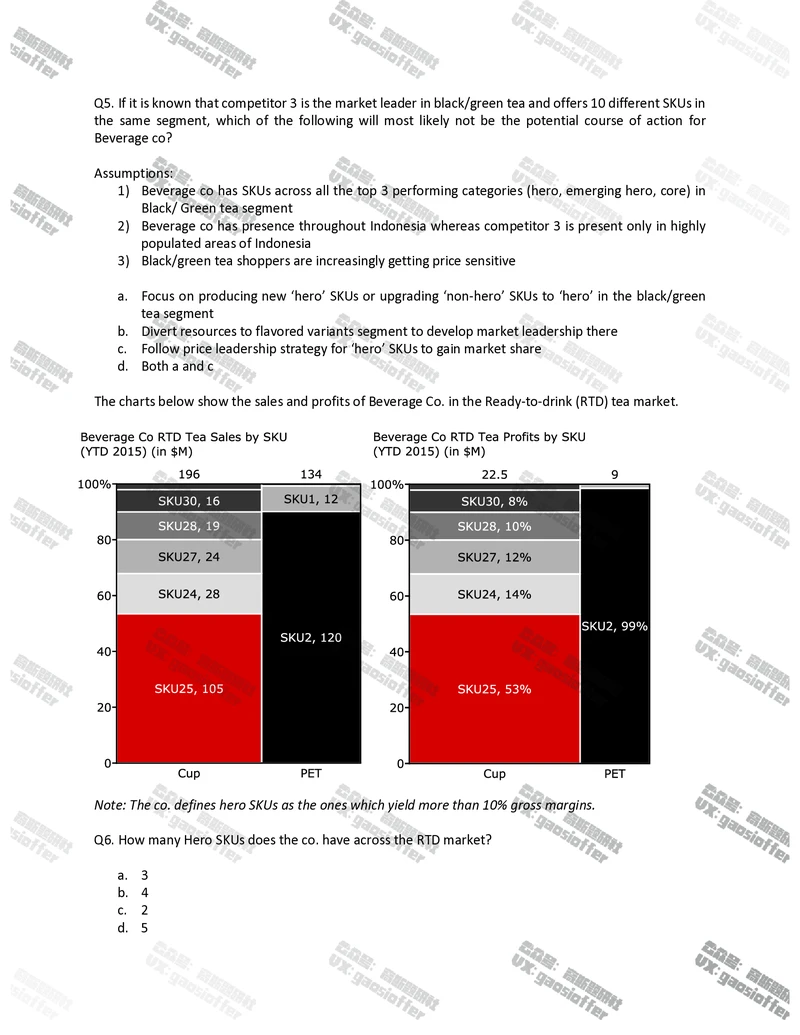
The charts below show the sales and profits of Beverage Co. in the Ready-to-drink (RTD) tea market.
Note: The co. defines hero SKUs as the ones which yield more than 10% gross margins.
Q6. How many Hero SKUs does the co. have across the RTD market?
a. 3
b. 4
c. 2
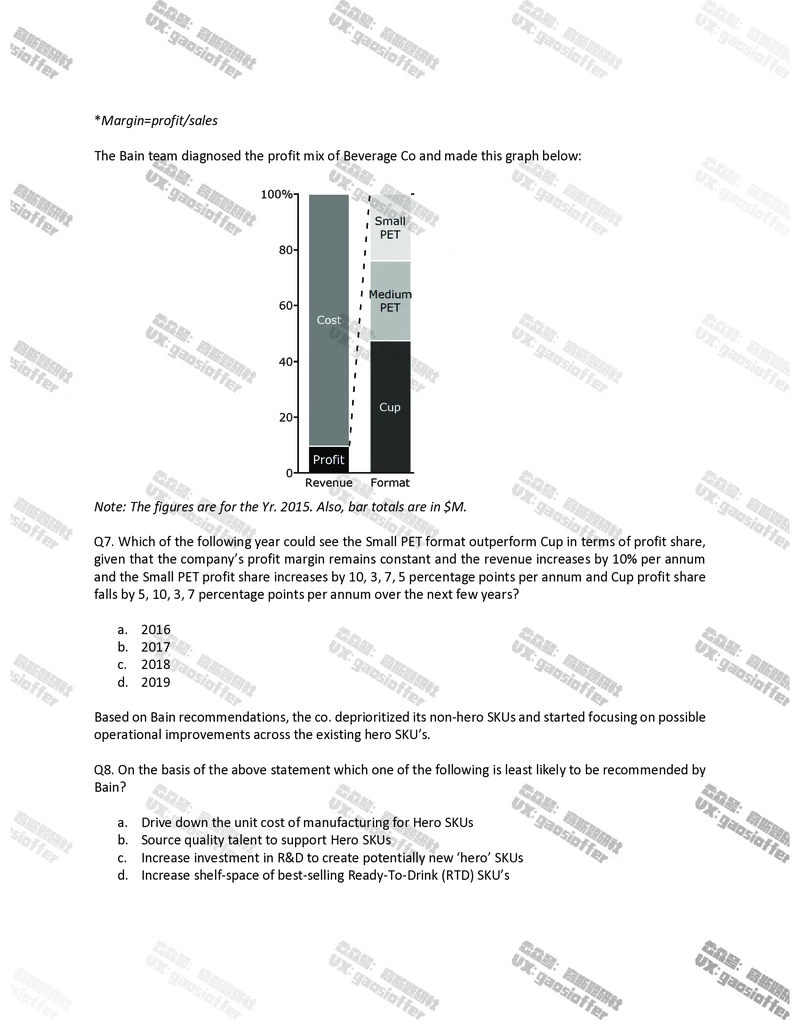
d. 5*Margin=profit/sales
The Bain team diagnosed the profit mix of Beverage Co and made this graph below:
Note: The figures are for the Yr. 2015. Also, bar totals are in $M.
Q7. Which of the following year could see the Small PET format outperform Cup in terms of profit share,
given that the company’s profit margin remains constant and the revenue increases by 10% per annum
and the Small PET profit share increases by 10, 3, 7, 5 percentage points per annum and Cup profit share
falls by 5, 10, 3, 7 percentage points per annum over the next few years?
a. 2016
b. 2017
c. 2018
d. 2019
Based on Bain recommendations, the co. deprioritized its non-hero SKUs and started focusing on possible
operational improvements across the existing hero SKU’s.
Q8. On the basis of the above statement which one of the following is least likely to be recommended by
Bain?
a. Drive down the unit cost of manufacturing for Hero SKUs
b. Source quality talent to support Hero SKUs
c. Increase investment in R&D to create potentially new ‘hero’ SKUs
d. Increase shelf-space of best-selling Ready-To-Drink (RTD) SKU’sCase 2
Chemical Co. is a global specialty chemicals company operating in 16+ distinct businesses. Its profit and
market value doubled during 2005-10, though the revenues remained flat. Chemical Co. aspires to double
its revenue over the next five years by 2015.
To achieve this target, the CEO of Chemical Co. approached Bain. As a Bain AC your job is to clearly
understand the businesses that Chemical Co. operates in, define the core business that accounts for
majority of Chemical Co’s profit, identify a strategy for its core business to take it to its full potential and
identify opportunities in near adjacencies.
Q1. Based on the information given in the paragraph, which of the following statements aptly describe
one of Bain and Co.’s objectives?
a) To analyze the specialty chemicals market and look for acquisitions
b) To understand the scope for development of underperforming businesses
c) For a radical restructuring of their businesses
d) To identify growth opportunities in core business and adjacencies
Q2. Which of the following information will be least useful for Bain in addressing the client’s needs?
a) List of businesses wherein Chemical Co. operates
b) New technologies that Chemical Co. would need to develop to serve new markets
c) Attractive markets where Chemical Co. could serve their current customers
d) Profit contribution from various business units
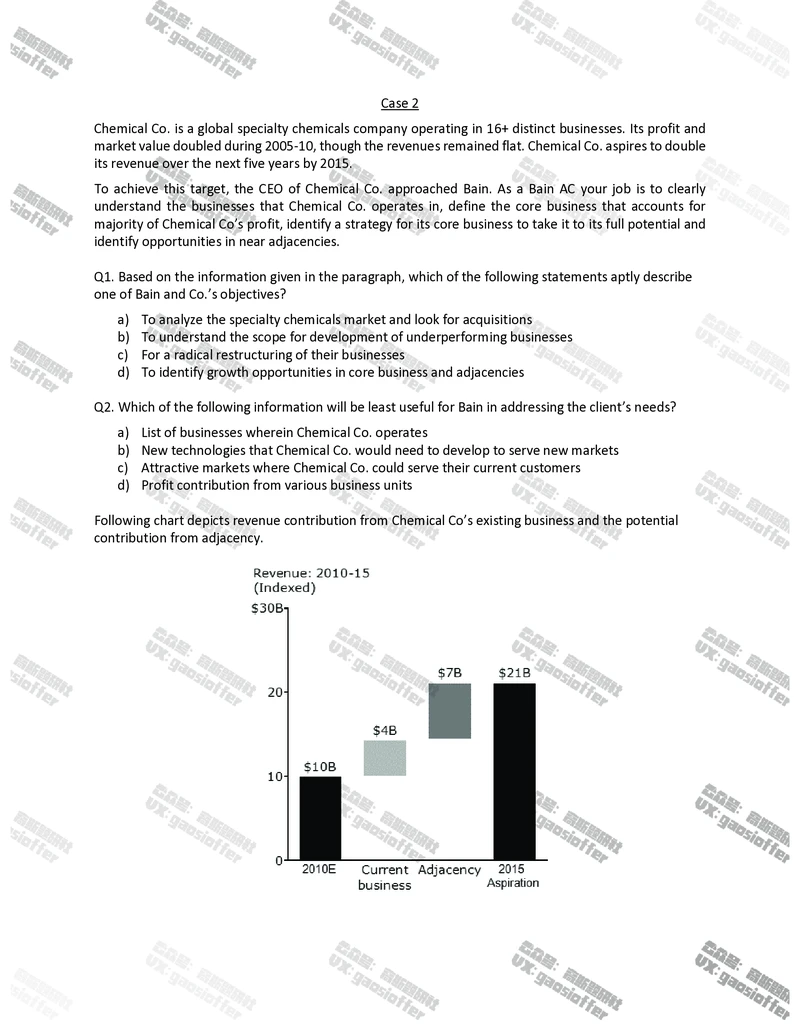
Following chart depicts revenue contribution from Chemical Co’s existing business and the potential
contribution from adjacency.Q3. Based on the above chart, calculate the 1st year revenue from adjacencies if the adjacency business
is to grow at a CAGR = 25%.
a) $ 1.6B
b) $ 2.9B
c) $ 3.2B
d) $ 4.8B
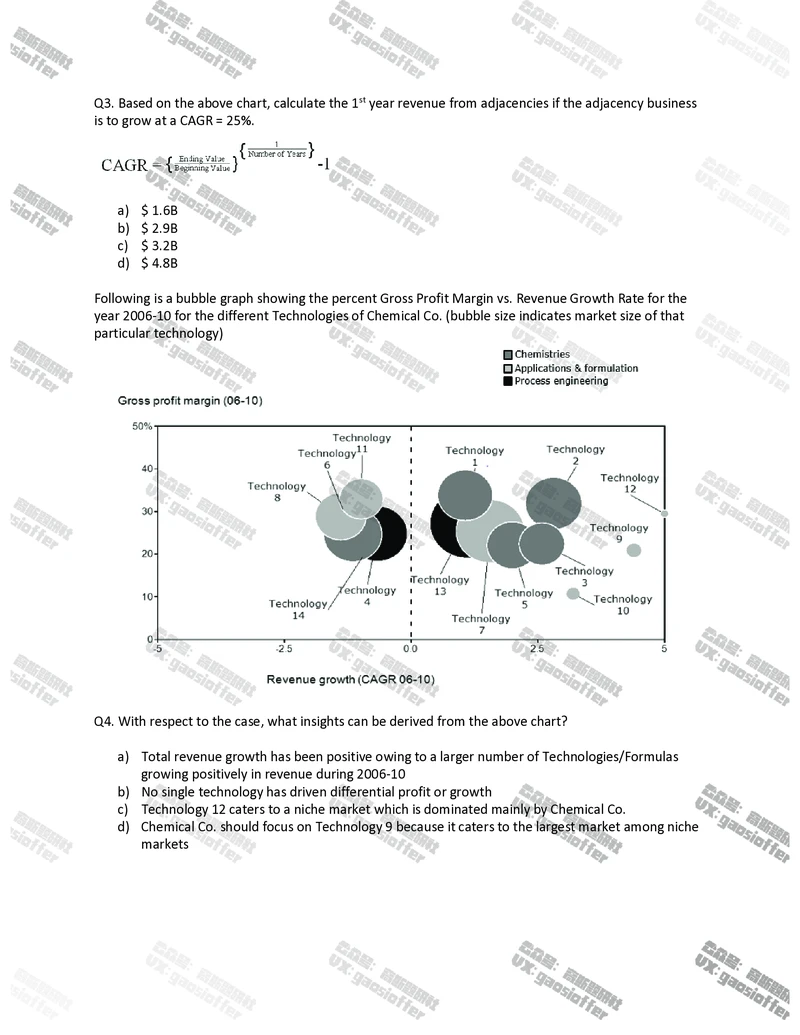
Following is a bubble graph showing the percent Gross Profit Margin vs. Revenue Growth Rate for the
year 2006-10 for the different Technologies of Chemical Co. (bubble size indicates market size of that
particular technology)
Q4. With respect to the case, what insights can be derived from the above chart?
a) Total revenue growth has been positive owing to a larger number of Technologies/Formulas
growing positively in revenue during 2006-10
b) No single technology has driven differential profit or growth
c) Technology 12 caters to a niche market which is dominated mainly by Chemical Co.
d) Chemical Co. should focus on Technology 9 because it caters to the largest market among niche
marketsThe following chart was made by Bain to understand the percent gross profit margin of each of Chemical
Co’s businesses (width of the bars is indicative of revenue contribution of each business to total
revenue).
Q5. From the chart above, which business nets maximum profit per dollar of revenue?
a) Business 3
b) Business 1
c) Business 9
d) Business 4
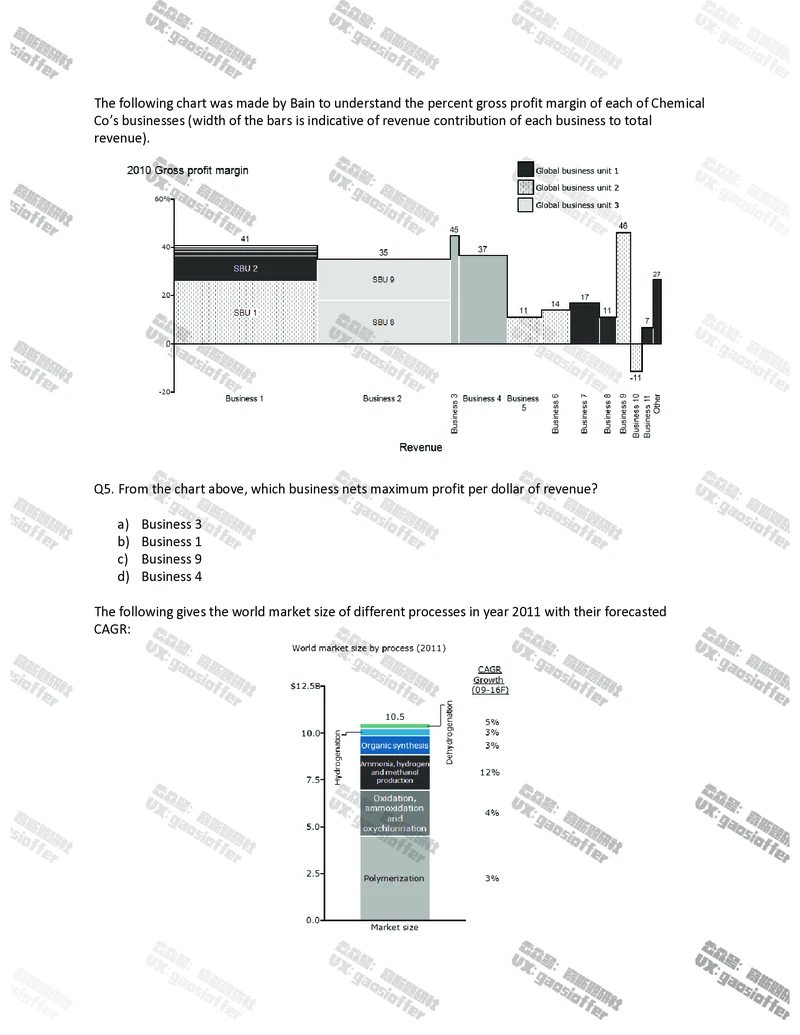
The following gives the world market size of different processes in year 2011 with their forecasted
CAGR:Q6. Based on chart above, in what year will the ‘Ammonia, Hydrogen and Methanol’ production
worldwide market size overtake the ‘Oxidation, ammoxidation and oxychlorination’ worldwide market
size?
a) 2013
b) 2020
c) 2015
d) 2022
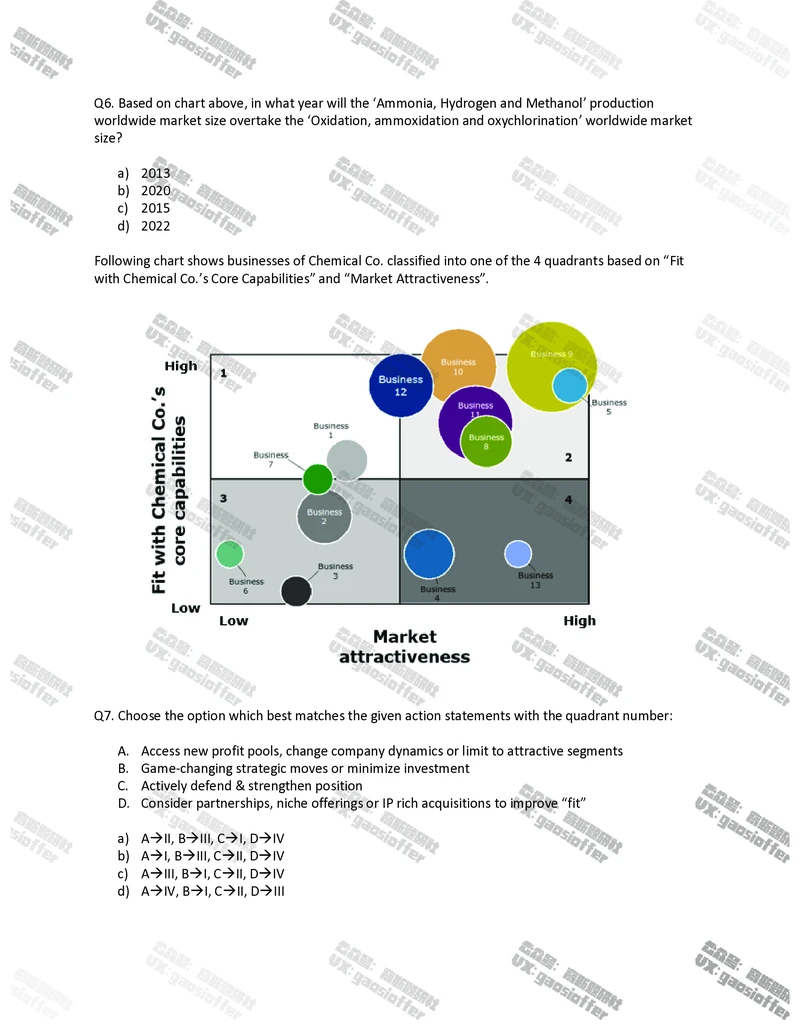
Following chart shows businesses of Chemical Co. classified into one of the 4 quadrants based on “Fit
with Chemical Co.’s Core Capabilities” and “Market Attractiveness”.
Q7. Choose the option which best matches the given action statements with the quadrant number:
A. Access new profit pools, change company dynamics or limit to attractive segments
B. Game-changing strategic moves or minimize investment
C. Actively defend & strengthen position
D. Consider partnerships, niche offerings or IP rich acquisitions to improve “fit”
a) AII, BIII, CI, DIV
b) AI, BIII, CII, DIV
c) AIII, BI, CII, DIV
d) AIV, BI, CII, DIIIQ8. What questions are likely to be focused on by a Bain consultant while devising a strategy for
adjacency opportunities? (Choose the best option)
1. What adjacencies should Chemical Co. invest in?
2. When to ramp up the investment and when to reduce/eliminate support?
3. If distantly related industries such as Paints be a good option for Chemical Co. to get into?
4. If capability in terms of teams and leaders available with Chemical Co to manage the
adjacencies?
a) 1, 2 and 3
b) 1, 2 and 4
c) 1, 2, 3 and 4
d) 1 and 4Case 3
HealthMax operates in the healthcare insurance industry in Brazil and has a considerable market share
in the Brazilian market with a number of products across most of market segments. Four years ago it
created a new product to enter the low end segment, but results were far from expected so it had to
exit the market.
The company believes that low-end segment is expected to grow faster than other segments in the
coming years as there has been a growth of 57% from 2009 to 2015 in the number of people that use
some kind of private health care services. The company now wants to reenter the low end market and
aspires to gain greater market share against its competitors.
Meanwhile, the leading health insurance companies that play in the intermediate and premium
market segments have strengthened their positions through acquisitions over the last 5 years and the
market is getting more and more concentrated. Moreover, a significant decline in profitability is also
projected for the traditional intermediate and premium segments due to future reductions in financial
revenue as a result of interest rate reductions, adding pressure on the business to find alternative
revenue streams for growth. In light of this Ana Luiza, CEO, has asked Bain to help them grow and
achieve their medium term goals.
Q1. Based on the information given in the paragraph, which of the following statements most aptly
describes overall Bain and Co.’s objective?
a. Devise new product for the company by innovating the older product
b. Create market leadership strategy in the health insurance industry
c. Develop market entry and positioning strategy in the target market segment
d. Plan attractive market segments in healthcare industry for creating a new offering
Q2. Which of the following information will be least useful for Bain in addressing the client’s needs?
a. Low end market growth drivers
b. Factors limiting low end market growth
c. Margins from HealthMax’s different products
d. Competitors’ product portfolio in low end market
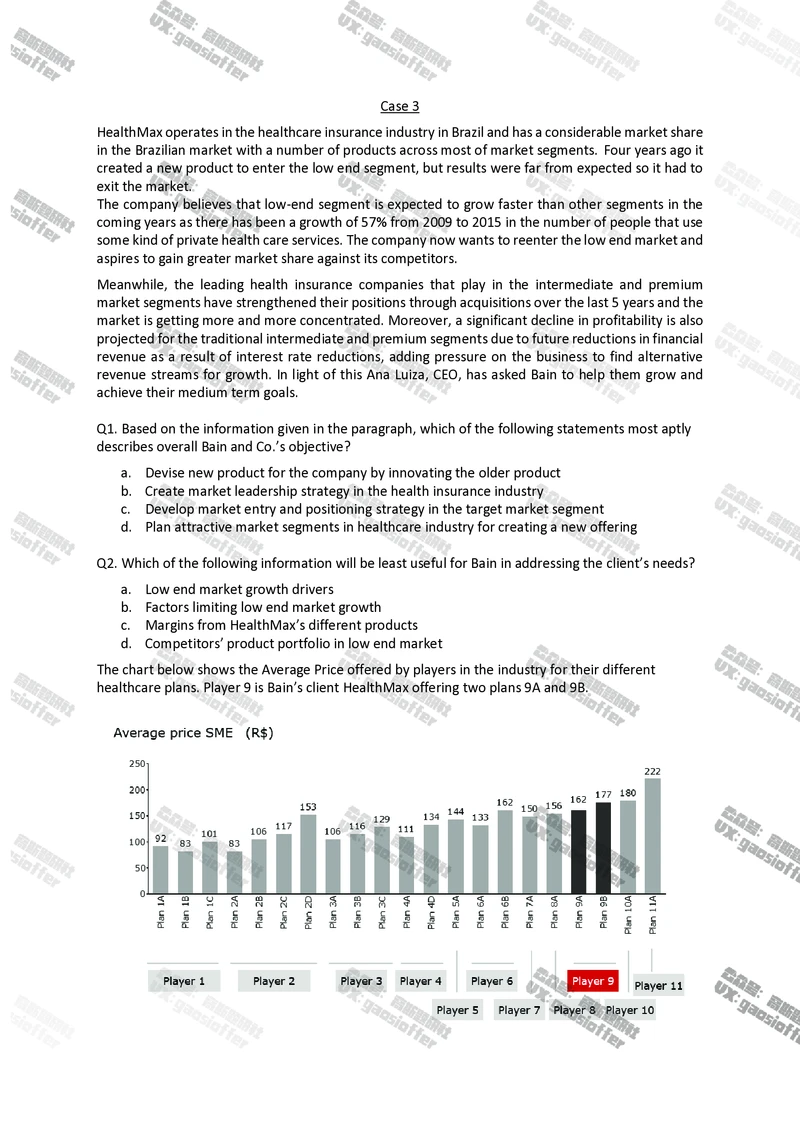
The chart below shows the Average Price offered by players in the industry for their different
healthcare plans. Player 9 is Bain’s client HealthMax offering two plans 9A and 9B.Q3. From the above chart, calculate if the average price of plans offered by Bain’s client is higher or
lower as compared to the competitors’ average price and also tell by how much percent is it higher
or lower?
a) Higher by 30%
b) Higher by 100%
c) Lower by 10%
d) Lower by 50%
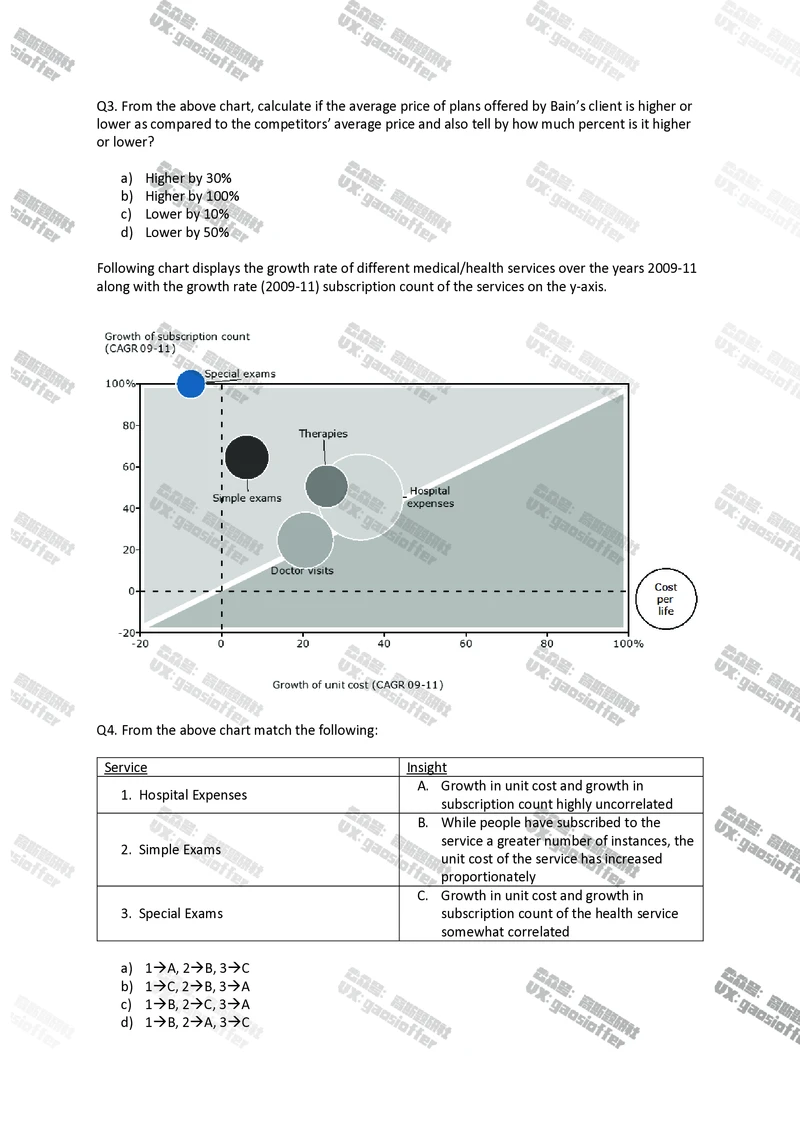
Following chart displays the growth rate of different medical/health services over the years 2009-11
along with the growth rate (2009-11) subscription count of the services on the y-axis.
Q4. From the above chart match the following:
Service Insight
A. Growth in unit cost and growth in
1. Hospital Expenses
subscription count highly uncorrelated
B. While people have subscribed to the
service a greater number of instances, the
2. Simple Exams
unit cost of the service has increased
proportionately
C. Growth in unit cost and growth in
3. Special Exams subscription count of the health service
somewhat correlated
a) 1A, 2B, 3C
b) 1C, 2B, 3A
c) 1B, 2C, 3A
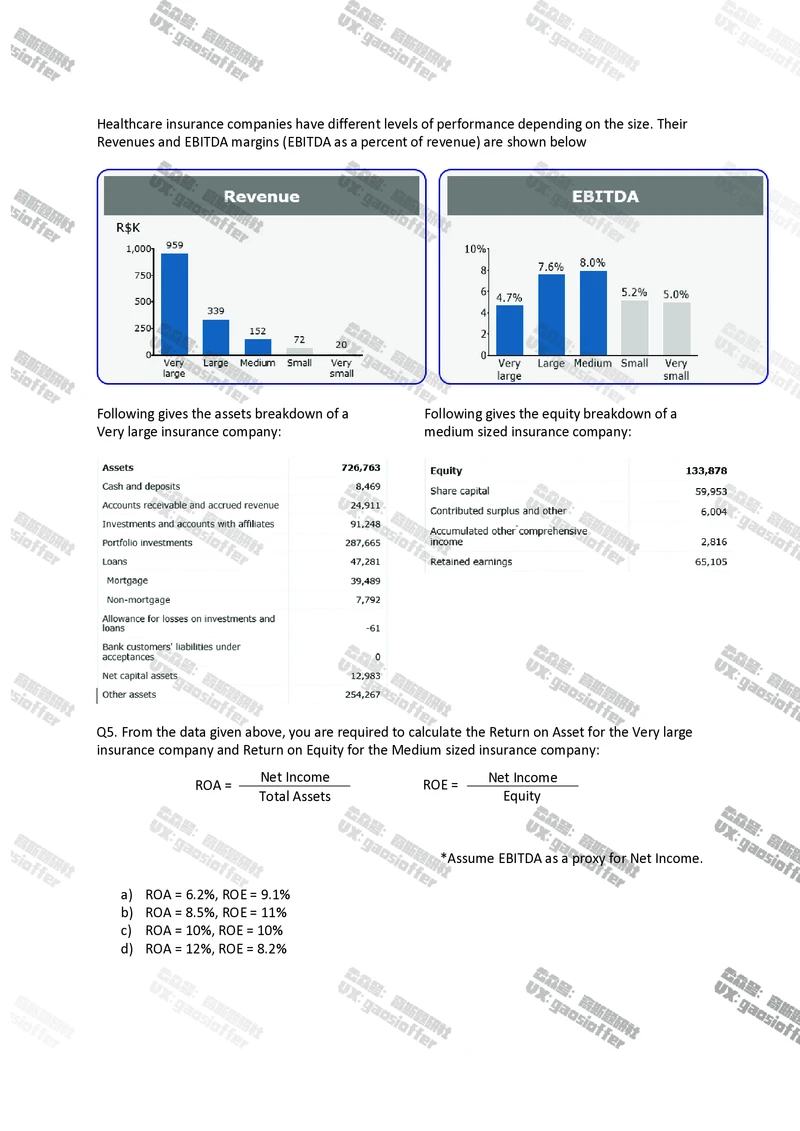
d) 1B, 2A, 3CHealthcare insurance companies have different levels of performance depending on the size. Their
Revenues and EBITDA margins (EBITDA as a percent of revenue) are shown below
Following gives the assets breakdown of a Following gives the equity breakdown of a
Very large insurance company: medium sized insurance company:
Q5. From the data given above, you are required to calculate the Return on Asset for the Very large
insurance company and Return on Equity for the Medium sized insurance company:
Net Income Net Income
ROA = ROE =
Total Assets Equity
*Assume EBITDA as a proxy for Net Income.
a) ROA = 6.2%, ROE = 9.1%
b) ROA = 8.5%, ROE = 11%
c) ROA = 10%, ROE = 10%
d) ROA = 12%, ROE = 8.2%Q6. Bain pursued the case by developing a four phase approach.
1. Create appropriate operations model for new offering
2. Market analysis and point of view (POV) about low end segment
3. Business analysis of profitability and current offerings in all segments
4. Construct a 5-year growth plan
From the information above, what was the course of action according to you?
a. 3241
b. 2314
c. 3421
d. 3214
Q7. Bain further performed market analysis and recommended that HealthMax should enter the low
end segment. On analysis of which of the following factors would Bain have made its
recommendation? (Select the most appropriate option)
1. Low end market growth rate
2. Existing providers operating model in low end market
3. Cost efficiencies in the segment
4. Synergies in sales channel
5. Brazilian population expansion and demand for overall healthcare services
Choose the most appropriate option
a. 1,4 and 5
b. 1,2,3 and 5
c. 1,2, 4 and 5
d. 1,2 and 4
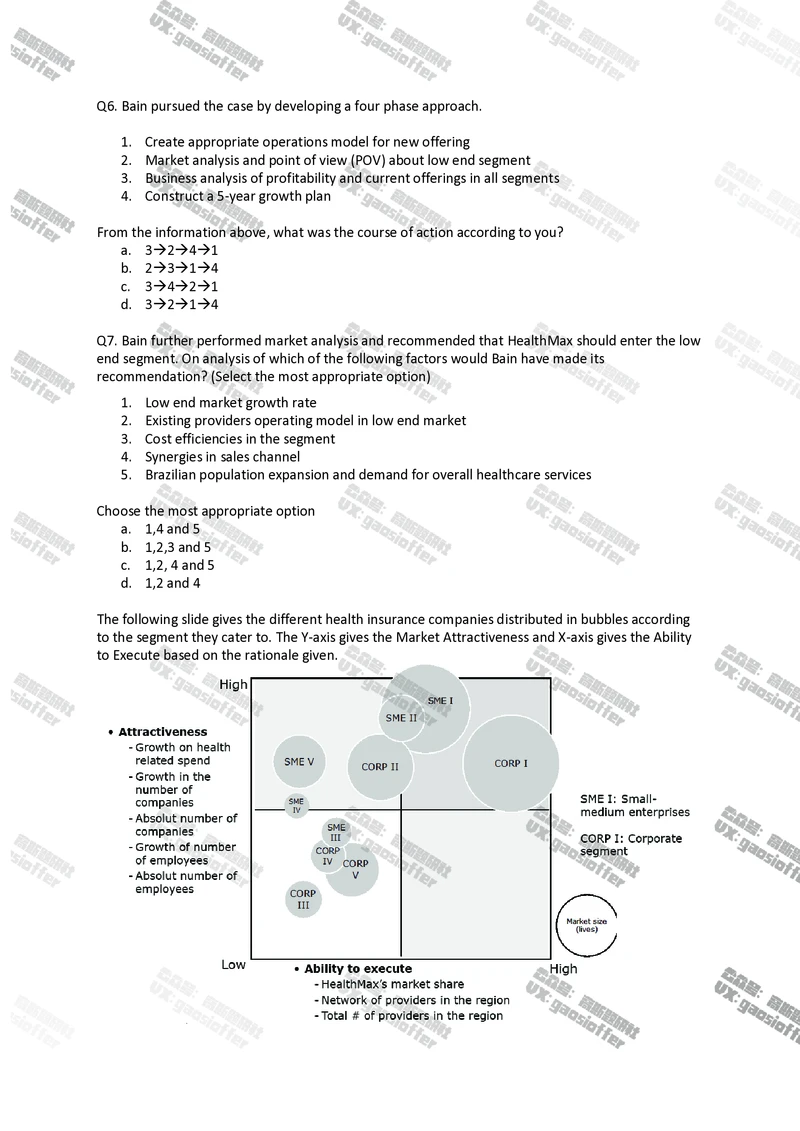
The following slide gives the different health insurance companies distributed in bubbles according
to the segment they cater to. The Y-axis gives the Market Attractiveness and X-axis gives the Ability
to Execute based on the rationale given.Q8. From the above slide identify the most logical target segments in both SME and CORP.
a) SME IV and V; CORP III
b) SME III; CORP III, IV and V
c) SME I and II; CORP I and II
d) SME II; CORP II
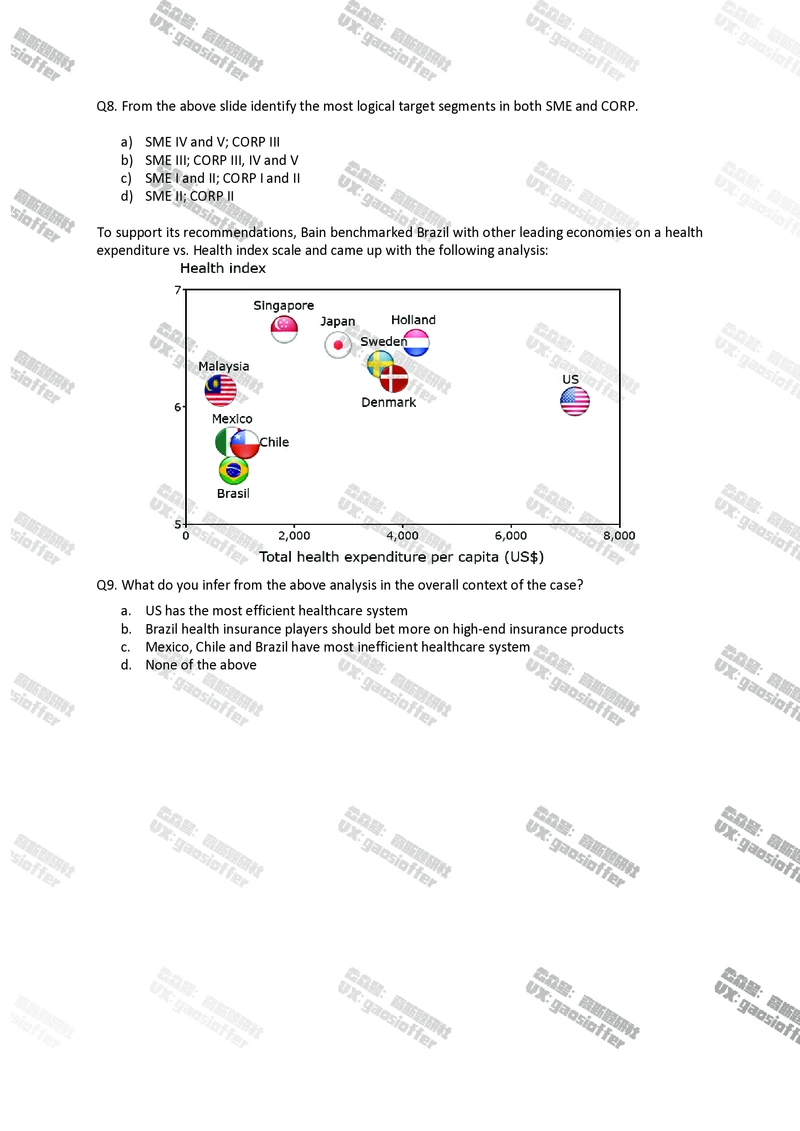
To support its recommendations, Bain benchmarked Brazil with other leading economies on a health
expenditure vs. Health index scale and came up with the following analysis:
Q9. What do you infer from the above analysis in the overall context of the case?
a. US has the most efficient healthcare system
b. Brazil health insurance players should bet more on high-end insurance products
c. Mexico, Chile and Brazil have most inefficient healthcare system
d. None of the above

