 夜雨聆风
夜雨聆风“统计学的中心极限定理,帮我编写一个可视化的网页版的html代码。他可以比如说在一不同的采样采5000个点,有高斯采样,或者是有两个高斯组合成的这种中心点不一样的采样,还有其他的这种平均采样等等。目前已知的几种采样,然后再从采样里面随机抽取可控,比如说抽取三个样品求平均,然后抽100次。进行一个样本统计,观察中心极限定理是否成立。”
大家可以复制或者改进提示词到deepseek,deepseek会直接给出html下载
Deepseek给出答案:
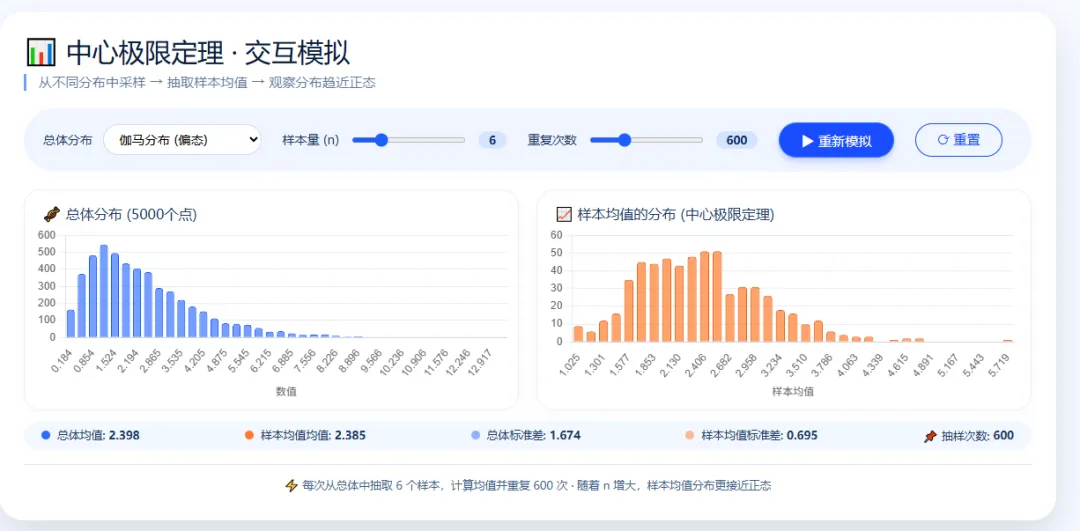
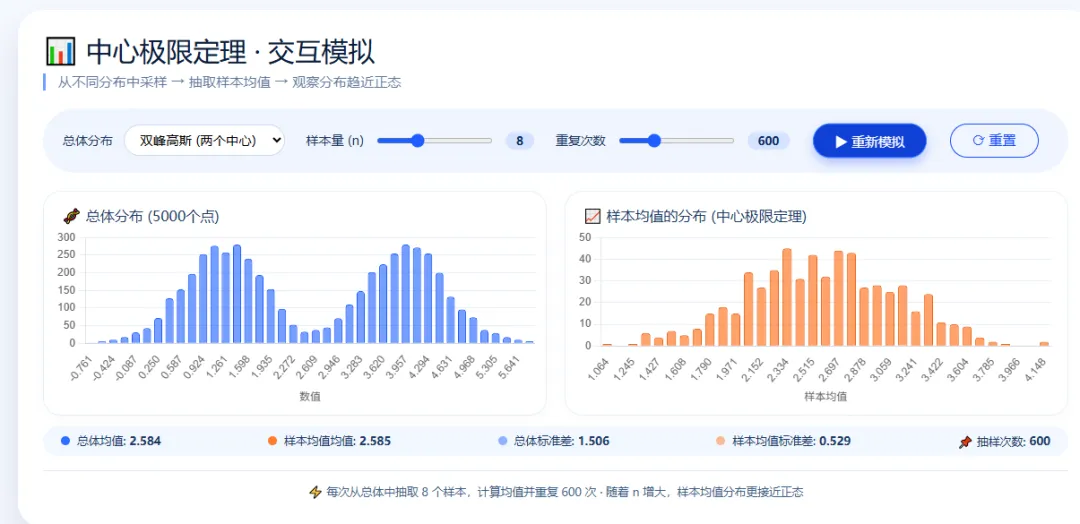
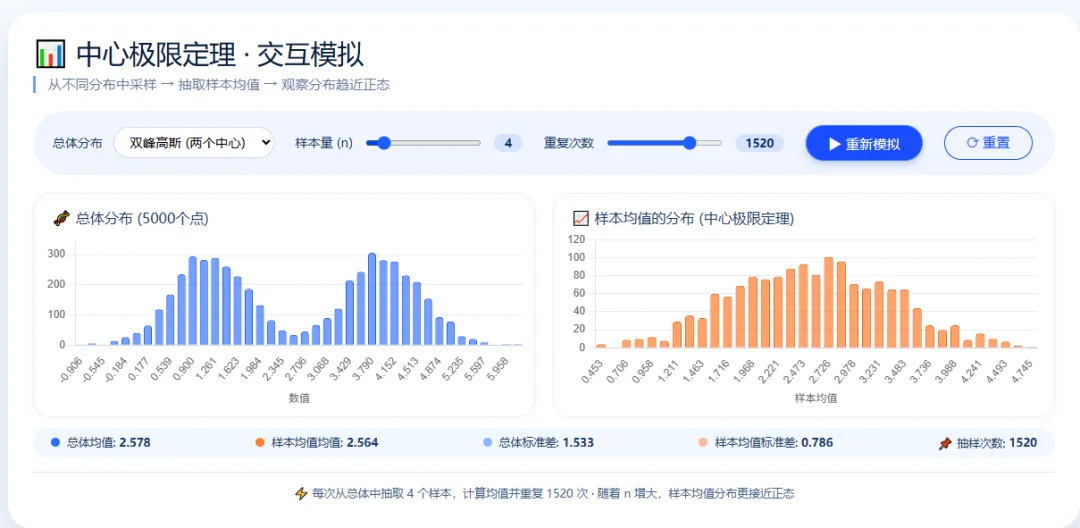
完整代码,可以直接复制到文档然后保存为html格式。
<!DOCTYPE html><htmllang="zh-CN"><head><metacharset="UTF-8"><metaname="viewport"content="width=device-width, initial-scale=1.0"><title>中心极限定理 · 可视化演示</title><!-- Chart.js CDN --><scriptsrc="https://cdn.jsdelivr.net/npm/chart.js@4.4.0/dist/chart.umd.min.js"></script><style>* {box-sizing: border-box;font-family: system-ui, 'Segoe UI', Roboto, sans-serif;}body {background: #f5f9ff;margin: 0;min-height: 100vh;display: flex;justify-content: center;align-items: center;padding: 16px;}.card {max-width: 1200px;width: 100%;background: white;border-radius: 28px;padding: 24px 28px 32px;box-shadow: 0 20px 40px rgba(0,20,60,0.12);transition: 0.2s;}h1 {font-weight: 500;font-size: 1.9rem;letter-spacing: -0.5px;color: #0b1e3a;margin: 0 0 6px 0;display: flex;align-items: center;gap: 8px;}.sub {color: #2d4b7a;font-size: 0.95rem;border-left: 3px solid #3b7cff;padding-left: 14px;margin: 0 0 20px 0;opacity: 0.75;}.flex-row {display: flex;flex-wrap: wrap;gap: 20px 28px;align-items: flex-end;}.control-group {display: flex;flex-wrap: wrap;align-items: center;gap: 16px 24px;background: #f0f5fe;padding: 16px 22px;border-radius: 60px;margin-bottom: 18px;}.control-item {display: flex;align-items: center;gap: 8px 12px;flex-wrap: wrap;}.control-item label {font-weight: 500;color: #1f3a66;font-size: 0.85rem;letter-spacing: 0.3px;}select, input[type="range"] {background: white;border: 1px solid #ccd9f0;border-radius: 40px;padding: 6px 14px;font-size: 0.9rem;cursor: pointer;outline: none;}select {min-width: 130px;}input[type="range"] {width: 130px;padding: 0;height: 6px;accent-color: #1e5eff;}.val-badge {background: #d6e3ff;padding: 2px 12px;border-radius: 24px;font-size: 0.8rem;font-weight: 600;color: #0d2b66;min-width: 28px;text-align: center;}.btn {background: #1a4cff;border: none;color: white;font-weight: 500;padding: 8px 24px;border-radius: 40px;font-size: 0.95rem;cursor: pointer;transition: 0.15s;box-shadow: 0 4px 8px rgba(26,76,255,0.25);border: 1px solid #3b7cff;}.btn:hover {background: #0f3fd6;transform: scale(0.97);box-shadow: 0 6px 12px rgba(26,76,255,0.3);}.btn-outline {background: transparent;color: #1a4cff;border: 1px solid #1a4cff;box-shadow: none;}.btn-outline:hover {background: #e5edff;}.chart-grid {display: grid;grid-template-columns: 1fr 1fr;gap: 20px;margin: 20px 0 12px;}.chart-box {background: #ffffff;border-radius: 20px;padding: 16px 12px 8px;box-shadow: 0 4px 12px rgba(0,0,0,0.02);border: 1px solid #e7eefa;}.chart-box h3 {margin: 0 0 4px 8px;font-weight: 500;font-size: 1rem;color: #1f3a66;}.chart-container {position: relative;height: 200px;}.stat-legend {display: flex;flex-wrap: wrap;justify-content: space-between;background: #f2f7ff;border-radius: 40px;padding: 8px 20px;margin-top: 12px;font-size: 0.8rem;color: #1f3a66;}.stat-legend span {display: inline-flex;align-items: center;gap: 4px;}.dot {display: inline-block;width: 10px;height: 10px;border-radius: 10px;margin-right: 4px;}.footnote {margin-top: 16px;font-size: 0.8rem;color: #3f5f8a;border-top: 1px solid #dce6f5;padding-top: 14px;text-align: center;}@media (max-width: 720px) {.chart-grid { grid-template-columns: 1fr; }.control-group { border-radius: 28px; }}</style></head><body><divclass="card"><h1>📊 中心极限定理 · 交互模拟</h1><divclass="sub">从不同分布中采样 → 抽取样本均值 → 观察分布趋近正态</div><!-- 控制区域 --><divclass="control-group"><divclass="control-item"><labelfor="distSelect">总体分布</label><selectid="distSelect"><optionvalue="gaussian">高斯 (正态)</option><optionvalue="bimodal"selected>双峰高斯 (两个中心)</option><optionvalue="uniform">均匀分布</option><optionvalue="exponential">指数分布</option><optionvalue="gamma">伽马分布 (偏态)</option></select></div><divclass="control-item"><labelfor="sampleSize">样本量 (n)</label><inputtype="range"id="sampleSize"min="2"max="20"value="5"step="1"><spanclass="val-badge"id="sampleSizeVal">5</span></div><divclass="control-item"><labelfor="numSamples">重复次数</label><inputtype="range"id="numSamples"min="50"max="2000"value="500"step="10"><spanclass="val-badge"id="numSamplesVal">500</span></div><buttonclass="btn"id="runBtn">▶ 重新模拟</button><buttonclass="btn btn-outline"id="resetBtn">⟳ 重置</button></div><!-- 图表 --><divclass="chart-grid"><divclass="chart-box"><h3>🧬 总体分布 (5000个点)</h3><divclass="chart-container"><canvasid="populationChart"></canvas></div></div><divclass="chart-box"><h3>📈 样本均值的分布 (中心极限定理)</h3><divclass="chart-container"><canvasid="samplingChart"></canvas></div></div></div><!-- 统计摘要 --><divclass="stat-legend"id="statsDisplay"><span><spanclass="dot"style="background:#2b6cff;"></span> 总体均值: <strongid="popMean">—</strong></span><span><spanclass="dot"style="background:#ff7b2b;"></span> 样本均值均值: <strongid="sampleMean">—</strong></span><span><spanclass="dot"style="background:#2b6cff; opacity:0.5;"></span> 总体标准差: <strongid="popStd">—</strong></span><span><spanclass="dot"style="background:#ff7b2b; opacity:0.5;"></span> 样本均值标准差: <strongid="sampleStd">—</strong></span><span>📌 抽样次数: <strongid="sampleCountDisplay">0</strong></span></div><divclass="footnote">⚡ 每次从总体中抽取 <spanid="footnoteN">5</span> 个样本,计算均值并重复 <spanid="footnoteK">500</span> 次 · 随着 n 增大,样本均值分布更接近正态</div></div><script>(function() {// ---------- 全局变量 ----------let populationData = []; // 总体数据 (5000个)let sampleMeans = []; // 样本均值列表// Chart.js 实例let popChart = null;let sampChart = null;// DOM 元素const distSelect = document.getElementById('distSelect');const sampleSizeSlider = document.getElementById('sampleSize');const sampleSizeVal = document.getElementById('sampleSizeVal');const numSamplesSlider = document.getElementById('numSamples');const numSamplesVal = document.getElementById('numSamplesVal');const runBtn = document.getElementById('runBtn');const resetBtn = document.getElementById('resetBtn');const popMeanEl = document.getElementById('popMean');const sampleMeanEl = document.getElementById('sampleMean');const popStdEl = document.getElementById('popStd');const sampleStdEl = document.getElementById('sampleStd');const sampleCountDisplay = document.getElementById('sampleCountDisplay');const footnoteN = document.getElementById('footnoteN');const footnoteK = document.getElementById('footnoteK');// 图表canvasconst popCanvas = document.getElementById('populationChart');const sampCanvas = document.getElementById('samplingChart');// ---------- 分布生成器 ----------function generateDistribution(type, size = 5000) {const data = new Float64Array(size);// 使用基础随机const rand = () => Math.random();for (let i = 0; i < size; i++) {let val = 0;switch (type) {case 'gaussian': {// Box-Muller 标准正态let u1 = rand(), u2 = rand();let z = Math.sqrt(-2 * Math.log(u1)) * Math.cos(2 * Math.PI * u2);val = 0.8 * z + 2.0; // 均值2,标准差0.8break;}case 'bimodal': {// 两个高斯混合: 中心在1.0 和 4.0if (rand() < 0.5) {let u1 = rand(), u2 = rand();let z = Math.sqrt(-2 * Math.log(u1)) * Math.cos(2 * Math.PI * u2);val = 0.6 * z + 1.2;} else {let u1 = rand(), u2 = rand();let z = Math.sqrt(-2 * Math.log(u1)) * Math.cos(2 * Math.PI * u2);val = 0.6 * z + 4.0;}break;}case 'uniform': {val = rand() * 6 + 0.5; // [0.5, 6.5]break;}case 'exponential': {// 指数分布 速率1.2 -> 均值 ~0.833val = -Math.log(1 - rand()) / 1.2;break;}case 'gamma': {// 伽马分布 (形状参数 k=2, 尺度 theta=1.2) 均值2.4, 偏态let sum = 0;for (let j = 0; j < 2; j++) {sum += -Math.log(1 - rand());}val = sum * 1.2;break;}default: val = rand() * 10;}data[i] = val;}return data;}// ---------- 工具: 均值, 标准差 ----------function mean(arr) {if (!arr.length) return 0;let s = 0;for (let v of arr) s += v;return s / arr.length;}function std(arr) {if (arr.length < 2) return 0;const m = mean(arr);let sq = 0;for (let v of arr) sq += (v - m) ** 2;return Math.sqrt(sq / (arr.length - 1));}// ---------- 核心: 执行模拟 ----------function runSimulation() {const dist = distSelect.value;const sampleN = parseInt(sampleSizeSlider.value, 10);const numSamples = parseInt(numSamplesSlider.value, 10);// 1. 生成总体 (5000点)populationData = generateDistribution(dist, 5000);// 2. 抽样: 从总体中随机抽取 sampleN 个, 计算均值, 重复 numSamples 次sampleMeans = [];const popLen = populationData.length;for (let i = 0; i < numSamples; i++) {let sum = 0;for (let j = 0; j < sampleN; j++) {const idx = Math.floor(Math.random() * popLen);sum += populationData[idx];}sampleMeans.push(sum / sampleN);}// 3. 更新图表updateCharts(dist, sampleN, numSamples);// 4. 更新统计摘要const popMeanVal = mean(populationData);const popStdVal = std(populationData);const sampleMeanVal = mean(sampleMeans);const sampleStdVal = std(sampleMeans);popMeanEl.textContent = popMeanVal.toFixed(3);popStdEl.textContent = popStdVal.toFixed(3);sampleMeanEl.textContent = sampleMeanVal.toFixed(3);sampleStdEl.textContent = sampleStdVal.toFixed(3);sampleCountDisplay.textContent = numSamples;footnoteN.textContent = sampleN;footnoteK.textContent = numSamples;}// ---------- 更新图表 ----------function updateCharts(dist, sampleN, numSamples) {// ---- 总体直方图 ----const popHist = buildHistogram(populationData, 40);const popLabels = popHist.map(b => b.x);const popCounts = popHist.map(b => b.count);if (popChart) {popChart.data.labels = popLabels;popChart.data.datasets[0].data = popCounts;popChart.update();} else {const ctx = popCanvas.getContext('2d');popChart = new Chart(ctx, {type: 'bar',data: {labels: popLabels,datasets: [{label: '频数',data: popCounts,backgroundColor: 'rgba(43, 108, 255, 0.65)',borderColor: '#1f5aff',borderWidth: 1,borderRadius: 3,}]},options: {responsive: true,maintainAspectRatio: false,plugins: {legend: { display: false },tooltip: { callbacks: { label: (ctx) => `频数: ${ctx.raw}` } }},scales: {x: { grid: { display: false }, title: { display: true, text: '数值' } },y: { grid: { color: '#e6edf9' }, beginAtZero: true }}}});}// ---- 样本均值直方图 ----const sampHist = buildHistogram(sampleMeans, 35);const sampLabels = sampHist.map(b => b.x);const sampCounts = sampHist.map(b => b.count);if (sampChart) {sampChart.data.labels = sampLabels;sampChart.data.datasets[0].data = sampCounts;sampChart.update();} else {const ctx = sampCanvas.getContext('2d');sampChart = new Chart(ctx, {type: 'bar',data: {labels: sampLabels,datasets: [{label: '频数',data: sampCounts,backgroundColor: 'rgba(255, 123, 43, 0.7)',borderColor: '#e8651a',borderWidth: 1,borderRadius: 3,}]},options: {responsive: true,maintainAspectRatio: false,plugins: {legend: { display: false },tooltip: { callbacks: { label: (ctx) => `频数: ${ctx.raw}` } }},scales: {x: { grid: { display: false }, title: { display: true, text: '样本均值' } },y: { grid: { color: '#e6edf9' }, beginAtZero: true }}}});}}// ---------- 直方图辅助 (返回 [{x, count}]) ----------function buildHistogram(data, bins = 30) {if (!data.length) return [];const min = Math.min(...data);const max = Math.max(...data);const range = max - min;if (range === 0) return [{ x: min.toFixed(2), count: data.length }];const binWidth = range / bins;const binCounts = new Array(bins).fill(0);const binEdges = [];for (let i = 0; i <= bins; i++) {binEdges.push(min + i * binWidth);}for (let val of data) {let idx = Math.floor((val - min) / binWidth);if (idx === bins) idx = bins - 1;if (idx >= 0 && idx < bins) binCounts[idx]++;}const result = [];for (let i = 0; i < bins; i++) {const mid = (binEdges[i] + binEdges[i+1]) / 2;result.push({ x: mid.toFixed(3), count: binCounts[i] });}return result;}// ---------- 重置 ----------function resetAll() {// 默认参数distSelect.value = 'bimodal';sampleSizeSlider.value = '5';sampleSizeVal.textContent = '5';numSamplesSlider.value = '500';numSamplesVal.textContent = '500';runSimulation();}// ---------- 事件绑定 ----------sampleSizeSlider.addEventListener('input', function() {sampleSizeVal.textContent = this.value;});numSamplesSlider.addEventListener('input', function() {numSamplesVal.textContent = this.value;});runBtn.addEventListener('click', runSimulation);resetBtn.addEventListener('click', resetAll);// 分布切换自动重新运行distSelect.addEventListener('change', runSimulation);// 额外:滑块变化自动运行? 为了体验,只在点击run时运行;但用户期望滑块变化后点击run.// 同时也支持滑块改变后自动刷新? 不自动刷新,避免卡顿,用户点击run。// 但为了便利,给滑块添加 run 快捷 (双击或change) 不强制。// 只绑定 runBtn// ---------- 初始化 ----------// 首次运行resetAll();// 窗口resize 图表自适应 (但chart.js默认)})();</script></body></html>