 夜雨聆风
夜雨聆风 01
01
性能插件
一、下载性能插件
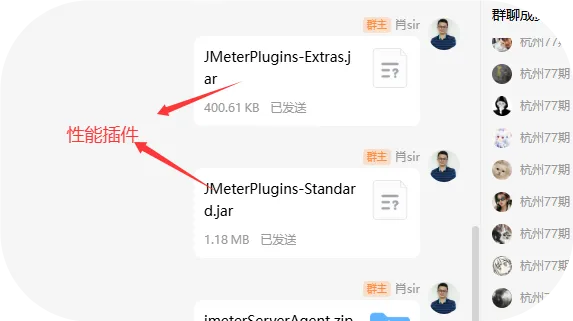
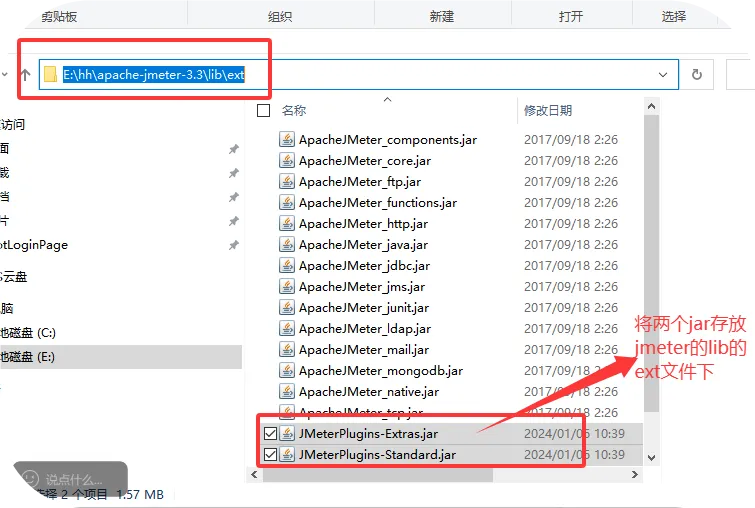
二、将性能插入存放到对应jmeter的下
(1)将性能插件导入存放:
路径如下:E:\dcs\two\jmeter\apache-jmeter-3.3\lib\ext
两个插件(
JMeterPlugins-Extras.jar
JMeterPlugins-Standardjar
)
(2)点击启动
ServerAgentijar
startAgent.bat 点击启动,启动一次就可以,关闭
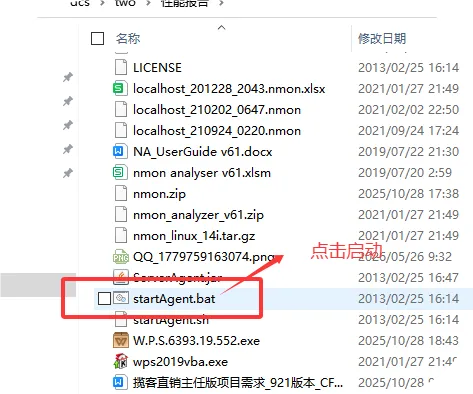
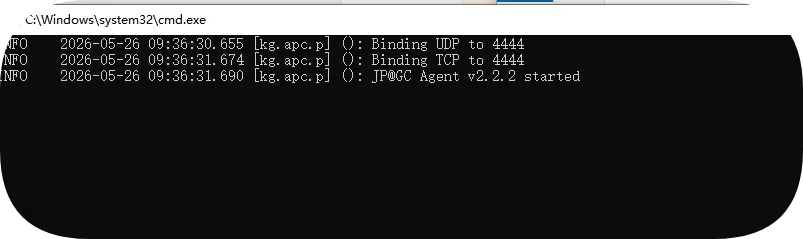
启动前的插件显示
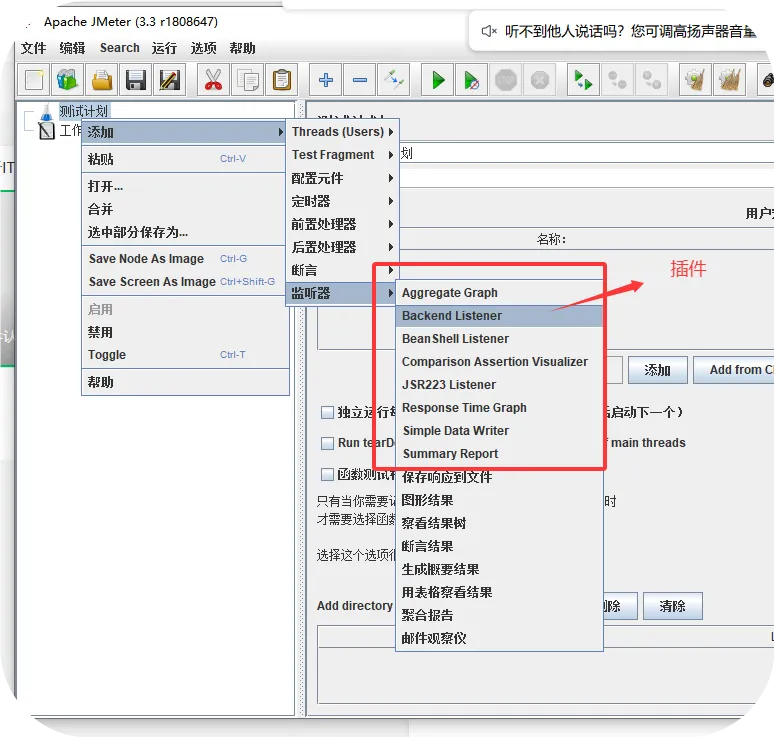
启动后插件显示
(3)重新打开jmeter
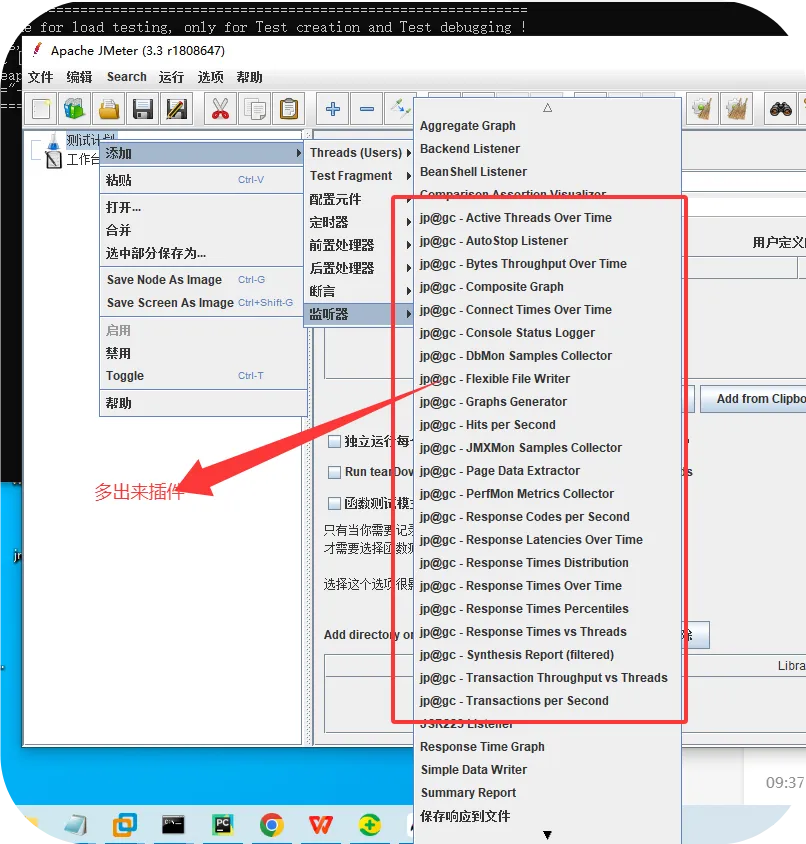
(4)右键==监听器==查看插件,并改成中文
详解:
@gc - Active Threads Over Timeip 活动线程时间
@gc - AutoStop Listener 自动停止侦听器
@gc - Bytes Throughput Over Timejp 字节吞吐量随时间变化
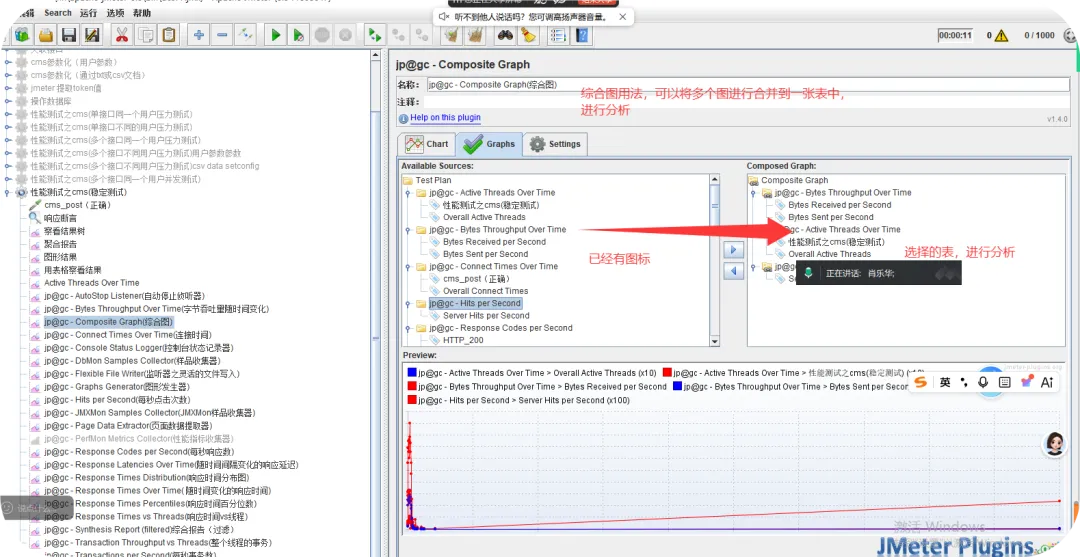
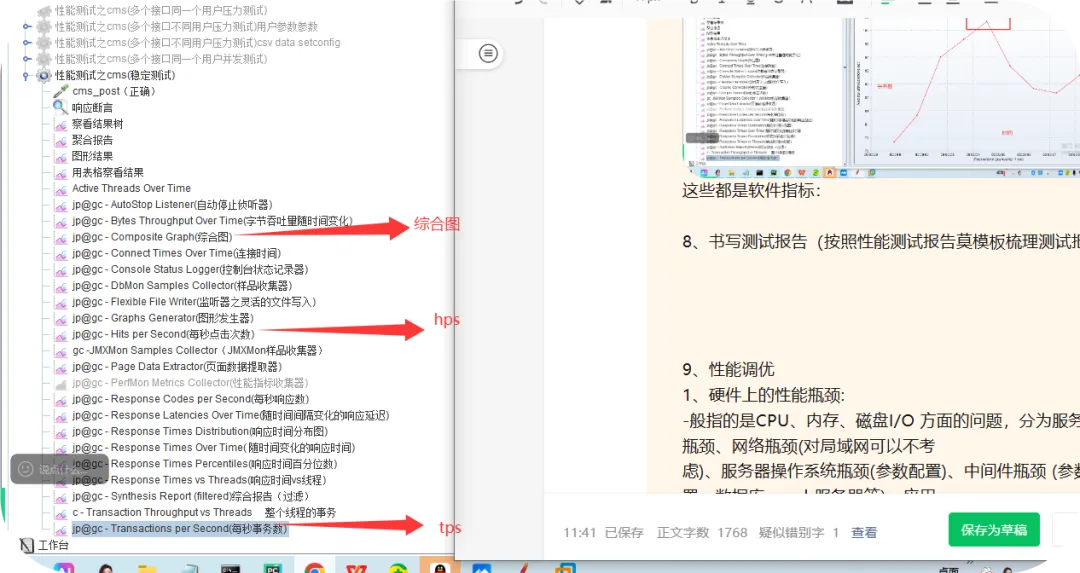
@gc -Composite Graph 综合图 (重点)
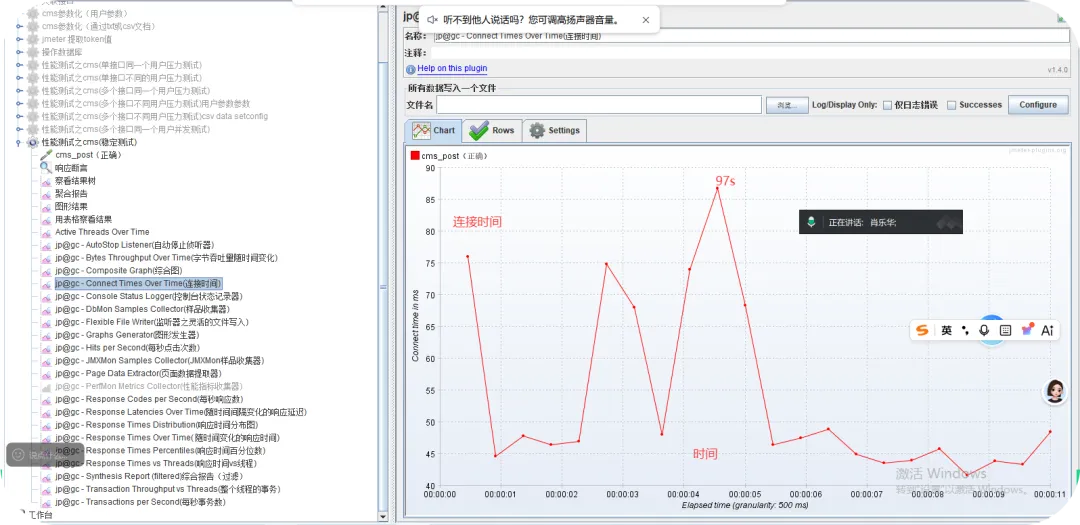
@gc - Connect Times Over Timejp 连接时间
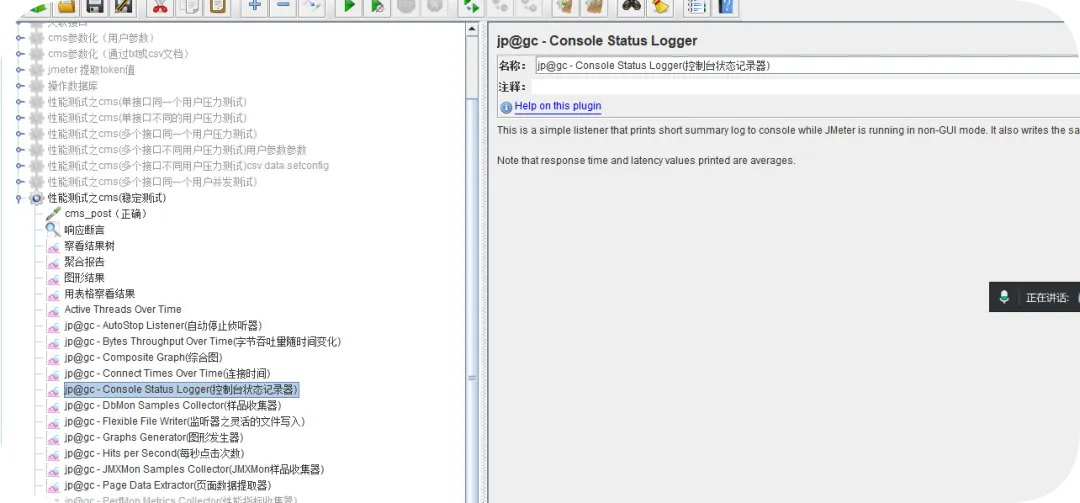
@gc -Console Status Loggerjp 控制台状态记录器
@gc - DbMon Samples Collectorjp (DbMon Collectorjp样品收集器
@gc -Flexible File Writer 监听器之灵活的文件写入
@gc - Graphs Generatorjip 图形发生器
@gc - Hits per Second 每秒点击次数 (重点)
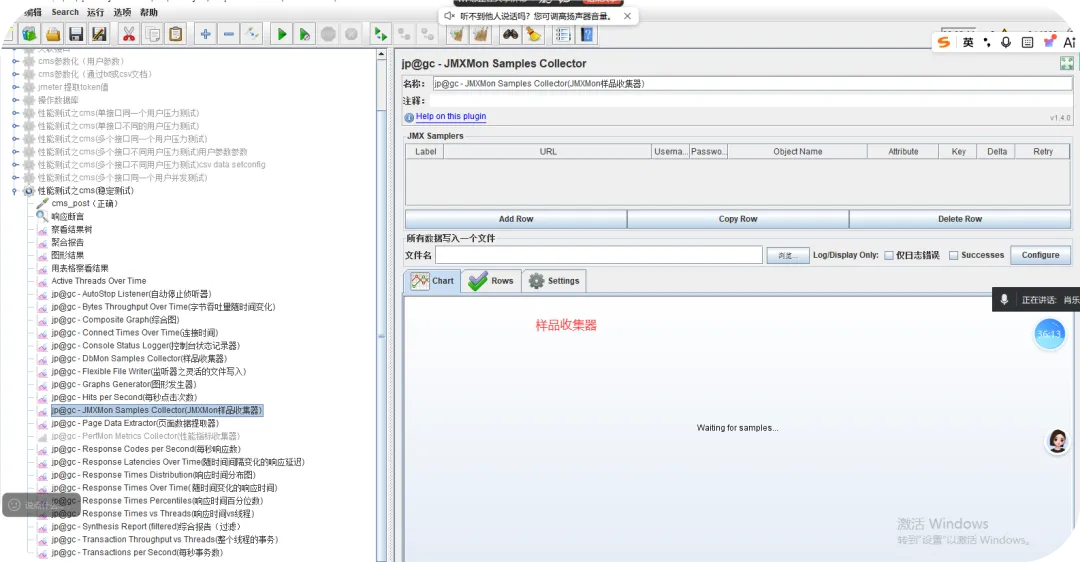
@gc -JMXMon Samples Collectorjp (JMXMon样品收集器
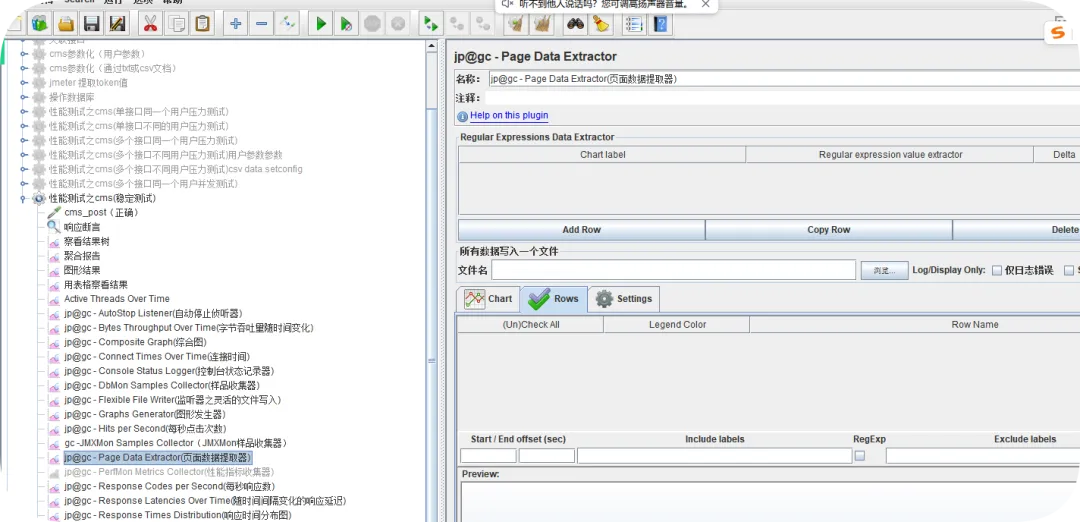
@gc - Page Data Extractor 页面数据提取器
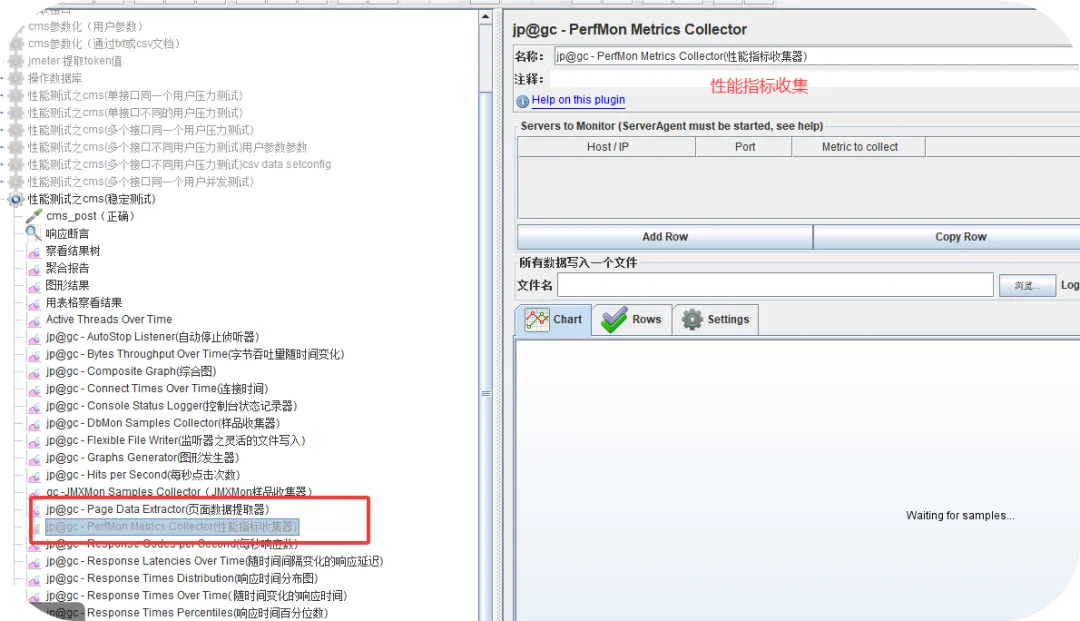
@gc - PerfMon Metrics Collectorjip 性能指标收集器(不能加,加了会报错)
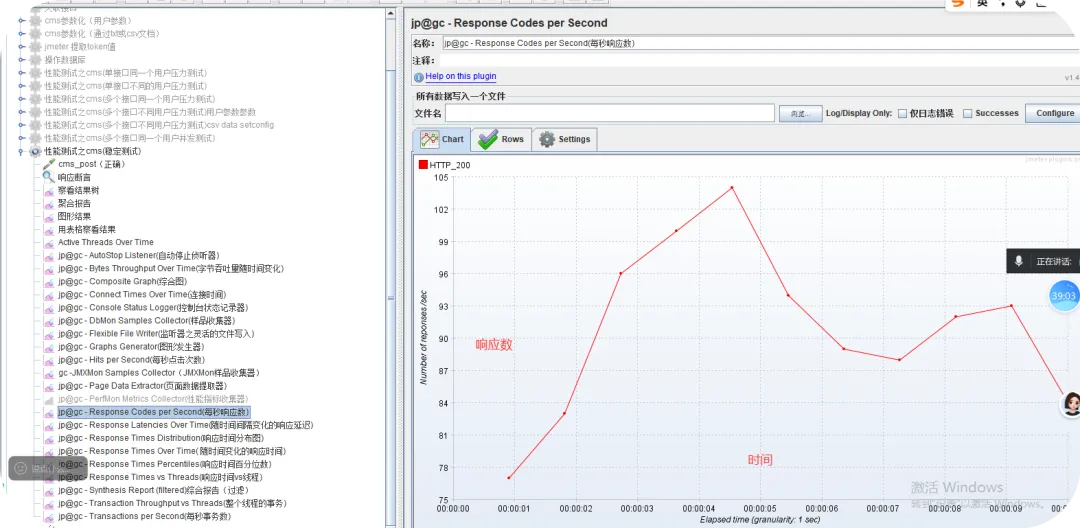
@gc - Response Codes per Secondjip 每秒响应数
@gc - Response Latencies Over Timejip 随时间间隔变化的响应延迟
@gc - Response Times Distributionjip 响应时间分布图
@gc - Response Times Over Timeip 随时间变化的响应时间
@gc - Response Times Percentilesjip 响应时间百分位数
@gc - Response Times vs Threadsjp 响应时间vs线程
@gc - Synthesis Report (filtered) 综合报告(过滤)
@gc - Transaction Throughput vs Threadsjip 整个线程的事务
@gc - Transactions per Second 每秒事务数 (重点)
(5)运用性能场景,查看插件收集的信息
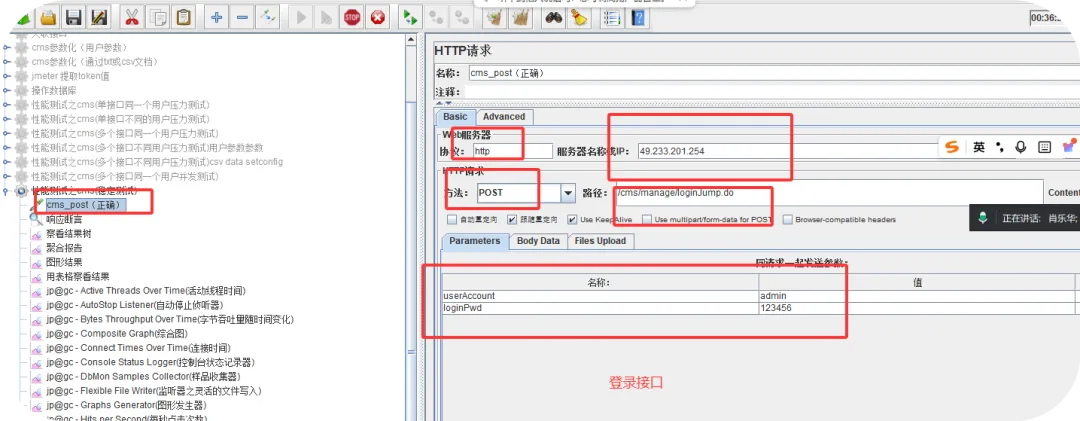
写一个性能场景,添加插件,收集监控信息
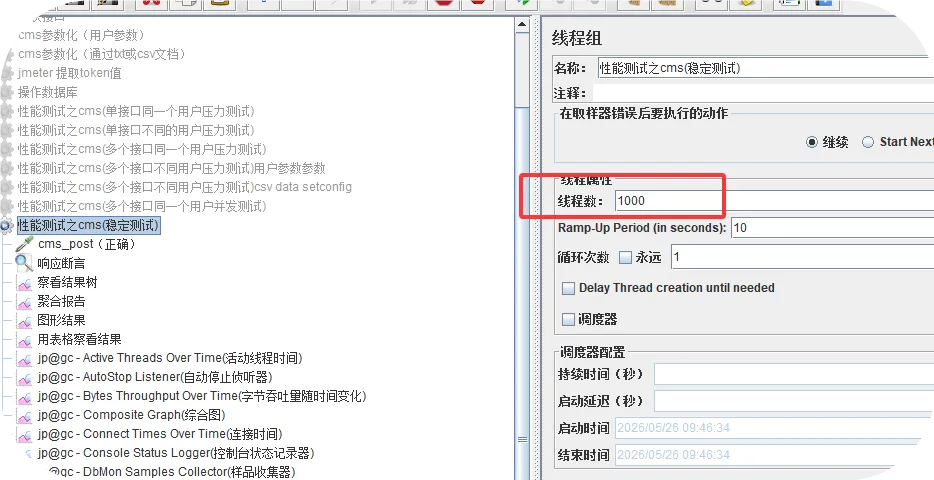
比如:登录接口的;压力测试1000
设置压力并发数据
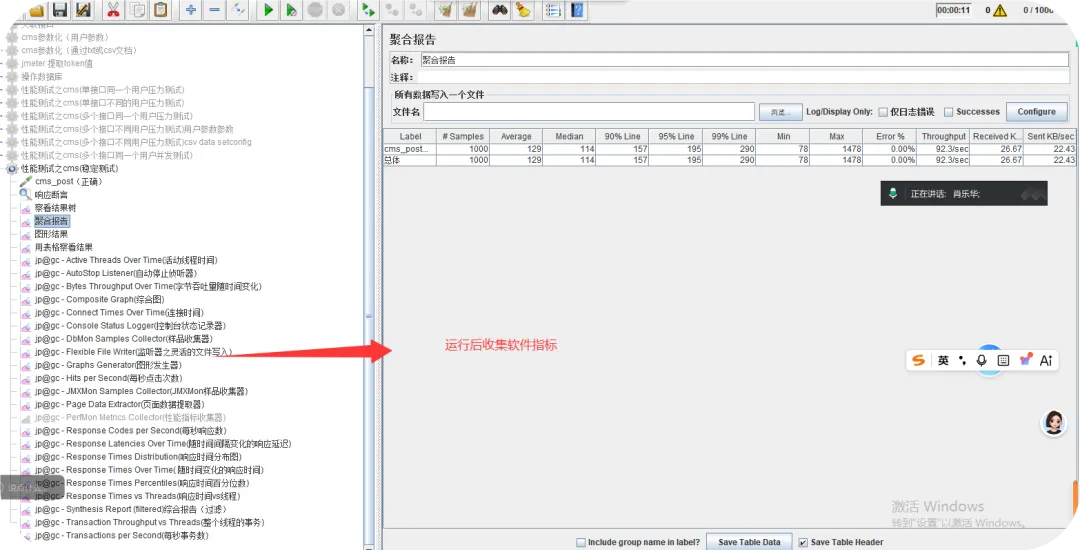
运行,收集指标
(6)插件的详解参考连接:
https://www.cnblogs.com/xiaolehong/p/18142818
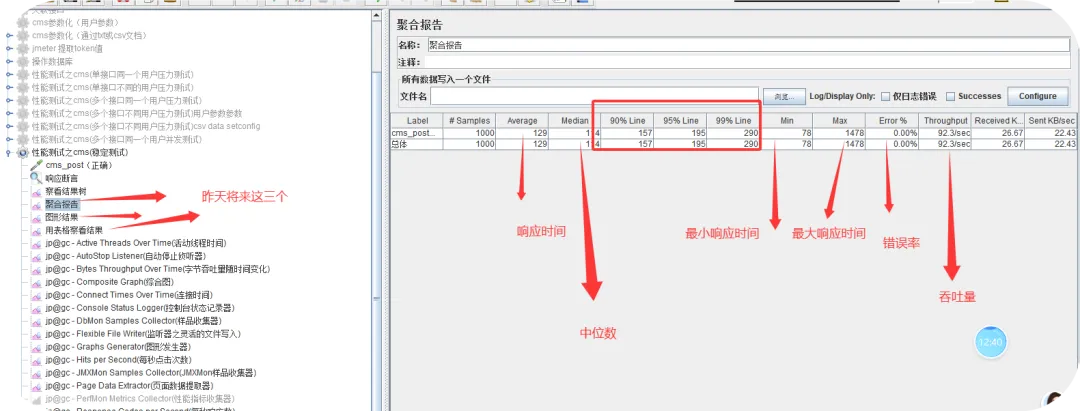
(1)详解: 聚合报告
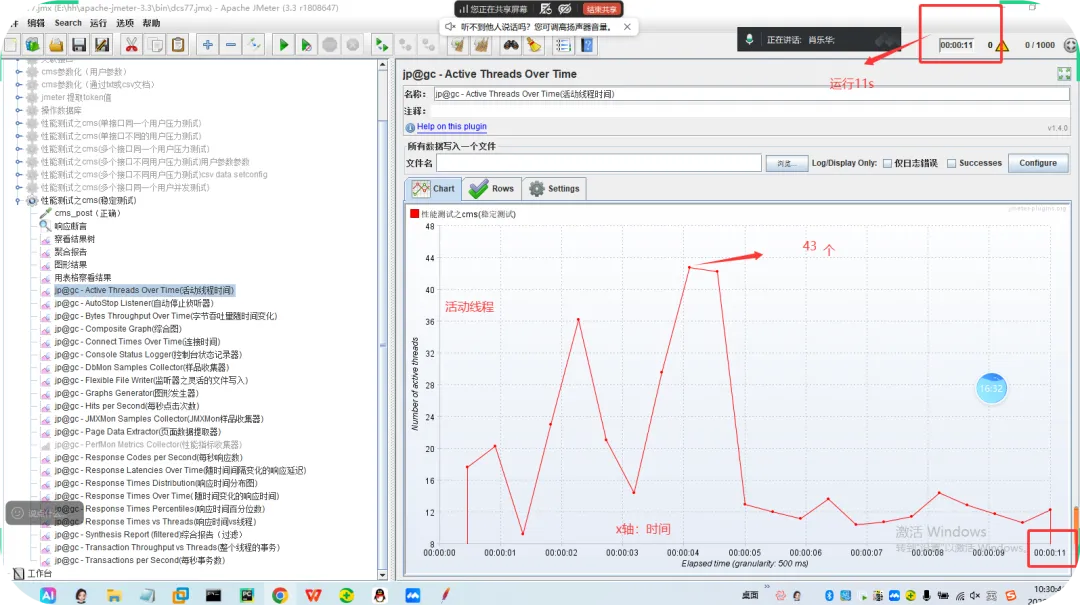
(2)Active Threads Over Time:每秒的活动线程数,X轴表示访问的时刻,Y轴表示活动线程数,F(X,Y)表示某个时刻的活动线程数。
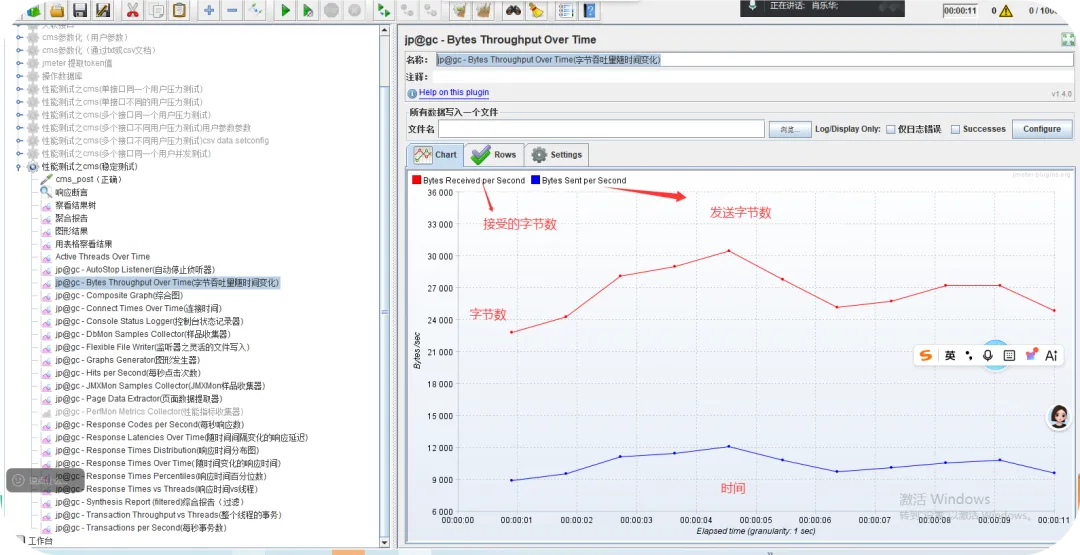
(3)jp@gc - Bytes Throughput Over Time(字节吞吐量随时间变化)
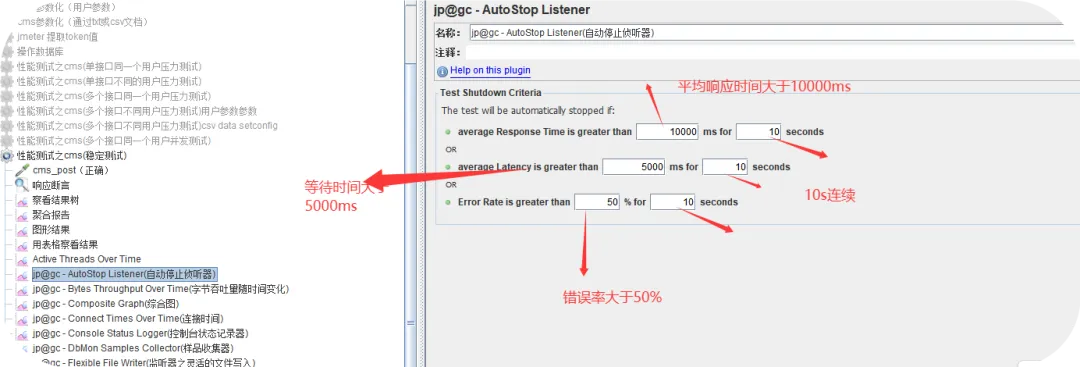
(4)jp@gc - AutoStop Listener(自动停止侦听器)
(5)jp@gc - Composite Graph(综合图)
(6)jp@gc - Connect Times Over Time(连接时间)
(7)jp@gc - Console Status Logger(控制台状态记录器)
(8)jp@gc - DbMon Samples Collector(样品收集器)
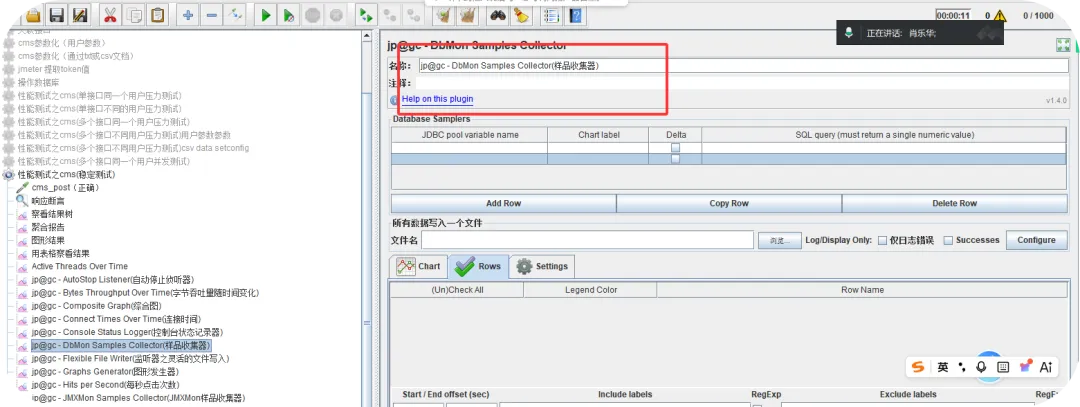
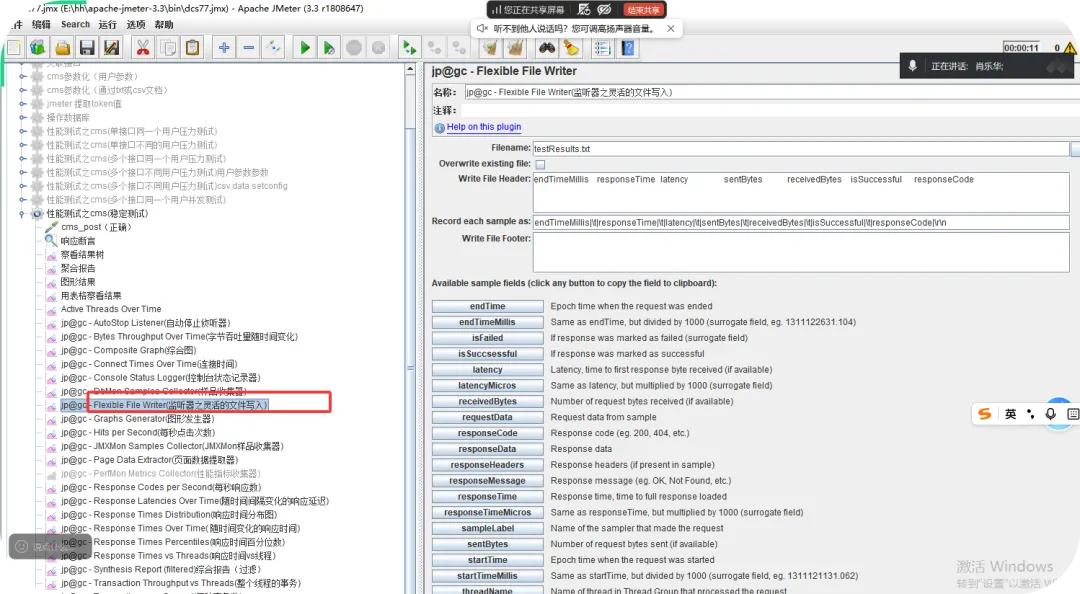
(9)jp@gc - Flexible File Writer(监听器之灵活的文件写入)
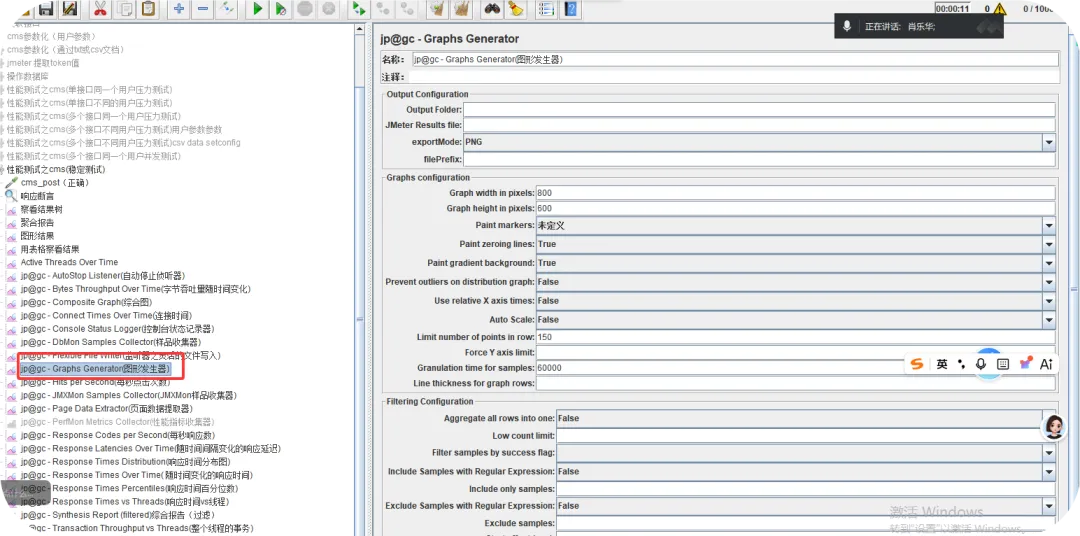
(10)jp@gc - Graphs Generator(图形发生器)
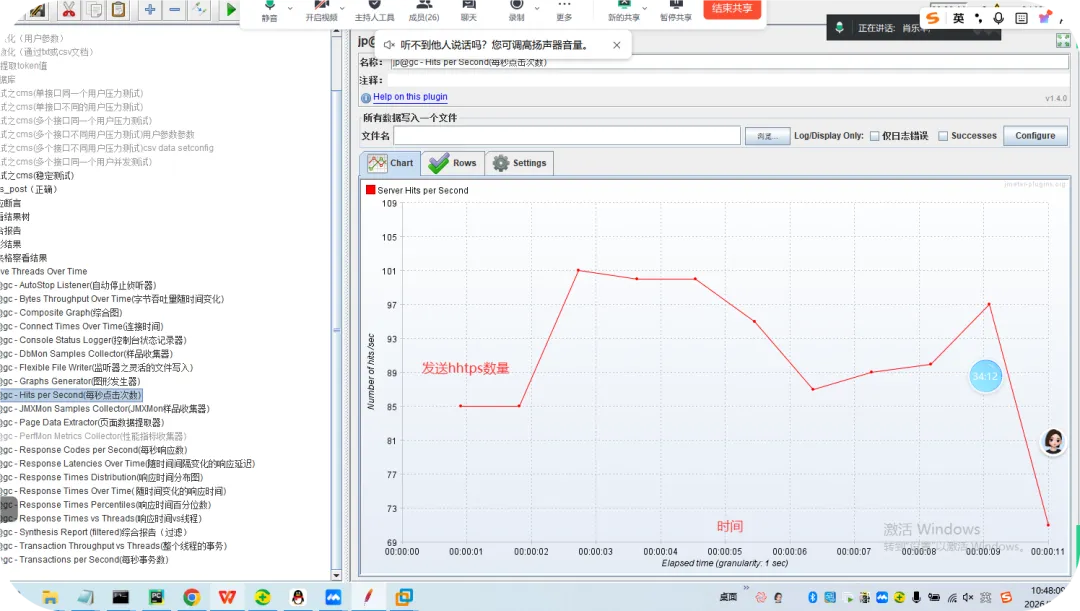
(11)jp@gc - Hits per Second(每秒点击次数)
(12)gc -JMXMon Samples Collector(JMXMon样品收集器)
(13)jp@gc - Page Data Extractor(页面数据提取器)
(14)jp@gc - PerfMon Metrics Collector(性能指标收集器)
(15)jp@gc - Response Codes per Second(每秒响应数)
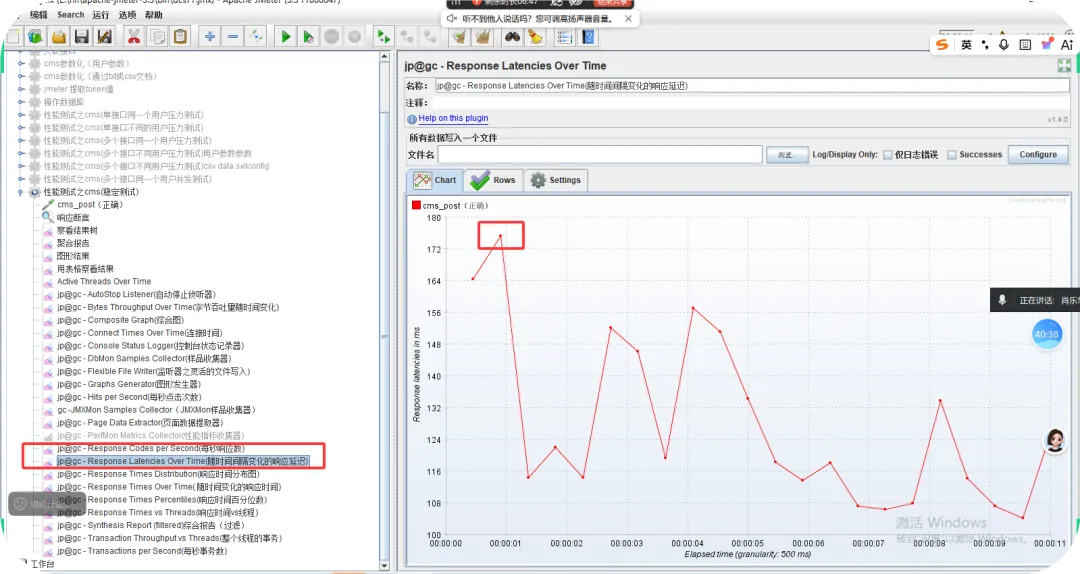
(16)jp@gc - Response Latencies Over Time(随时间间隔变化的响应延迟)
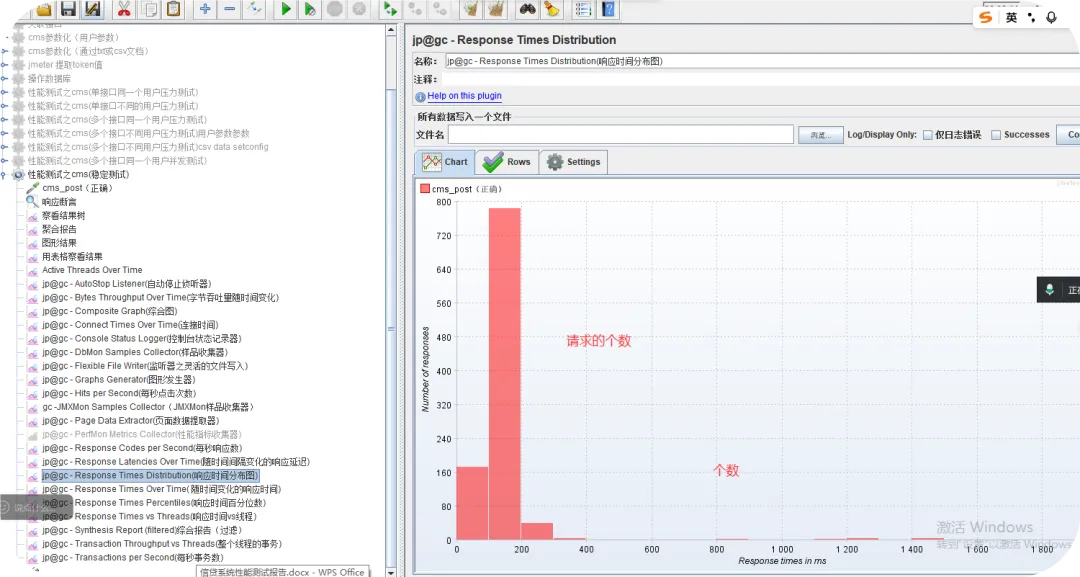
(17)jp@gc - Response Times Distribution(响应时间分布图)
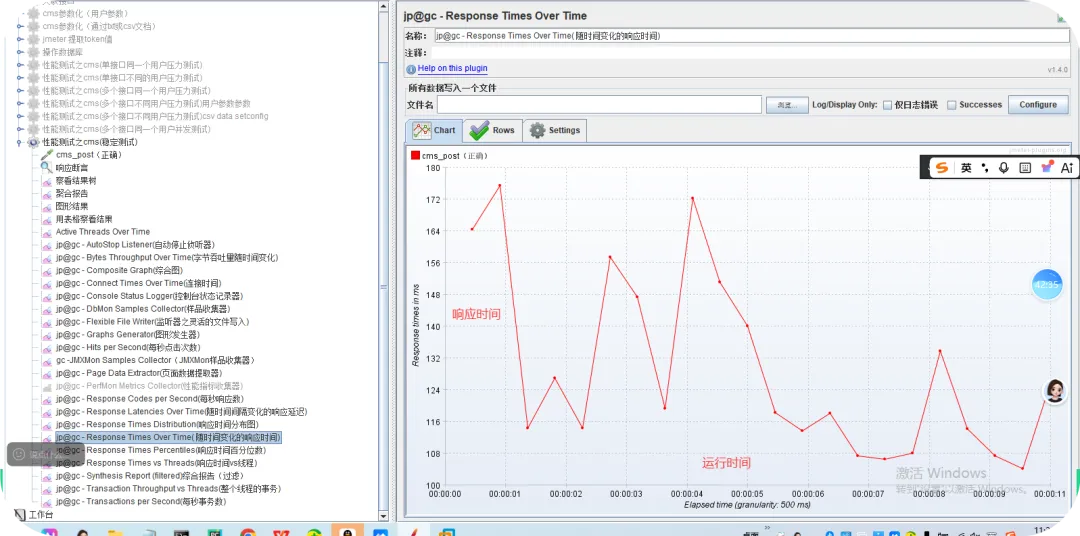
(18)jp@gc - Response Times Over Time( 随时间变化的响应时间)
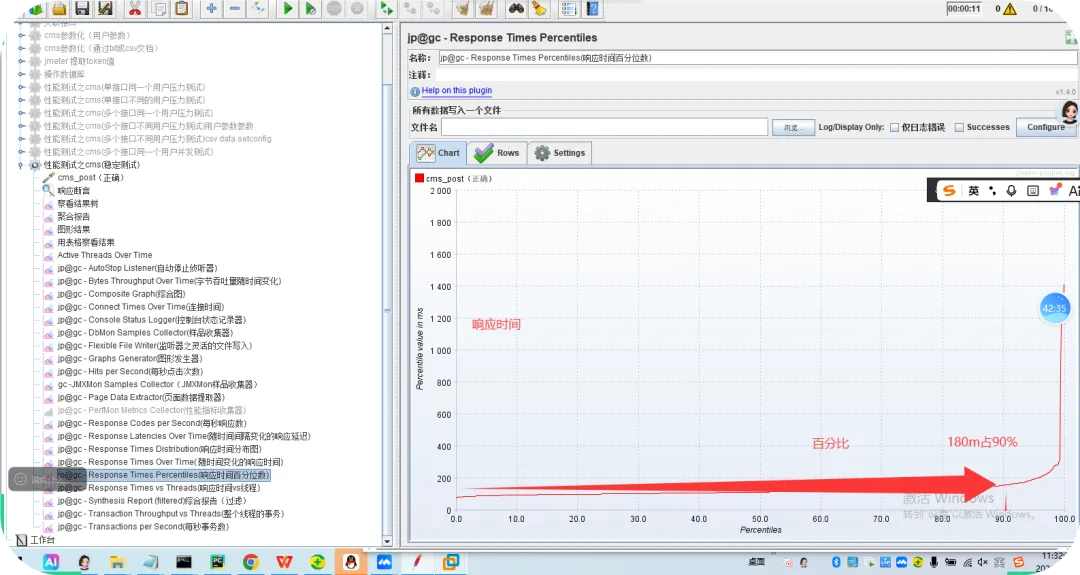
(19)jp@gc - Response Times Percentiles(响应时间百分位数)
(20)jp@gc - Response Times vs Threads(响应时间vs线程)
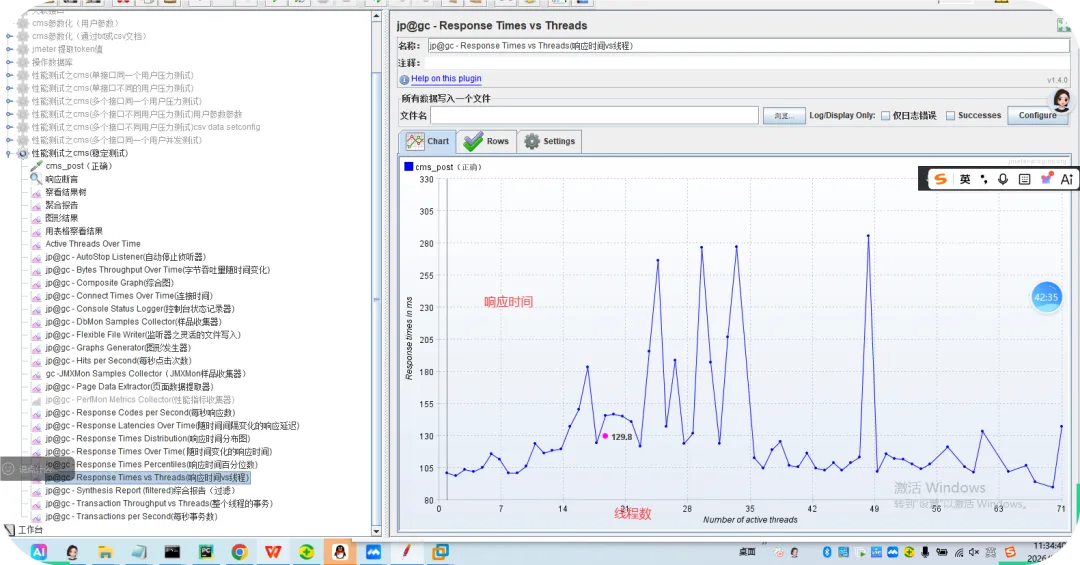
(20)jp@gc - Synthesis Report (filtered)综合报告(过滤)
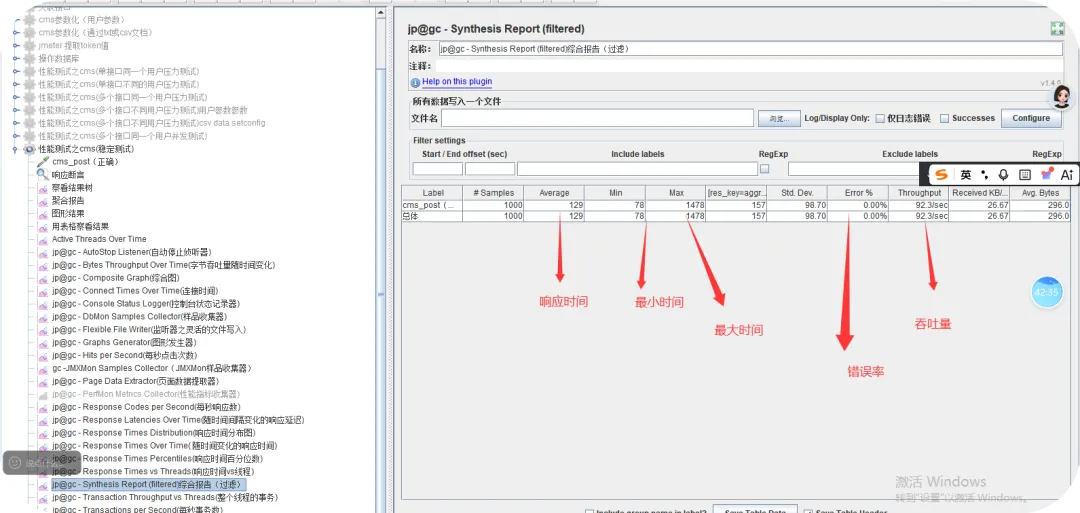
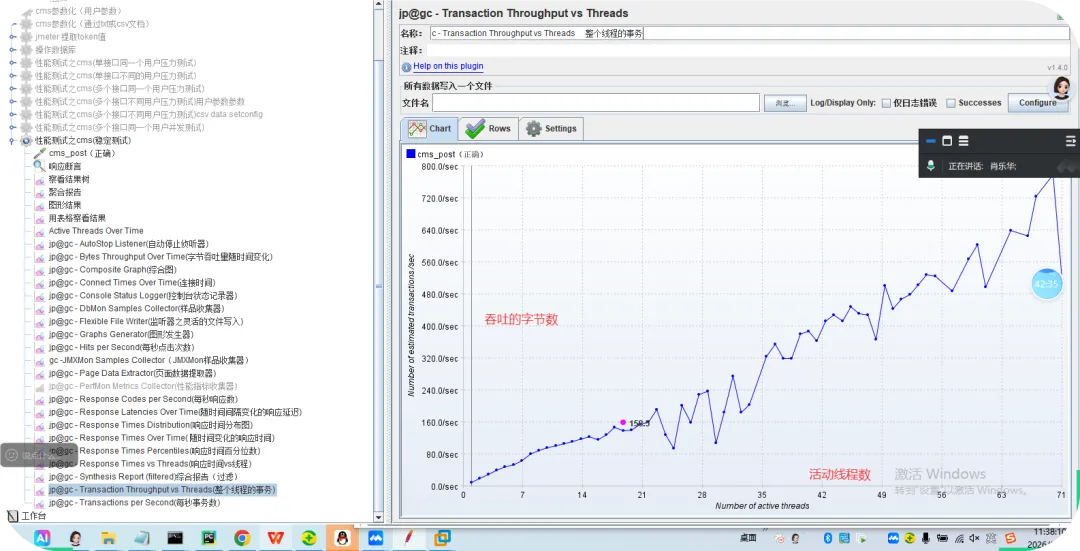
(21) Transaction Throughput vs Threads
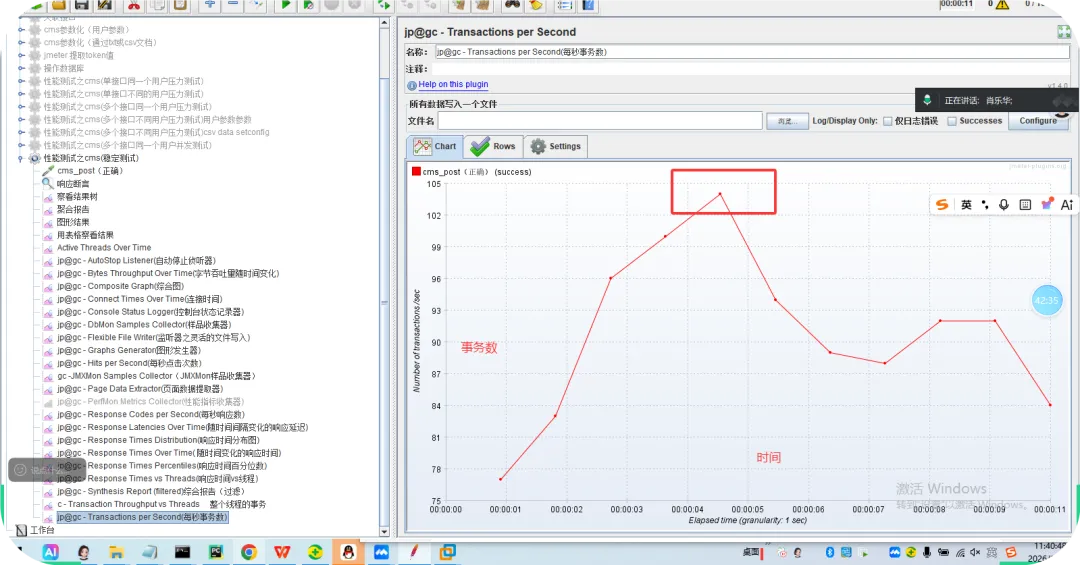
(22)jp@gc - Transactions per Second(每秒事务数)重点
简称:tps
这些都是软件指标:
培训成功就业30000+;
讲师团队:20+;
班级人数:15-30(1个班)
软件测试:两个班级(1个月)
大数据班:3个班级(1个月)
鸿蒙开发班:1个班级(1个月)
最高薪资:30k
最低薪资:7.5k
应届生最高:19k
应届生薪资:8-12k

学技术热线:15949613302
16607005847
Ai软件测试学习联系微信: 15949613302
Ai大数据学习联系微信 : xiaolehua003
鸿蒙开发:15949613302
扫码加微信