

文档内容
Numerical Critical Reasoning
Test 4
Questions Booklet
Instructions
This numerical reasoning test comprises 20 questions, and you will have to correctly
answer as many as you can. Calculators are permitted for this test, and it is
recommended you have some rough paper to work on.
You will have to work quickly and accurately to perform well in this test. The test does
not have an overall time limit however each question does has a time limit. The first
question relating to each table or graph has 90 seconds, and subsequent questions
relating to the same table or graph have 75 seconds.
Try to find a time and place where you will not be interrupted during the test. The test
will begin on the next page.
AssessmentDay
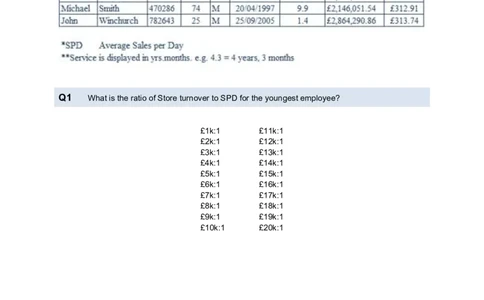
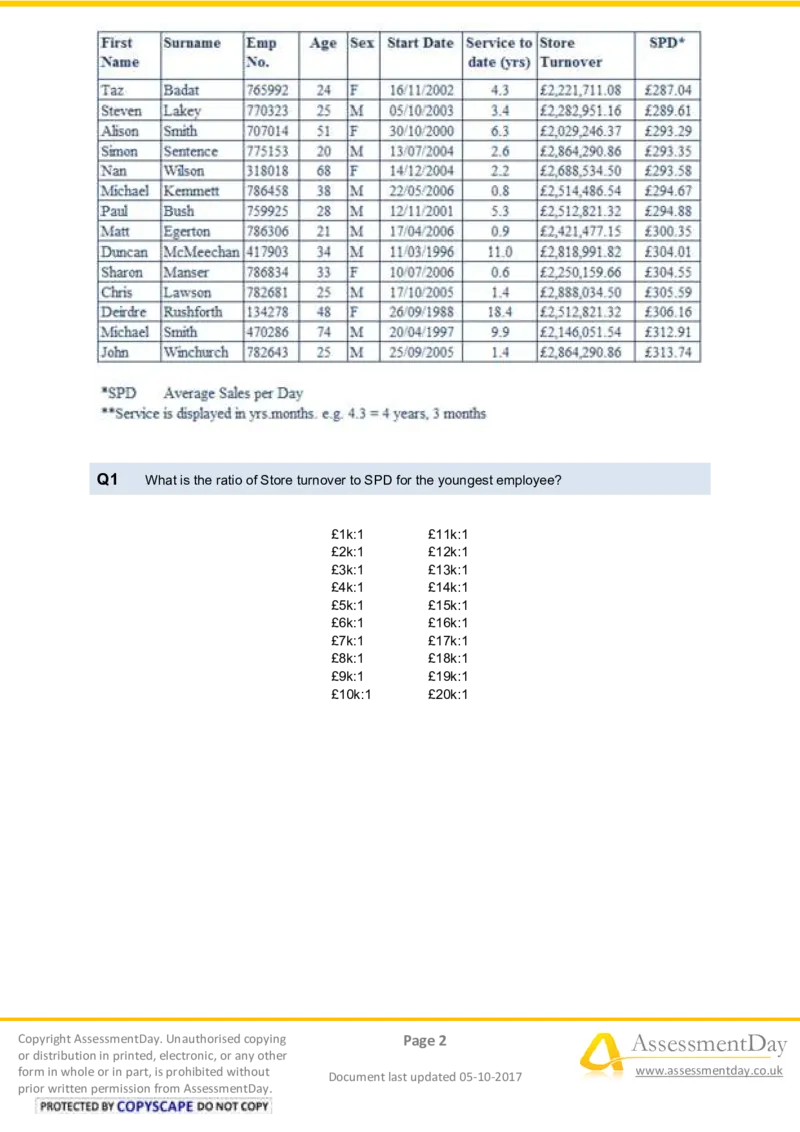
Practice Aptitude TestsQ1 What is the ratio of Store turnover to SPD for the youngest employee?
£1k:1 £11k:1
£2k:1 £12k:1
£3k:1 £13k:1
£4k:1 £14k:1
£5k:1 £15k:1
£6k:1 £16k:1
£7k:1 £17k:1
£8k:1 £18k:1
£9k:1 £19k:1
£10k:1 £20k:1
Copyright AssessmentDay. Unauthorised copying Page 2 AssessmentDay
or distribution in printed, electronic, or any other
form in whole or in part, is prohibited without
Document last updated 05-10-2017
www.assessmentday.co.uk
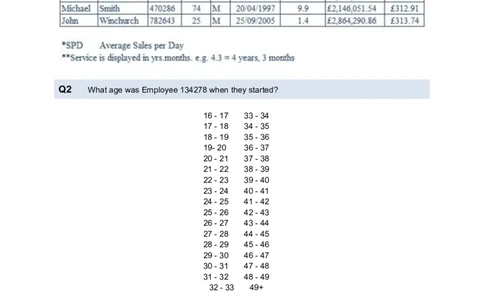
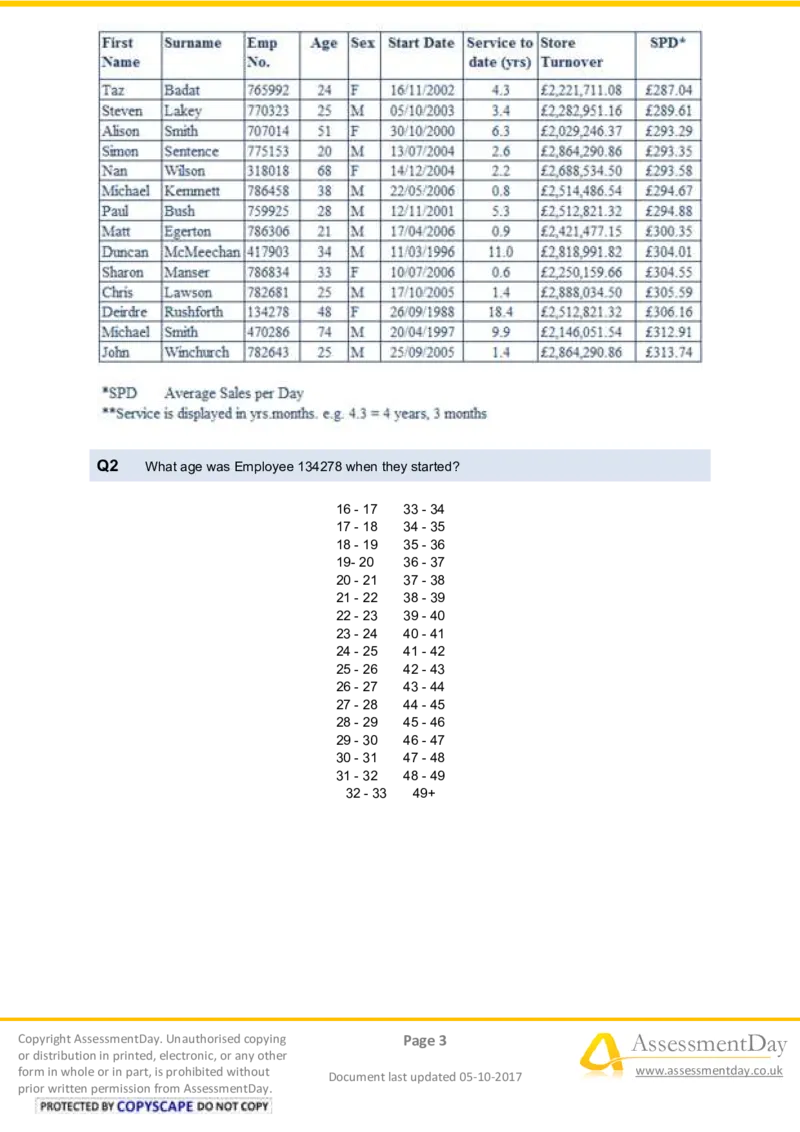
prior written permission from AssessmentDay.Q2 What age was Employee 134278 when they started?
16 - 17 33 - 34
17 - 18 34 - 35
18 - 19 35 - 36
19- 20 36 - 37
20 - 21 37 - 38
21 - 22 38 - 39
22 - 23 39 - 40
23 - 24 40 - 41
24 - 25 41 - 42
25 - 26 42 - 43
26 - 27 43 - 44
27 - 28 44 - 45
28 - 29 45 - 46
29 - 30 46 - 47
30 - 31 47 - 48
31 - 32 48 - 49
32 - 33 49+
Copyright AssessmentDay. Unauthorised copying Page 3 AssessmentDay
or distribution in printed, electronic, or any other
form in whole or in part, is prohibited without
Document last updated 05-10-2017
www.assessmentday.co.uk
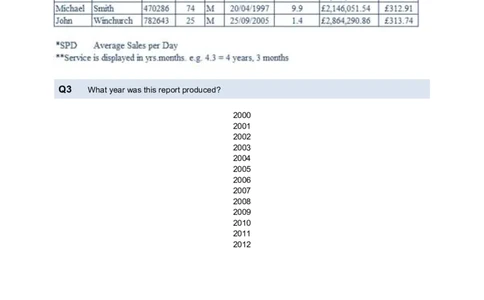
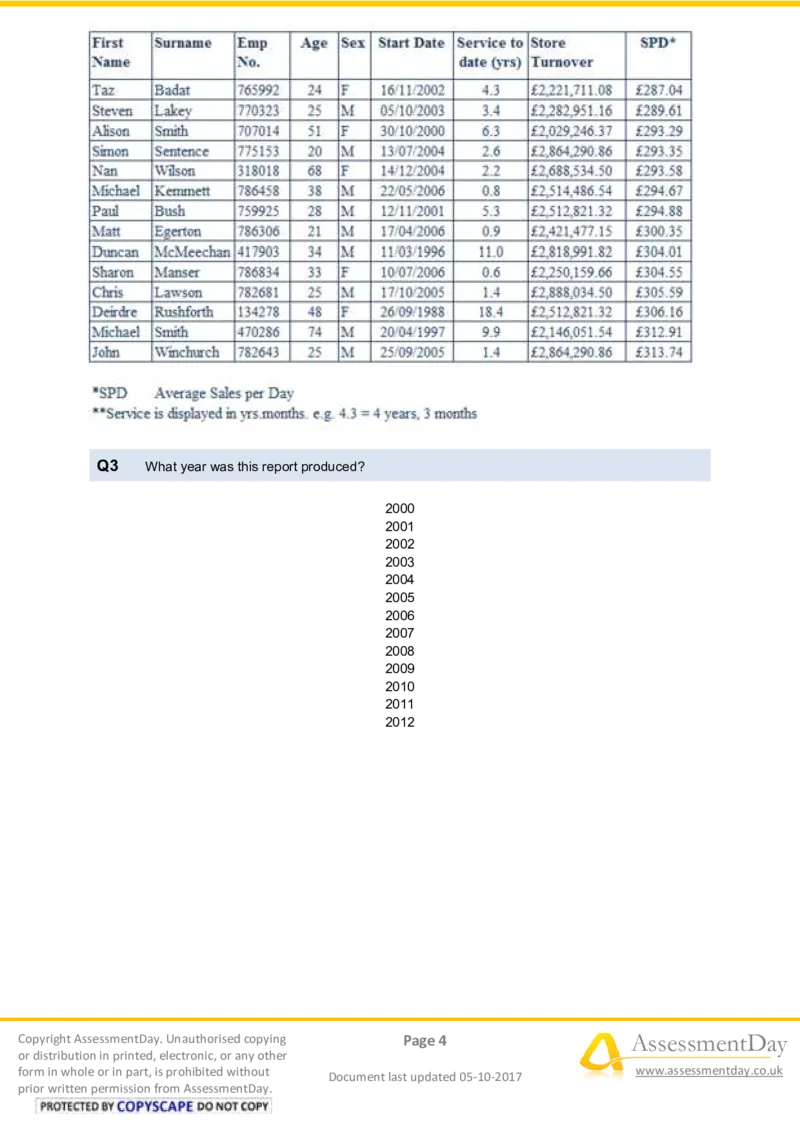
prior written permission from AssessmentDay.Q3 What year was this report produced?
2000
2001
2002
2003
2004
2005
2006
2007
2008
2009
2010
2011
2012
Copyright AssessmentDay. Unauthorised copying Page 4 AssessmentDay
or distribution in printed, electronic, or any other
form in whole or in part, is prohibited without
Document last updated 05-10-2017
www.assessmentday.co.uk
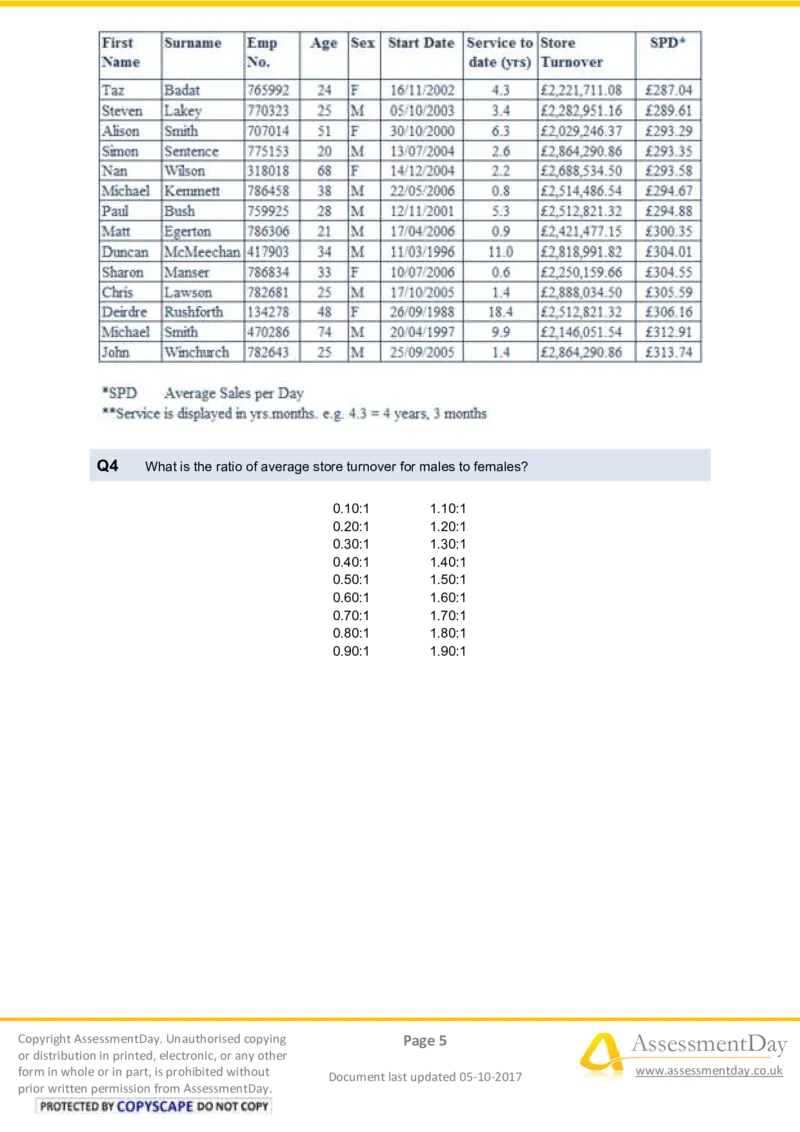
prior written permission from AssessmentDay.Q4 What is the ratio of average store turnover for males to females?
0.10:1 1.10:1
0.20:1 1.20:1
0.30:1 1.30:1
0.40:1 1.40:1
0.50:1 1.50:1
0.60:1 1.60:1
0.70:1 1.70:1
0.80:1 1.80:1
0.90:1 1.90:1
Copyright AssessmentDay. Unauthorised copying Page 5 AssessmentDay
or distribution in printed, electronic, or any other
form in whole or in part, is prohibited without
Document last updated 05-10-2017
www.assessmentday.co.uk
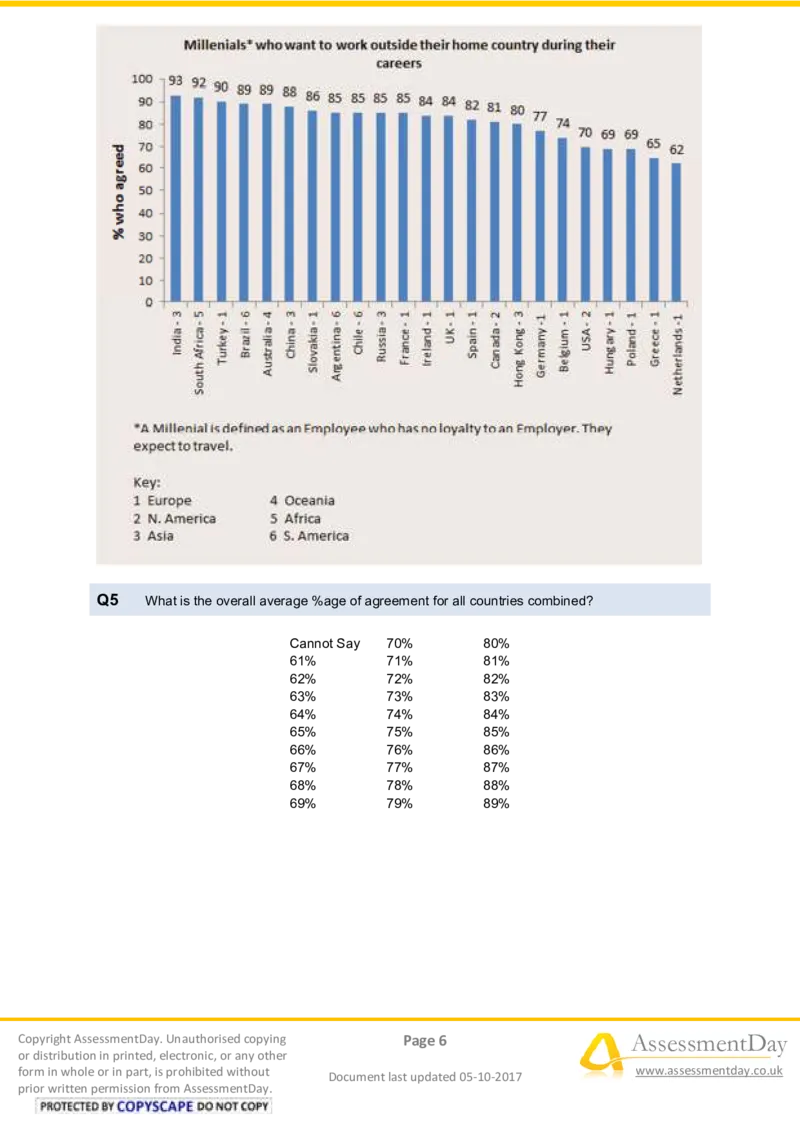
prior written permission from AssessmentDay.Q5 What is the overall average %age of agreement for all countries combined?
Cannot Say 70% 80%
61% 71% 81%
62% 72% 82%
63% 73% 83%
64% 74% 84%
65% 75% 85%
66% 76% 86%
67% 77% 87%
68% 78% 88%
69% 79% 89%
Copyright AssessmentDay. Unauthorised copying Page 6 AssessmentDay
or distribution in printed, electronic, or any other
form in whole or in part, is prohibited without
Document last updated 05-10-2017
www.assessmentday.co.uk
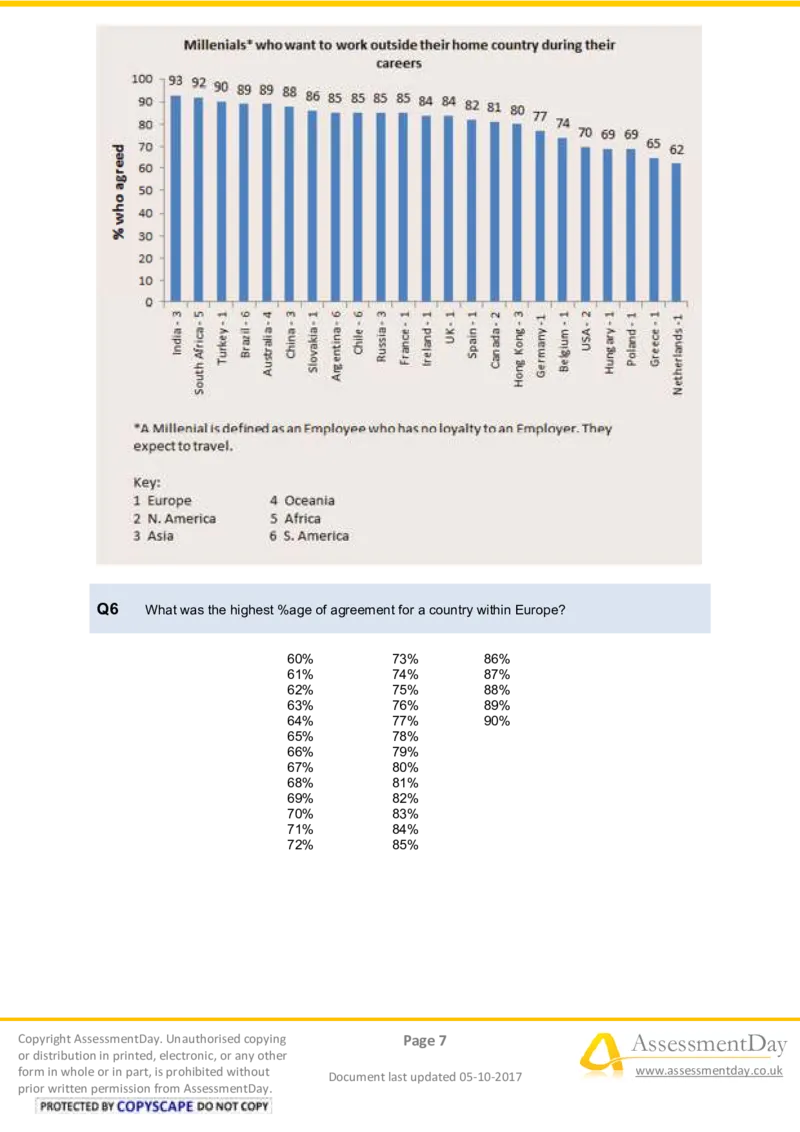
prior written permission from AssessmentDay.Q6 What was the highest %age of agreement for a country within Europe?
60% 73% 86%
61% 74% 87%
62% 75% 88%
63% 76% 89%
64% 77% 90%
65% 78%
66% 79%
67% 80%
68% 81%
69% 82%
70% 83%
71% 84%
72% 85%
Copyright AssessmentDay. Unauthorised copying Page 7 AssessmentDay
or distribution in printed, electronic, or any other
form in whole or in part, is prohibited without
Document last updated 05-10-2017
www.assessmentday.co.uk
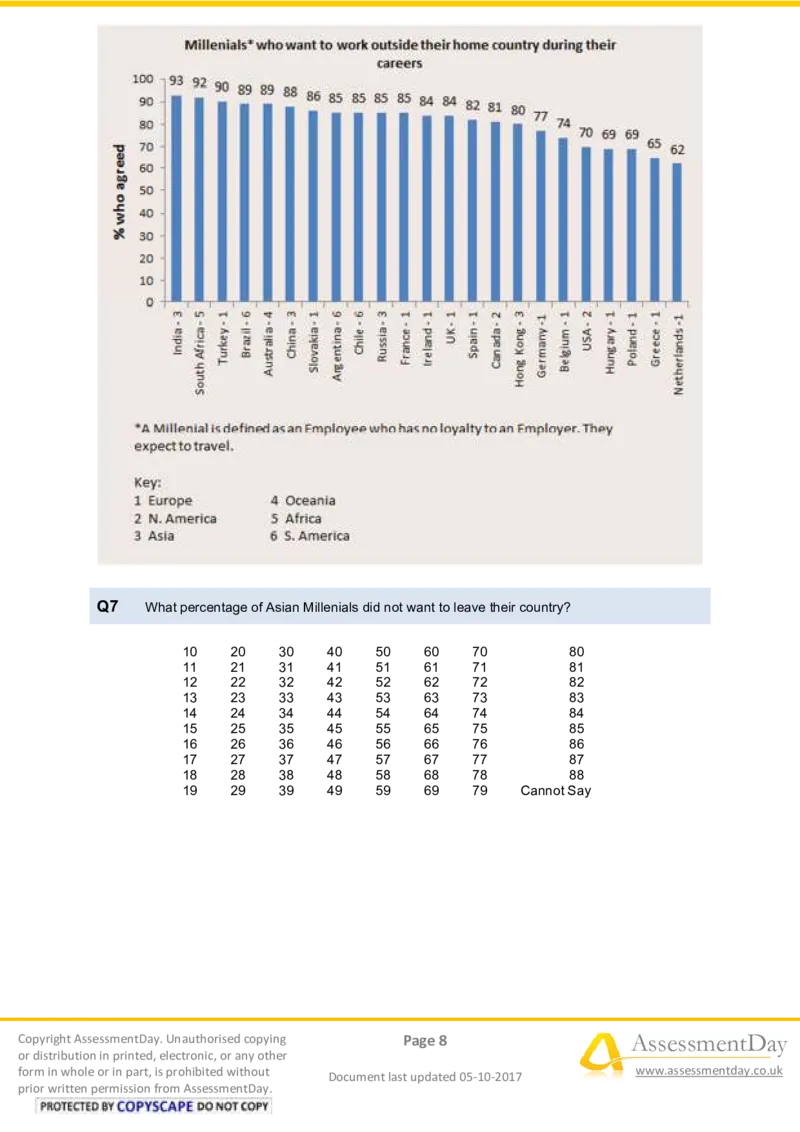
prior written permission from AssessmentDay.Q7 What percentage of Asian Millenials did not want to leave their country?
10 20 30 40 50 60 70 80
11 21 31 41 51 61 71 81
12 22 32 42 52 62 72 82
13 23 33 43 53 63 73 83
14 24 34 44 54 64 74 84
15 25 35 45 55 65 75 85
16 26 36 46 56 66 76 86
17 27 37 47 57 67 77 87
18 28 38 48 58 68 78 88
19 29 39 49 59 69 79 Cannot Say
Copyright AssessmentDay. Unauthorised copying Page 8 AssessmentDay
or distribution in printed, electronic, or any other
form in whole or in part, is prohibited without
Document last updated 05-10-2017
www.assessmentday.co.uk
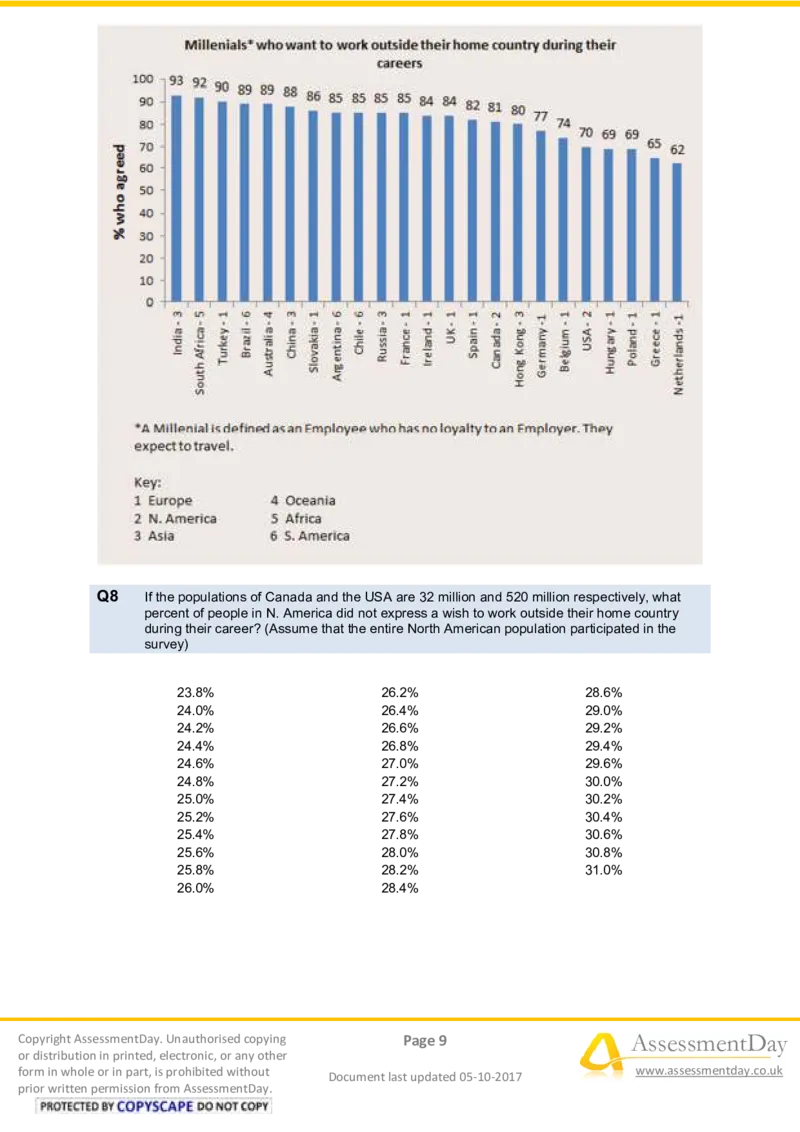
prior written permission from AssessmentDay.Q8 If the populations of Canada and the USA are 32 million and 520 million respectively, what
percent of people in N. America did not express a wish to work outside their home country
during their career? (Assume that the entire North American population participated in the
survey)
23.8% 26.2% 28.6%
24.0% 26.4% 29.0%
24.2% 26.6% 29.2%
24.4% 26.8% 29.4%
24.6% 27.0% 29.6%
24.8% 27.2% 30.0%
25.0% 27.4% 30.2%
25.2% 27.6% 30.4%
25.4% 27.8% 30.6%
25.6% 28.0% 30.8%
25.8% 28.2% 31.0%
26.0% 28.4%
Copyright AssessmentDay. Unauthorised copying Page 9 AssessmentDay
or distribution in printed, electronic, or any other
form in whole or in part, is prohibited without
Document last updated 05-10-2017
www.assessmentday.co.uk
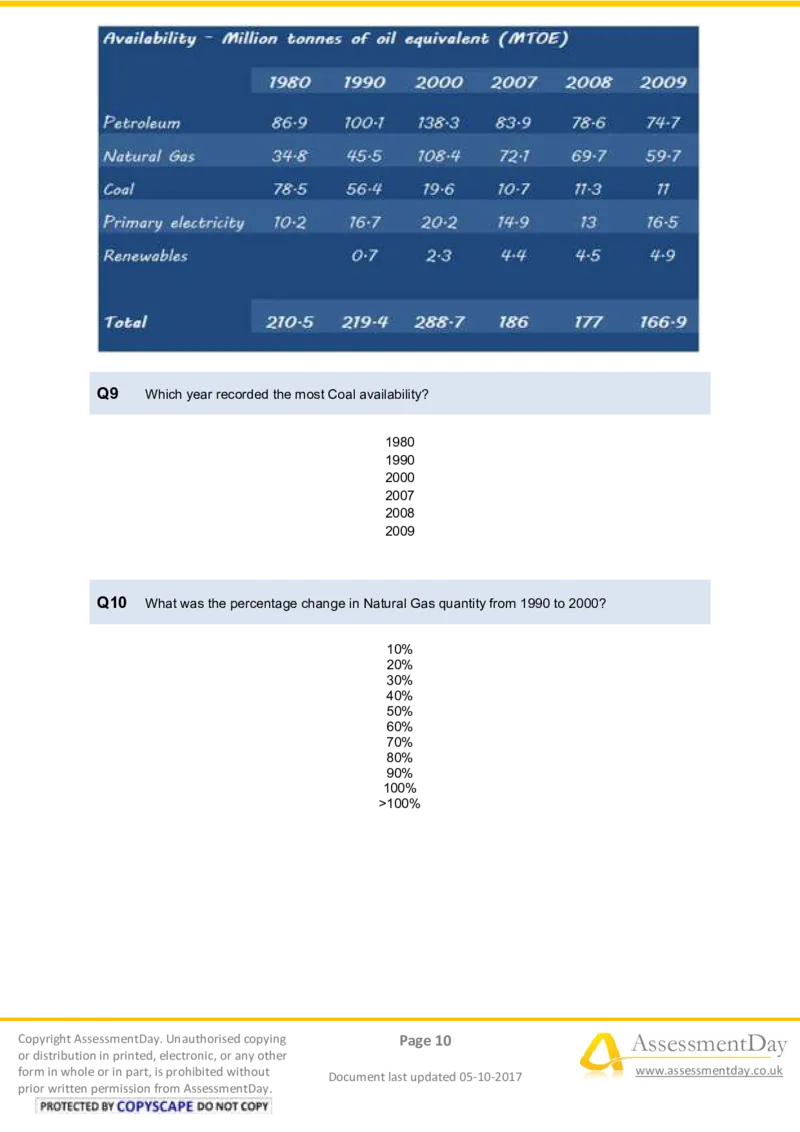
prior written permission from AssessmentDay.Q9 Which year recorded the most Coal availability?
1980
1990
2000
2007
2008
2009
Q10 What was the percentage change in Natural Gas quantity from 1990 to 2000?
10%
20%
30%
40%
50%
60%
70%
80%
90%
100%
>100%
Copyright AssessmentDay. Unauthorised copying Page 10 AssessmentDay
or distribution in printed, electronic, or any other
form in whole or in part, is prohibited without
Document last updated 05-10-2017
www.assessmentday.co.uk
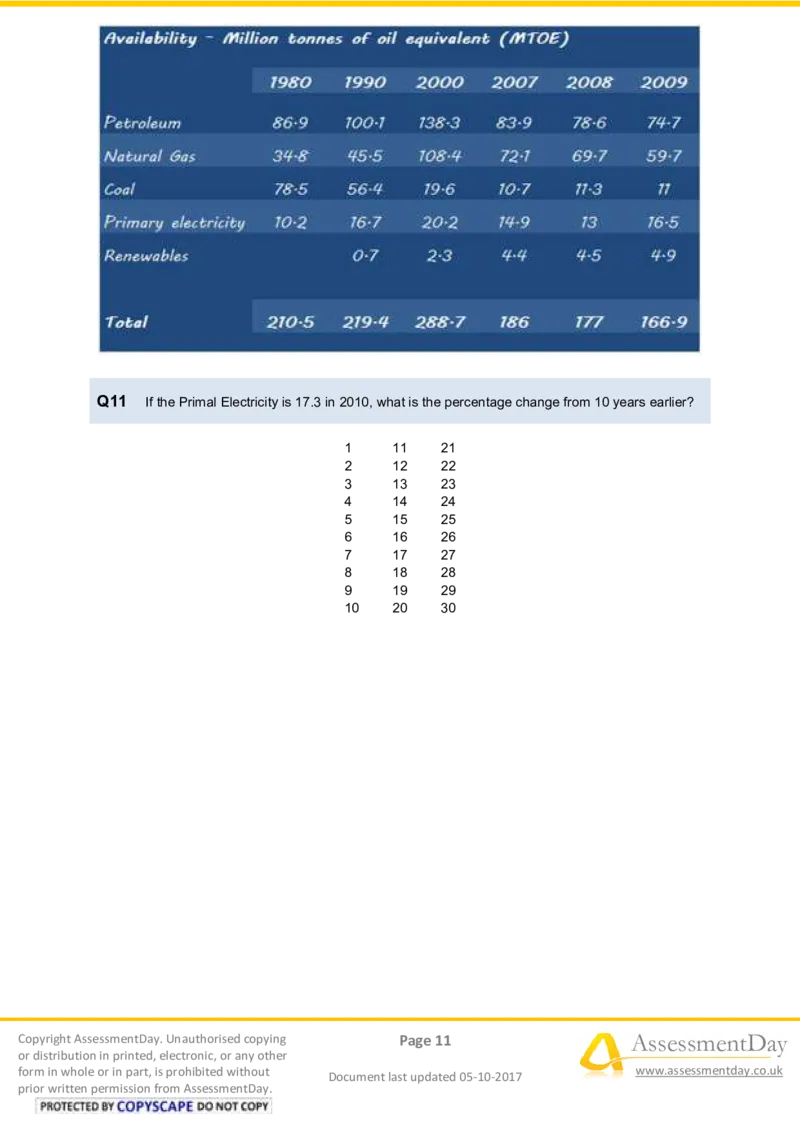
prior written permission from AssessmentDay.Q11 If the Primal Electricity is 17.3 in 2010, what is the percentage change from 10 years earlier?
1 11 21
2 12 22
3 13 23
4 14 24
5 15 25
6 16 26
7 17 27
8 18 28
9 19 29
10 20 30
Copyright AssessmentDay. Unauthorised copying Page 11 AssessmentDay
or distribution in printed, electronic, or any other
form in whole or in part, is prohibited without
Document last updated 05-10-2017
www.assessmentday.co.uk
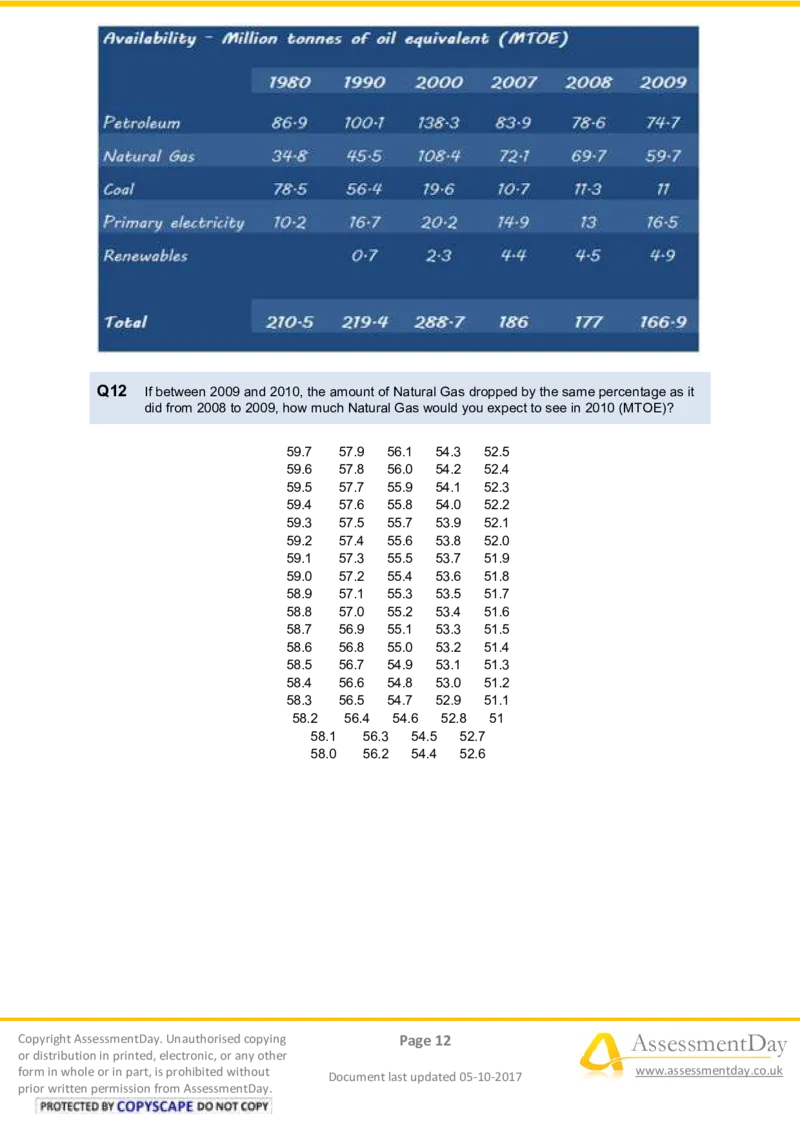
prior written permission from AssessmentDay.Q12 If between 2009 and 2010, the amount of Natural Gas dropped by the same percentage as it
did from 2008 to 2009, how much Natural Gas would you expect to see in 2010 (MTOE)?
59.7 57.9 56.1 54.3 52.5
59.6 57.8 56.0 54.2 52.4
59.5 57.7 55.9 54.1 52.3
59.4 57.6 55.8 54.0 52.2
59.3 57.5 55.7 53.9 52.1
59.2 57.4 55.6 53.8 52.0
59.1 57.3 55.5 53.7 51.9
59.0 57.2 55.4 53.6 51.8
58.9 57.1 55.3 53.5 51.7
58.8 57.0 55.2 53.4 51.6
58.7 56.9 55.1 53.3 51.5
58.6 56.8 55.0 53.2 51.4
58.5 56.7 54.9 53.1 51.3
58.4 56.6 54.8 53.0 51.2
58.3 56.5 54.7 52.9 51.1
58.2 56.4 54.6 52.8 51
58.1 56.3 54.5 52.7
58.0 56.2 54.4 52.6
Copyright AssessmentDay. Unauthorised copying Page 12 AssessmentDay
or distribution in printed, electronic, or any other
form in whole or in part, is prohibited without
Document last updated 05-10-2017
www.assessmentday.co.uk
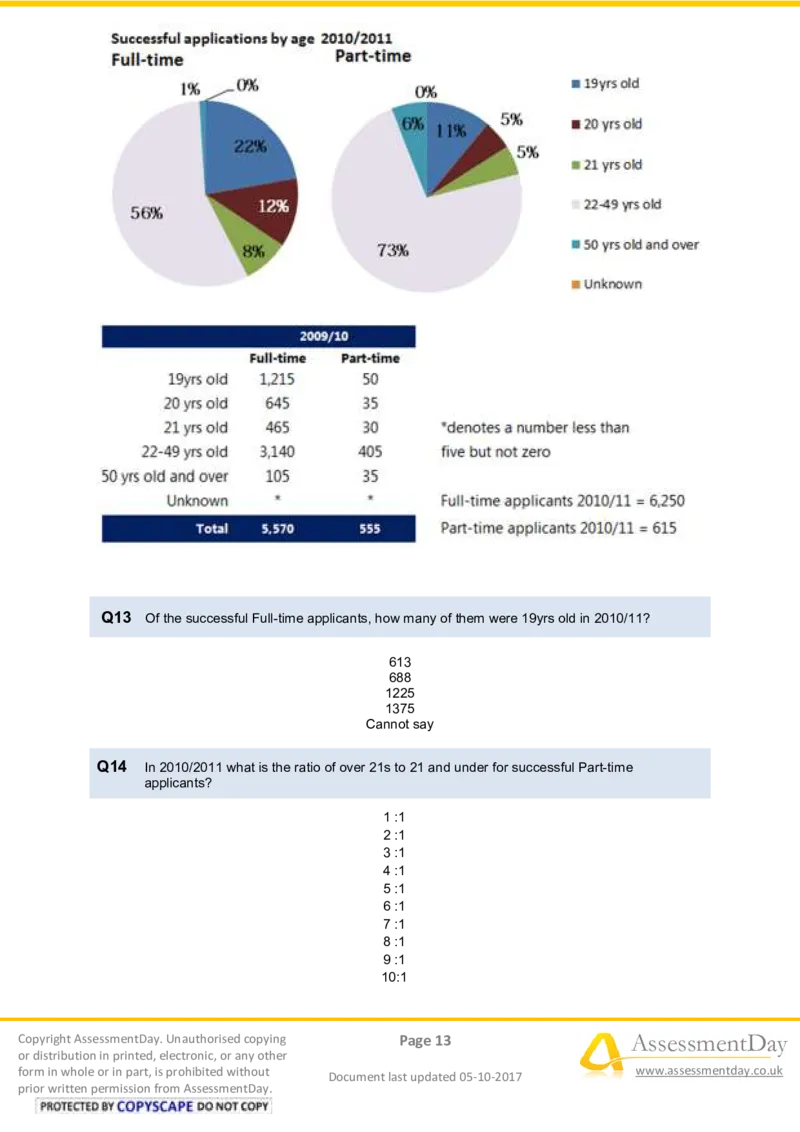
prior written permission from AssessmentDay.Q13 Of the successful Full-time applicants, how many of them were 19yrs old in 2010/11?
613
688
1225
1375
Cannot say
Q14 In 2010/2011 what is the ratio of over 21s to 21 and under for successful Part-time
applicants?
1 :1
2 :1
3 :1
4 :1
5 :1
6 :1
7 :1
8 :1
9 :1
10:1
Copyright AssessmentDay. Unauthorised copying Page 13 AssessmentDay
or distribution in printed, electronic, or any other
form in whole or in part, is prohibited without
Document last updated 05-10-2017
www.assessmentday.co.uk
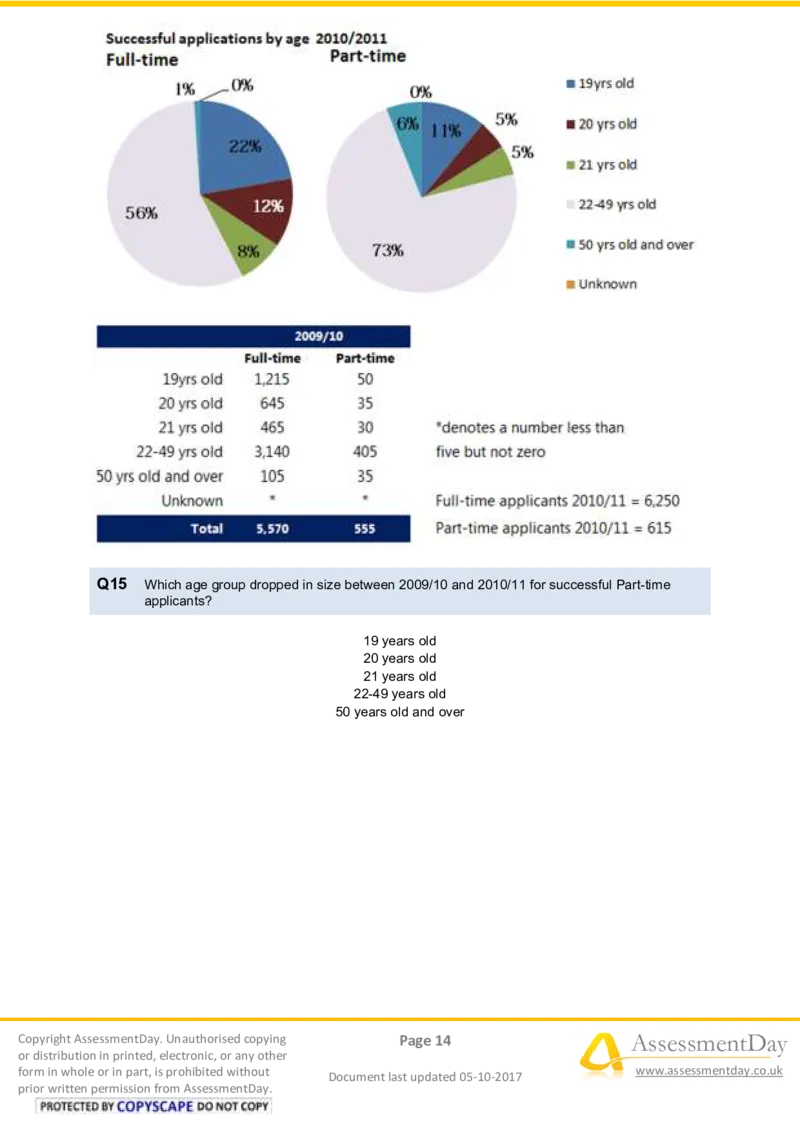
prior written permission from AssessmentDay.Q15 Which age group dropped in size between 2009/10 and 2010/11 for successful Part-time
applicants?
19 years old
20 years old
21 years old
22-49 years old
50 years old and over
Copyright AssessmentDay. Unauthorised copying Page 14 AssessmentDay
or distribution in printed, electronic, or any other
form in whole or in part, is prohibited without
Document last updated 05-10-2017
www.assessmentday.co.uk
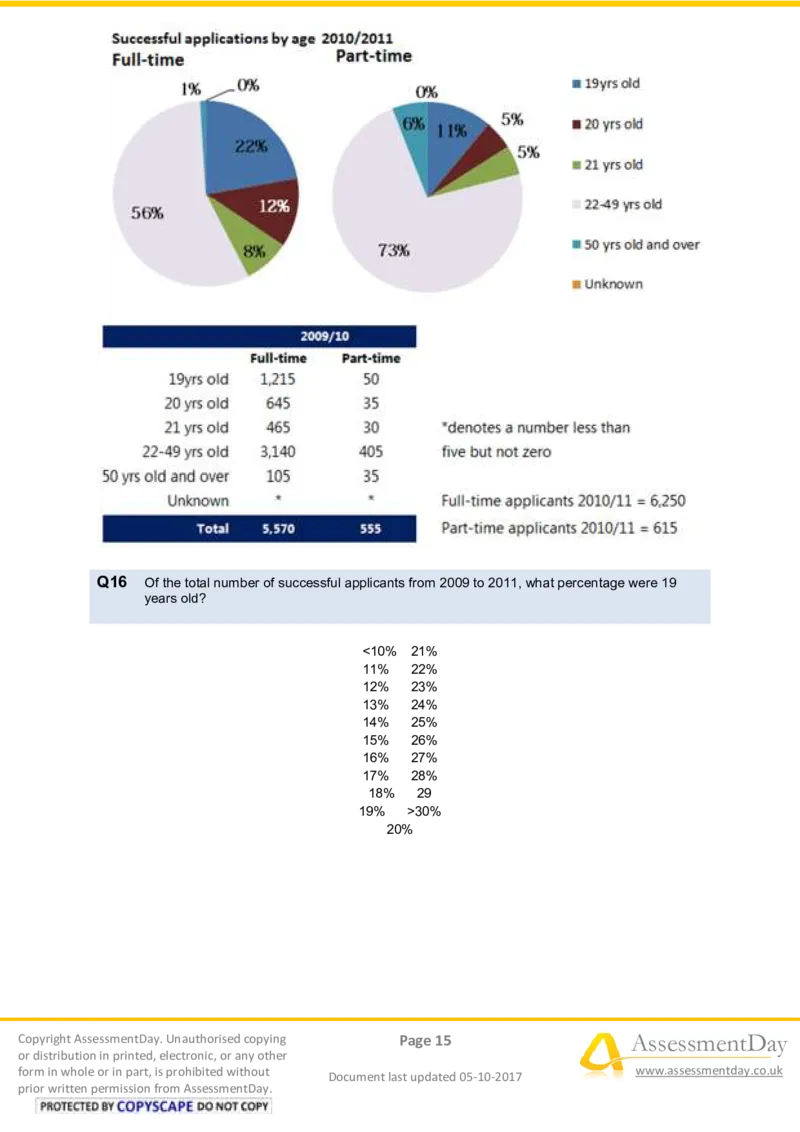
prior written permission from AssessmentDay.Q16 Of the total number of successful applicants from 2009 to 2011, what percentage were 19
years old?
<10% 21%
11% 22%
12% 23%
13% 24%
14% 25%
15% 26%
16% 27%
17% 28%
18% 29
19% >30%
20%
Copyright AssessmentDay. Unauthorised copying Page 15 AssessmentDay
or distribution in printed, electronic, or any other
form in whole or in part, is prohibited without
Document last updated 05-10-2017
www.assessmentday.co.uk
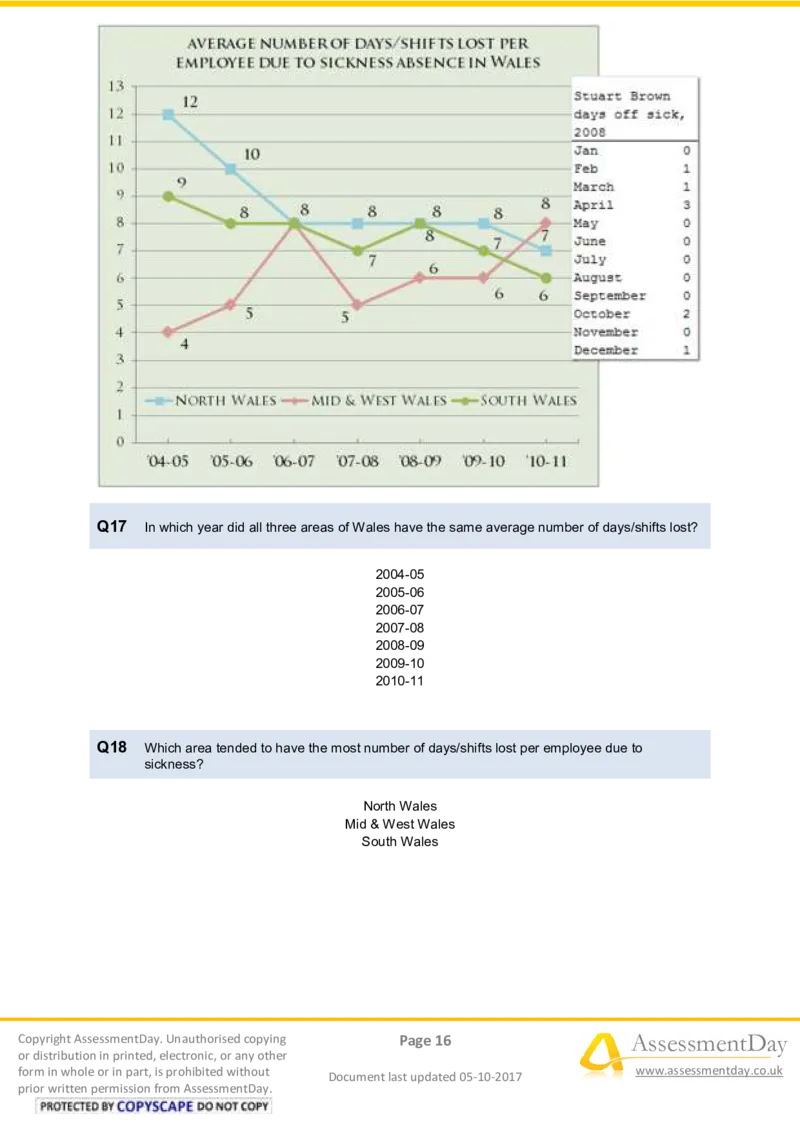
prior written permission from AssessmentDay.Q17 In which year did all three areas of Wales have the same average number of days/shifts lost?
2004-05
2005-06
2006-07
2007-08
2008-09
2009-10
2010-11
Q18 Which area tended to have the most number of days/shifts lost per employee due to
sickness?
North Wales
Mid & West Wales
South Wales
Copyright AssessmentDay. Unauthorised copying Page 16 AssessmentDay
or distribution in printed, electronic, or any other
form in whole or in part, is prohibited without
Document last updated 05-10-2017
www.assessmentday.co.uk
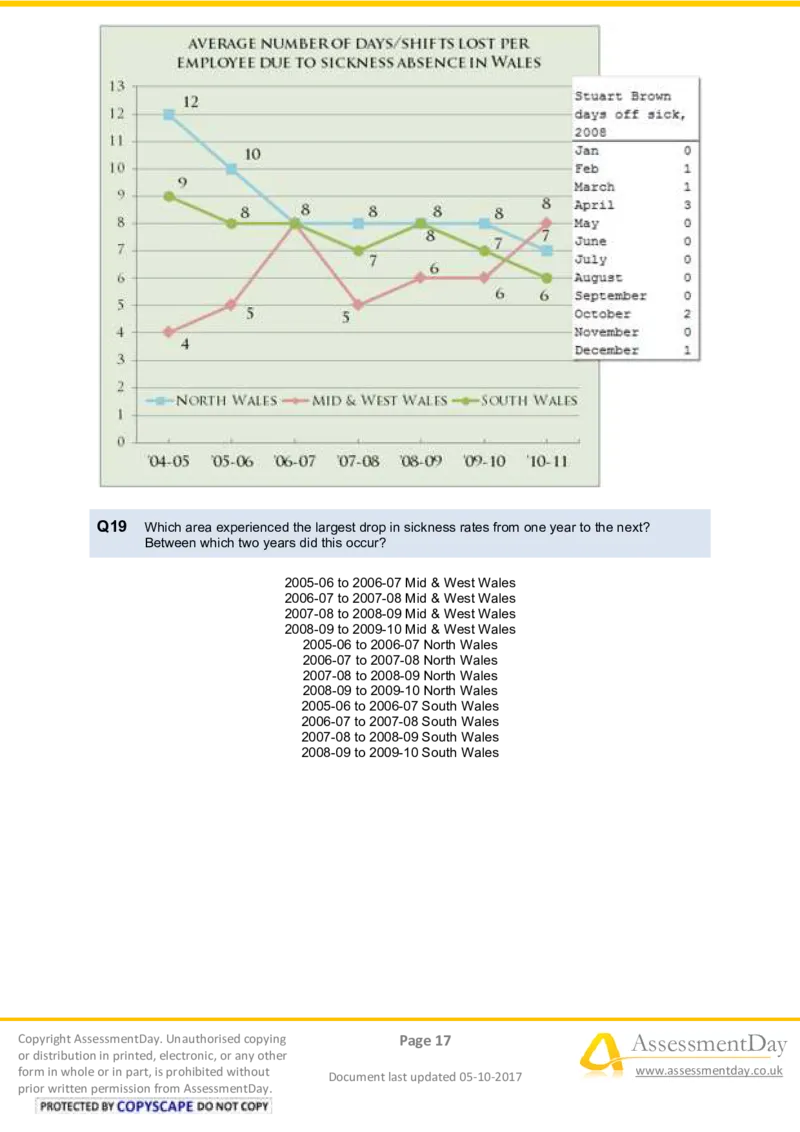
prior written permission from AssessmentDay.Q19 Which area experienced the largest drop in sickness rates from one year to the next?
Between which two years did this occur?
2005-06 to 2006-07 Mid & West Wales
2006-07 to 2007-08 Mid & West Wales
2007-08 to 2008-09 Mid & West Wales
2008-09 to 2009-10 Mid & West Wales
2005-06 to 2006-07 North Wales
2006-07 to 2007-08 North Wales
2007-08 to 2008-09 North Wales
2008-09 to 2009-10 North Wales
2005-06 to 2006-07 South Wales
2006-07 to 2007-08 South Wales
2007-08 to 2008-09 South Wales
2008-09 to 2009-10 South Wales
Copyright AssessmentDay. Unauthorised copying Page 17 AssessmentDay
or distribution in printed, electronic, or any other
form in whole or in part, is prohibited without
Document last updated 05-10-2017
www.assessmentday.co.uk
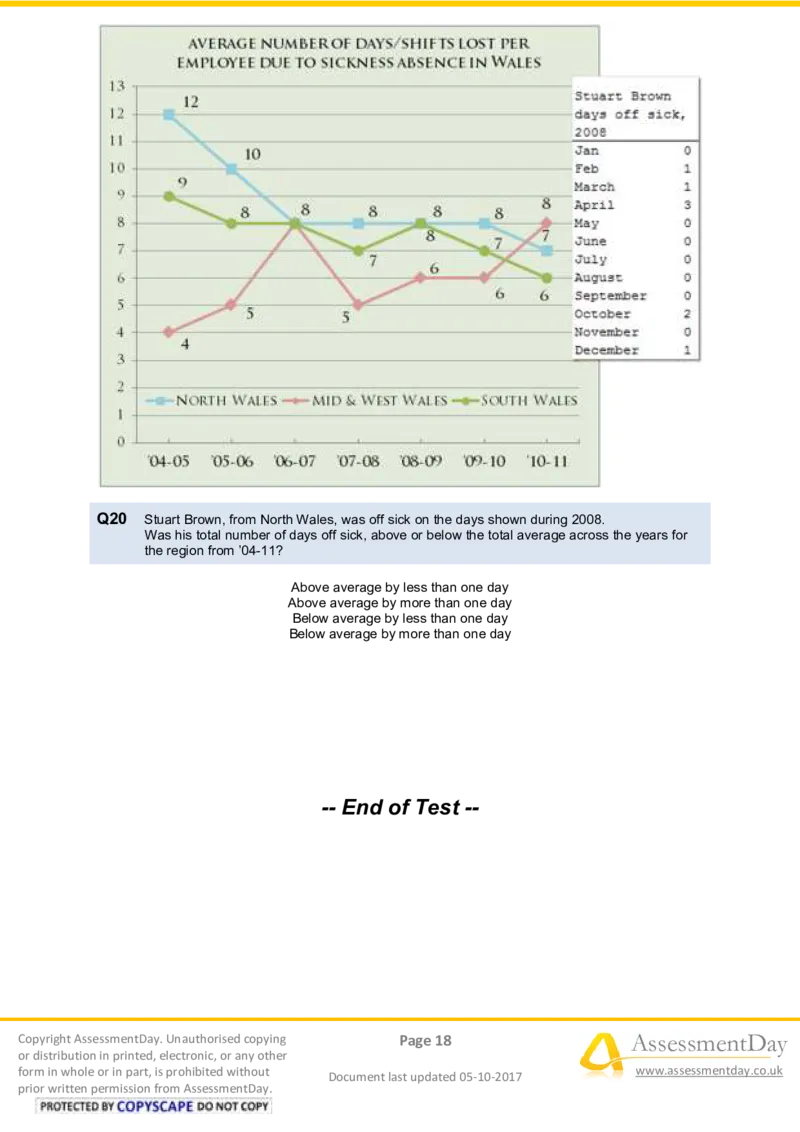
prior written permission from AssessmentDay.Q20 Stuart Brown, from North Wales, was off sick on the days shown during 2008.
Was his total number of days off sick, above or below the total average across the years for
the region from ’04-11?
Above average by less than one day
Above average by more than one day
Below average by less than one day
Below average by more than one day
-- End of Test --
Copyright AssessmentDay. Unauthorised copying Page 18 AssessmentDay
or distribution in printed, electronic, or any other
form in whole or in part, is prohibited without
Document last updated 05-10-2017
www.assessmentday.co.uk
prior written permission from AssessmentDay.

