 夜雨聆风
夜雨聆风


tracemalloc源码分析
目录
-
概述 1.1 什么是 tracemalloc 1.2 为什么需要 tracemalloc 1.3 设计目标与历史 -
核心架构 2.1 三层架构总览 2.2 关键数据结构 2.3 内存分配器挂载机制 -
源码分析 3.1 C 核心层:Python/tracemalloc.c 3.2 C 扩展层:Modules/_tracemalloc.c 3.3 Python 封装层:Lib/tracemalloc.py 3.4 内存追踪完整流程 -
功能详解 4.1 启动与停止追踪 4.2 快照与统计 4.3 快照对比与泄漏检测 4.4 过滤器系统 -
技术亮点 5.1 Hash Table 驻留优化 5.2 可重入调用检测 5.3 线程安全与 GIL 管理 5.4 域分离追踪 -
实践指南 6.1 快速上手 6.2 常见场景 6.3 性能影响与最佳实践 -
总结
1. 概述
1.1 什么是 tracemalloc
tracemalloc 是 Python 标准库中的内存分配追踪模块,自 Python 3.4 起引入(PEP 454)。它能在每次 Python 进行内存分配时捕获调用栈(traceback),记录内存块的大小、分配位置和调用链,从而精确定位内存泄漏和高内存消耗的代码路径。
与 Valgrind、Heapy 等外部工具不同,tracemalloc 深度集成在 CPython 解释器内部,通过钩子函数直接拦截 PyMem_Malloc、PyObject_Malloc、PyMem_RawMalloc 三类内存分配器的调用,在分配发生时同步捕获 Python 调用栈。
1.2 为什么需要 tracemalloc
Python 的内存管理分为两层:底层 C 库的 malloc/free 和上层 pymalloc 分配器。传统的内存分析工具面临两个核心困境:
-
Valgrind 可以追踪 C 层的 malloc调用,但无法穿透 pymalloc 看到实际的 Python 调用栈——它只能告诉你”某个 Python 对象分配了内存”,却说不出是代码的哪一行触发的 -
Heapy、Meliae 等纯 Python 工具依赖垃圾回收器(GC)遍历对象,但 str、tuple、bytes等基础类型的实例无处不在,它们无法区分哪些是正常使用的、哪些是泄漏的
tracemalloc 的核心价值在于:它在分配时刻就记录了完整的 Python 调用栈,即使是一行 s = "hello" 产生的字符串,也能精确追溯到源码位置。
1.3 设计目标与历史
PEP 454 由 Victor Stinner 于 2013 年提出,Python 3.4 正式合入。其设计基于两个基础设施:
-
PEP 445(Python 3.4)引入了自定义内存分配器 API,允许注册用户定义的分配器替换默认分配器 -
faulthandler 模块(Python 3.3)提供了从 C 层捕获 Python 调用栈的能力
设计者明确拒绝了”记录所有 malloc/free 日志”的方案——实测显示这种方式会产生 8.2 MB/s(约 29 GB/小时)的日志数据,完全不可行。最终选择了”仅追踪 Python 调用栈”的轻量方案。
但”只记录 traceback”本身还不够——如果每次分配都完整存储一份调用栈副本,内存开销同样会爆炸(一个 25 帧的 traceback 约 400 字节,百万次分配就是 400 MB)。为此 tracemalloc 引入了去重存储(interning)+ 哈希索引策略:相同调用栈只保留一个实例,通过 hash table 共享引用,从而在保持完整调用栈信息的同时将额外内存开销控制在合理范围内。这一”设计约束→实现策略”的映射,是理解后续所有数据结构设计的关键。
2. 核心架构
2.1 三层架构总览
tracemalloc 的实现分为三层,各有明确职责:
-
C 核心层( Python/tracemalloc.c,~800 行):实现内存分配器钩子、调用栈捕获、hash table 管理、线程安全控制 -
C 扩展层( Modules/_tracemalloc.c,~180 行):薄封装层,使用 Python Clinic 参数解析,将 C API 暴露为 Python 可调用函数 -
Python 封装层( Lib/tracemalloc.py,~400 行):提供Snapshot、Filter、Statistic等面向对象 API,实现快照对比和统计分组
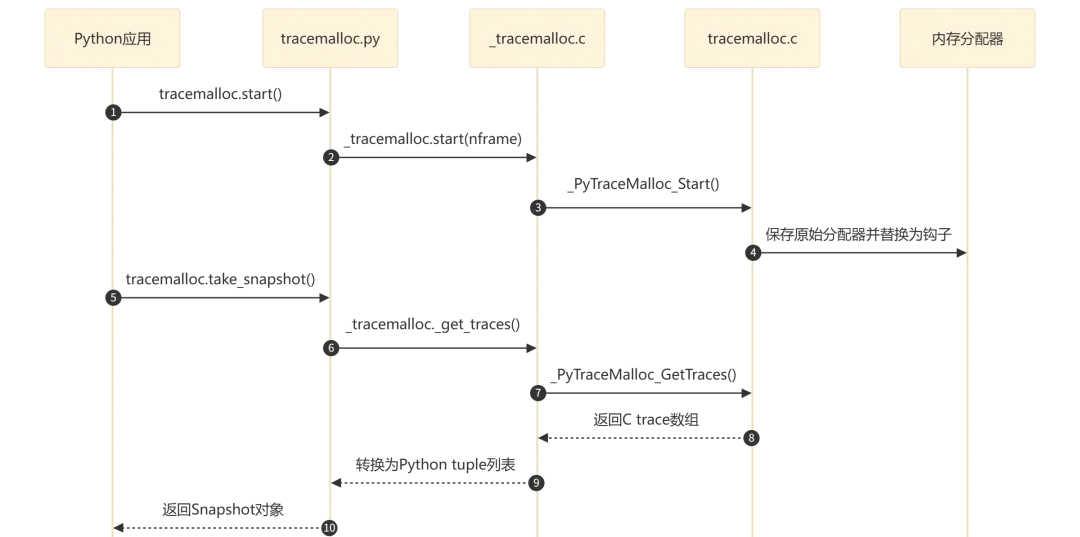
流程执行说明:
-
启动追踪(步骤 1-4):应用调用 start(),经过三层调用到达 C 核心,C 核心保存原始分配器并将三个域(Raw/Mem/Obj)的分配器替换为带追踪的钩子函数 -
获取快照(步骤 5-8):调用 take_snapshot()时,C 核心在锁保护下拷贝所有追踪数据,转换为 Python 对象后返回Snapshot实例
2.2 关键数据结构
tracemalloc 的核心数据结构定义在 Include/internal/pycore_tracemalloc.h 中,采用紧凑的 C 结构体设计:
frame_t — 调用栈帧
typedefstruct {PyObject *filename; // interned filename stringunsignedint lineno; // line number in source file} tracemalloc_frame;
每个 frame 代表一个调用栈帧,存储文件名(驻留字符串)和行号。
traceback_t — 完整调用栈
typedefstruct {Py_uhash_thash; // pre-computed hash for fast lookupuint16_tnframe; // actual frames storeduint16_t total_nframe; // total frames (may exceed max_nframe)tracemalloc_frame frames[1]; // flexible array of frames} tracemalloc_traceback;
使用柔性数组(flexible array member)存储变长帧序列。total_nframe 可能大于 nframe——当实际调用栈深度超过 max_nframe 限制时,只保留最内层的帧。
trace_t — 内存追踪记录
typedefstruct {uint64_thash; // pointer hash as keyuint64_tptr; // memory block pointertraceback_t *traceback; // shared traceback (interned)} tracemalloc_trace;
每条 trace 记录一个内存块的指针及其关联的调用栈。其中 ptr(内存地址)是 hash table 的实际查找键,hash 是 ptr 的预计算哈希值,用于加速查找。traceback 使用共享引用(驻留),相同调用栈的多次分配共享同一个 traceback_t 实例。
_tracemalloc_runtime_state — 运行时状态
typedefstruct {PyMemAllocatorEx allocators[3]; // original allocators (Raw/Mem/Obj)PyMutextables_lock; // protects all hash tablesPy_tss_t reentrant_key; // TLS for reentrant call detection_Py_hashtable_t *traces; // ptr → trace_t mapping_Py_hashtable_t *tracebacks; // hash → traceback_t interning table_Py_hashtable_t *filenames; // filename string interning tablePy_uhash_t empty_traceback; // pre-allocated empty traceback hashstructtracemalloc_configconfig;// max_nframe, initialized state} _tracemalloc_runtime_state;
所有运行时状态集中在一个结构体中。该结构体由 C 核心层(Python/tracemalloc.c)维护,挂载在 CPython 的全局运行时 _PyRuntimeState 中,与解释器生命周期绑定。每个 Python 解释器实例拥有独立的 _tracemalloc_runtime_state,因此在多解释器(sub-interpreter)场景下,各解释器的追踪状态互不干扰。
2.3 内存分配器挂载机制
Python 的内存分配器分为三个域(domain),每个域有独立的分配器实例:
|
|
|
|
|---|---|---|
|
|
PyMem_RawMalloc
|
|
|
|
PyMem_Malloc
|
|
|
|
PyObject_Malloc
|
|
tracemalloc 启动时,通过 PyMem_GetAllocator() 保存原始分配器,再通过 PyMem_SetAllocator() 注册钩子分配器。三个域分别注册,确保完整覆盖。
替换完成后,每次内存分配的调用路径变为:
PyMem_Malloc(size)→ tracemalloc_alloc() # 钩子入口:可重入检测 + GIL 管理→ original_malloc(size) # 先调用原始分配器获取内存→ traceback_new() # 捕获当前 Python 调用栈→ ADD_TRACE(ptr, size) # 将 trace 记录到 hash table
即:钩子函数先完成实际内存分配,拿到有效指针后再捕获调用栈并记录 trace。这个顺序是合理的——如果 malloc 返回 NULL(分配失败),则跳过追踪记录,避免记录无效指针。
3. 源码分析
3.1 C 核心层:Python/tracemalloc.c
分配钩子函数
tracemalloc_alloc() 是所有内存分配的入口钩子:
staticvoid*tracemalloc_alloc(int use_cpython_allocator, domain_t domain,PyMemAllocatorEx*allocator,void*ptr,size_t size){void *ptr2;// Reentrant call detection via Thread-Local Storageif (get_reentrant()) {return allocator->malloc(allocator->ctx, size);}set_reentrant(1);// For Raw domain: ensure GIL is heldint nogil = 0;if (domain == _PyTraceMalloc_RAW_DOMAIN) {nogil = PyGILState_Ensure();}// Call original allocatorif (use_cpython_allocator) {ptr2 = _PyMem_RawMalloc(size);} else {ptr2 = allocator->malloc(allocator->ctx, size);}if (ptr2 != NULL) {TABLES_LOCK();ADD_TRACE(ptr2, size, domain);TABLES_UNLOCK();}// Cleanupif (domain == _PyTraceMalloc_RAW_DOMAIN) {PyGILState_Release(nogil);}set_reentrant(0);return ptr2;}
关键设计点:
-
可重入检测:通过 Py_tss_t(Thread-Local Storage)标记当前线程是否已在追踪流程中。如果在追踪过程中又触发了内存分配(如 hash table 扩容),直接调用原始分配器,避免无限递归 -
GIL 管理:Raw 域的分配器可能在无 GIL 的上下文中被调用(如 C 扩展的底层操作),因此需要 PyGILState_Ensure()显式获取 GIL 才能安全操作 Python 对象 -
锁粒度: TABLES_LOCK()使用PyMutex(轻量自旋锁),仅在操作 hash table 时持锁,分配完成后立即释放
调用栈捕获
traceback_new() 负责从当前线程状态中捕获 Python 调用栈:
statictraceback_t*traceback_new(void){tracemalloc_runtime_state *state = &STATE;traceback_t *traceback;_Py_hashtable_t *tracebacks = state->tracebacks;int nframe;// Fill traceback buffer with current framesnframe = traceback_get_frames(&state->traceback_buffer);// Compute hash over all framestraceback = &state->traceback_buffer;traceback->hash = traceback_hash(traceback);// Intern: lookup existing or insert newtraceback_t *existing = _Py_HASHTABLE_GET(tracebacks, traceback);if (existing != NULL) {return existing; // reuse existing interned traceback}// Allocate and copy new tracebacktraceback = traceback_copy(traceback);if (traceback == NULL) {return state->empty_traceback;}_Py_HASHTABLE_SET(tracebacks, traceback->hash, traceback);return traceback;}
驻留(interning)机制的核心思想:相同调用栈只存储一份。多个内存分配可能共享完全相同的调用路径,hash table 确保物理上只有一个 traceback_t 实例。
帧遍历
traceback_get_frames() 沿 _PyInterpreterFrame 链向上遍历:
staticinttraceback_get_frames(traceback_t *traceback){PyThreadState *tstate = PyThreadState_Get();_PyInterpreterFrame *frame = tstate->current_frame;int nframe = 0;while (frame != NULL && nframe < max_nframe) {tracemalloc_get_frame(frame, nframe, traceback);frame = frame->previous;nframe++;}traceback->nframe = nframe;return nframe;}
帧按照调用深度从内到外(最新→最旧)存储。Python 层的 Traceback 类在返回给用户时会反转顺序,使最旧的帧(入口点)排在前面。
3.2 C 扩展层:Modules/_tracemalloc.c
C 扩展层是一个薄封装,使用 Python Clinic 自动生成参数解析代码:
/*[clinic input]_tracemalloc.startnframe: int = 1/Start tracing Python memory allocations.Also set the maximum number of frames composing a traceback.[clinic start generated code]*/static PyObject *_tracemalloc_start_impl(PyObject *module, int nframe){if (_PyTraceMalloc_Start(nframe) < 0)returnNULL;Py_RETURN_NONE;}
所有公开函数都遵循相同的模式:Clinic 生成参数解析 → 调用 _PyTraceMalloc_* 函数 → 返回结果。这层不包含任何业务逻辑,纯粹是 FFI 桥接。
3.3 Python 封装层:Lib/tracemalloc.py
Python 层提供了面向对象的 API,核心类包括:
Snapshot — 内存快照
classSnapshot:traces: list[Trace]deffilter_traces(self, filters) -> "Snapshot":"""Filter traces by inclusive/exclusive patterns."""...defstatistics(self, key_type="filename", cumulative=False) -> list[Statistic]:"""Group traces and compute aggregate statistics."""return _group_by(self.traces, key_type, cumulative)defcompare_to(self, old_snapshot, key_type="filename") -> list[StatisticDiff]:"""Compare with another snapshot to find memory changes."""...defdump(self, filename):"""Serialize snapshot to file (pickle)."""...
Statistic / StatisticDiff — 统计结果
@dataclassclassStatistic:traceback: Tracebacksize: int# total size in bytescount: int# number of allocations@dataclassclassStatisticDiff:traceback: Tracebacksize: intsize_diff: int# change since old snapshotcount: intcount_diff: int# change since old snapshot
分组统计逻辑 _group_by():
def_group_by(traces, key_type, cumulative):stats = {}for trace in traces:if key_type == "traceback":key = trace.tracebackelif key_type == "filename":key = (trace.traceback[0].filename,)elif key_type == "lineno":key = (trace.traceback[0].filename, trace.traceback[0].lineno)stat = stats.get(key)if stat isNone:stat=Statistic(trace.traceback,0,0)stats[key] = statstat.size += trace.sizestat.count += 1returnsorted(stats.values(), key=attrgetter("size"), reverse=True)
key_type 掯制聚合粒度:按完整调用栈、按文件名、或按文件名+行号。cumulative=True 时会累加调用链上每一层帧的统计量。
3.4 内存追踪完整流程
以下是 malloc 被调用时的完整追踪流程:
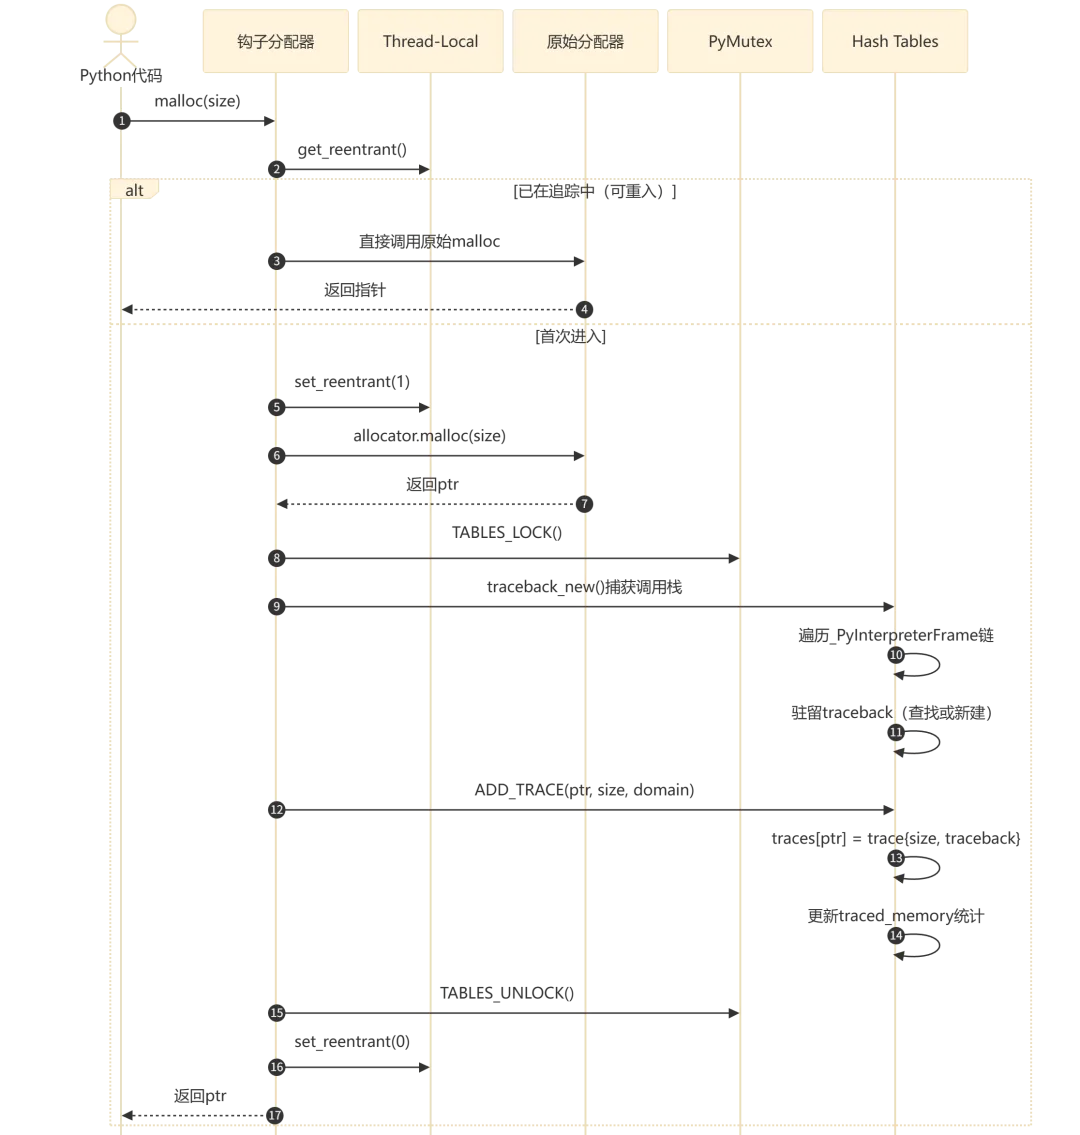
流程执行说明:
-
入口(步骤 1-2):Python 代码触发内存分配,进入 tracemalloc 的钩子函数 -
可重入检测(步骤 3-5):通过 TLS 判断当前线程是否已在追踪流程中。如果是,直接调用原始分配器返回,避免 hash table 操作引发的二次分配导致无限递归 -
实际分配(步骤 6-7):调用原始分配器获取内存指针 -
追踪记录(步骤 8-12):获取锁后,捕获当前调用栈(遍历 _PyInterpreterFrame链),通过驻留机制查找或创建 traceback 实例,将(ptr → {size, traceback})记录到 traces hash table,更新traced_memory和peak_traced_memory -
释放锁并返回(步骤 13-15):解锁、清除重入标记、返回指针
4. 功能详解
4.1 启动与停止追踪
启动:
import tracemalloctracemalloc.start(nframe=25) # capture up to 25 frames per allocation
start() 内部调用 _PyTraceMalloc_Start(),执行以下操作:
-
将 max_nframe保存到 config -
调用 PyMem_GetAllocator()分别保存三个域(Raw/Mem/Obj)的原始分配器 -
创建或重置所有 hash table(traces、tracebacks、filenames、domains) -
调用 PyMem_SetAllocator()注册钩子分配器 -
设置 PyRefTracer回调(用于追踪已存在对象的引用变化) -
通过原子操作将 tracing标志设为 1
停止:
tracemalloc.stop()停止时执行逆向操作:原子地将 tracing 设为 0 → 恢复原始分配器 → 清除所有 hash table → 移除 PyRefTracer。
重要细节:tracing 标志使用原子操作(_Py_atomic_load_int / _Py_atomic_store_int),确保在多线程环境下,分配器钩子能无锁地快速判断是否需要追踪,只有在需要追踪时才加锁。
4.2 快照与统计
snapshot = tracemalloc.take_snapshot()stats = snapshot.statistics("lineno")for stat in stats[:10]:print(stat)
_PyTraceMalloc_GetTraces() 的实现采用了”拷贝后转换”的策略:
PyObject *_PyTraceMalloc_GetTraces(void){// Phase 1: copy all traces under lock (fast, C-level)TABLES_LOCK();// iterate traces hashtable, copy ptr/size/traceback into arrayTABLES_UNLOCK();// Phase 2: convert to Python tuples without lock (slow, Python-level)// build (domain, size, traceback_tuple, ptr) for each tracereturnlist;}
这种设计将锁的持有时间最小化——只在实际拷贝 C 数据结构时持锁,转换为 Python 对象的过程在无锁状态下完成,避免阻塞其他线程的内存分配。
4.3 快照对比与泄漏检测
快照对比是 tracemalloc 最常用的功能,用于定位内存泄漏:
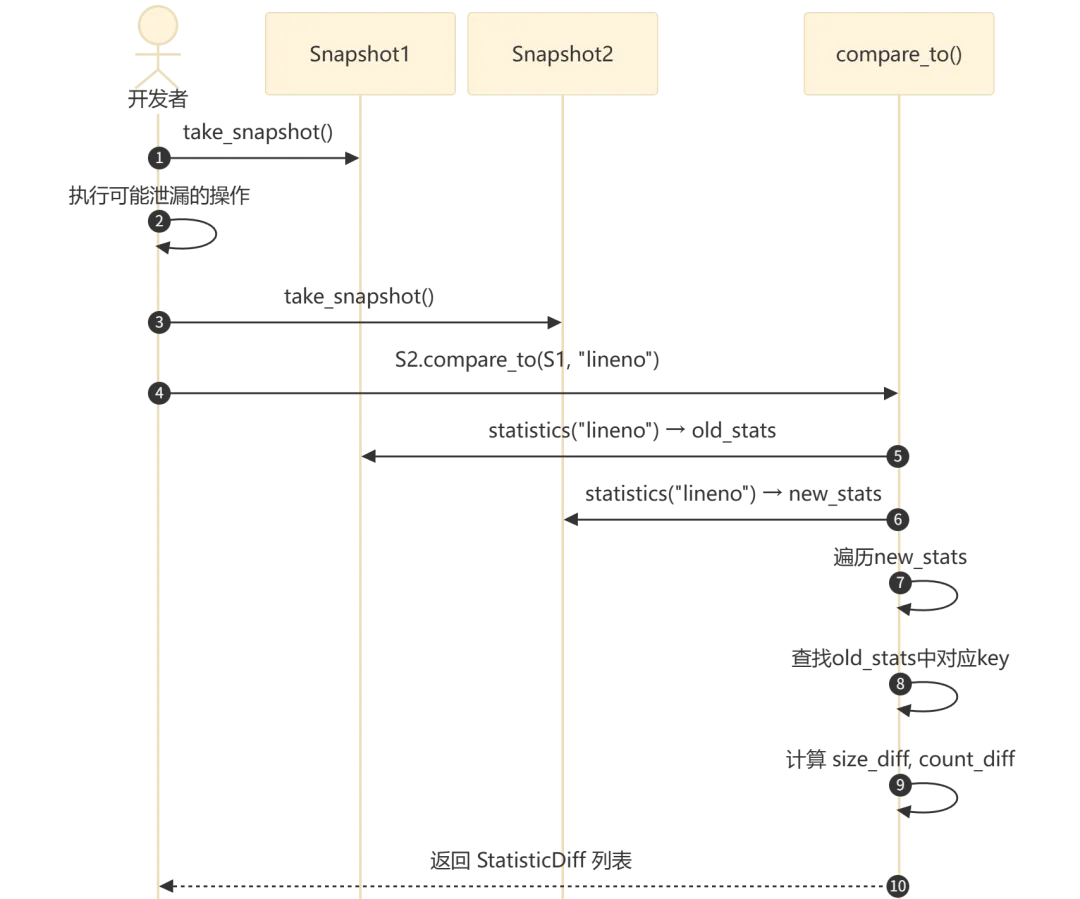
流程执行说明:
-
获取基线快照(步骤 1):在操作前记录当前内存状态 -
执行操作(步骤 2):运行可能产生内存泄漏的代码 -
获取结束快照(步骤 3):记录操作后的内存状态 -
对比分析(步骤 4-8):按 lineno粒度分别统计两个快照,对每个统计键计算差值(size_diff、count_diff),按size_diff降序排列 -
返回结果(步骤 9):正值表示内存增长(潜在泄漏),负值表示内存释放
使用示例:
import tracemalloctracemalloc.start()# Take baseline snapshotsnapshot1 = tracemalloc.take_snapshot()# ... run suspicious code ...# Take comparison snapshotsnapshot2 = tracemalloc.take_snapshot()# Find top memory increasestop_stats = snapshot2.compare_to(snapshot1, "lineno")for stat in top_stats[:10]:print(f"{stat.traceback}: +{stat.size_diff} bytes ({stat.count_diff} blocks)")
4.4 过滤器系统
Filter 和 DomainFilter 用于从快照中筛选感兴趣的分配:
# Only include allocations from my projectfilters = [tracemalloc.Filter(True, "myproject/*.py")]filtered = snapshot.filter_traces(filters)# Exclude standard libraryfilters = [tracemalloc.Filter(False, "<stdlib>/*")]filtered = snapshot.filter_traces(filters)# Filter by domainfilters = [tracemalloc.DomainFilter(True, 1)]filtered = snapshot.filter_traces(filters)
过滤器使用 fnmatch 模式匹配文件名,支持包含(inclusive=True)和排除(inclusive=False)两种模式。多个过滤器组合时,每个 trace 必须通过所有包含过滤器且不被任何排除过滤器排除。
5. 技术亮点
5.1 Hash Table 驻留优化
tracemalloc 大量使用驻留(interning)模式来减少内存开销。三个 hash table 分别驻留不同类型的对象:
-
filenames:文件名字符串驻留。不同调用栈中相同文件名(如"/usr/lib/python3.12/os.py")只保存一个PyUnicodeObject引用 -
tracebacks:完整调用栈驻留。相同的帧序列只创建一个traceback_t实例 -
traces:每个内存指针到追踪记录的映射,这是唯一不做驻留的 hash table
驻留的效果:在一个追踪了数十万次分配的场景中,相同的调用栈可能被数千次共享。实测中,驻留可以将追踪的额外内存开销降低 50%-80%。
5.2 可重入调用检测
内存追踪本身也需要分配内存(hash table 操作、字符串创建等)。如果不处理这种情况,会形成无限递归:
malloc → tracemalloc_alloc → traceback_new → _Py_hashtable_set → malloc → ...解决方案是 Py_tss_t(Thread-Local Storage):
staticintget_reentrant(void){return (int)(uintptr_t)PyThread_tss_get(&STATE.reentrant_key);}staticvoidset_reentrant(int value){PyThread_tss_set(&STATE.reentrant_key, (void*)(uintptr_t)value);}
每个线程维护独立的重入标志。当钩子函数检测到重入时,直接调用原始分配器,跳过所有追踪逻辑。
5.3 线程安全与 GIL 管理
tracemalloc 的线程安全设计需要考虑 Python 3.13+ 的 free-threaded(no-GIL)模式。为什么不能直接依赖 GIL?因为 Raw 域的分配器调用可能发生在没有 GIL 的上下文中(如 C 扩展的底层操作、Python 初始化早期阶段),此时 GIL 并不持有,tracemalloc 必须有独立的锁机制来保护共享状态。
-
tables_lock:PyMutex轻量自旋锁,保护所有 hash table 操作。在有 GIL 的构建中,PyMutex实际上是空操作(因为 GIL 已经保证了线程安全);在 free-threaded 构建中,PyMutex退化为真正的互斥锁。这种设计让同一份代码在两种构建模式下都正确工作 -
tracing标志:使用_Py_atomic_store_int原子写入,_Py_atomic_load_int原子读取,确保多线程可见性。分配器钩子在每次调用时首先读取这个标志(快速路径),只有当追踪启用时才进入完整的追踪逻辑 -
Raw 域特殊处理: PyMem_Raw分配器可能在 Python 初始化期间或 C 扩展的无 GIL 上下文中调用,钩子函数需要PyGILState_Ensure()显式获取 GIL,完成后通过PyGILState_Release()释放
5.4 域分离追踪
tracemalloc 支持自定义域(domain)追踪,默认域为 0:
#define _PyTraceMalloc_RAW_DOMAIN 0自定义域通过 _PyTraceMalloc_Track() 和 _PyTraceMalloc_Untrack() API 手动管理。Python 层的 DomainFilter 可以按域过滤追踪记录。这在第三方库(如 numpy)需要独立追踪其 C 层内存分配时特别有用。
6. 实践指南
6.1 快速上手
import tracemallocimport linecache# Start tracing with 25 frames per allocationtracemalloc.start(25)# Your application code here# ...# Take snapshot and display top memory consumerssnapshot = tracemalloc.take_snapshot()top_stats = snapshot.statistics("lineno")print("[ Top 10 ]")for stat in top_stats[:10]:print(stat)
6.2 常见场景
定位内存泄漏:
import tracemalloctracemalloc.start(25)deffind_leak():snapshot1 = tracemalloc.take_snapshot()# Run the suspected leaky operationleaky_function()snapshot2 = tracemalloc.take_snapshot()top_stats = snapshot2.compare_to(snapshot1, "lineno")for stat in top_stats[:5]:print(stat)find_leak()
追踪大对象分配:
import tracemalloctracemalloc.start(25)# Filter to only see allocations > 10KBsnapshot = tracemalloc.take_snapshot()for stat in snapshot.statistics("traceback"):if stat.size > 10 * 1024:print(stat)for line in stat.traceback.format():print(line)
持续监控:
import tracemallocimport timetracemalloc.start(25)whileTrue:snapshot = tracemalloc.take_snapshot()current, peak = tracemalloc.get_traced_memory()print(f"Current: {current / 1024:.1f} KB, Peak: {peak / 1024:.1f} KB")top = snapshot.statistics("lineno")[0]print(f" Top: {top}")time.sleep(60)
6.3 性能影响与最佳实践
-
nframe参数直接影响性能和内存开销。nframe=1最快(仅记录直接调用者),nframe=25提供完整上下文但开销更大。生产环境建议nframe=5-10 -
长期运行的生产服务不建议持续开启 tracemalloc。推荐在检测到内存异常时动态开启:先 start(),运行一段时间后take_snapshot()分析,再stop() -
快照对比时使用 filter_traces()排除标准库和第三方库的分配,聚焦业务代码 -
使用 dump()/load()将快照序列化到文件,便于离线分析和跨进程比较 -
get_tracemalloc_memory()可以查看 tracemalloc 自身的内存消耗,评估追踪开销
7. 总结
tracemalloc 的源码揭示了一个精巧的系统级工具设计:
-
三层架构分离关注点:C 核心负责高性能追踪,C 扩展负责桥接,Python 层负责用户友好的 API -
驻留模式(filenames、tracebacks)通过 hash table 共享大幅降低内存开销,是处理海量分配记录的关键优化 -
可重入检测(TLS)和细粒度锁策略(原子标志 + PyMutex + GIL 管理)确保了线程安全与性能的平衡 -
“拷贝后转换”的快照获取策略将锁持有时间最小化,避免阻塞内存分配关键路径
对于 Python 开发者而言,tracemalloc 是定位内存问题的一等工具——它不需要外部依赖、不需要重启应用、不需要特殊编译选项,import tracemalloc 即可开始追踪。理解其源码不仅有助于更好地使用这个工具,也为设计类似的高性能追踪系统提供了参考模式。
参考文献
[1] PEP 454 — Add a new tracemalloc module to trace Python memory allocations:https://peps.python.org/pep-0454/
[2] PEP 445 — Add new APIs to customize Python memory allocators:https://peps.python.org/pep-0445/
[3] CPython Source: Python/tracemalloc.c:https://github.com/python/cpython/blob/main/Python/tracemalloc.c
[4] CPython Source: Include/internal/pycore_tracemalloc.h:https://github.com/python/cpython/blob/main/Include/internal/pycore_tracemalloc.h
[5] CPython Source: Modules/_tracemalloc.c:https://github.com/python/cpython/blob/main/Modules/_tracemalloc.c
[6] CPython Source: Lib/tracemalloc.py:https://github.com/python/cpython/blob/main/Lib/tracemalloc.py
[7] Python Documentation — tracemalloc:https://docs.python.org/3/library/tracemalloc.html