
文档内容
Numerical Critical Reasoning
Test 6
Questions Booklet
Instructions
This numerical reasoning test comprises 21 questions, and you will have to correctly
answer as many as you can. Calculators are permitted for this test, and it is
recommended you have some rough paper to work on.
You will have to work quickly and accurately to perform well in this test. The test does
not have an overall time limit however each question has a time limit. The first
question relating to each table or graph has 90 seconds, and subsequent questions
relating to the same table or graph have 75 seconds.
Try to find a time and place where you will not be interrupted during the test. The test
will begin on the next page.
AssessmentDay
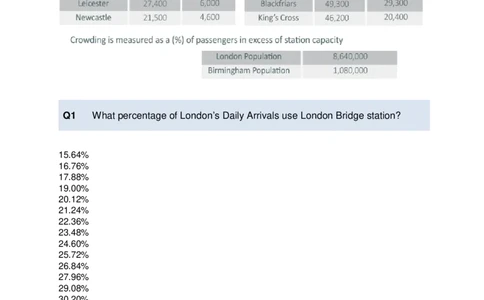
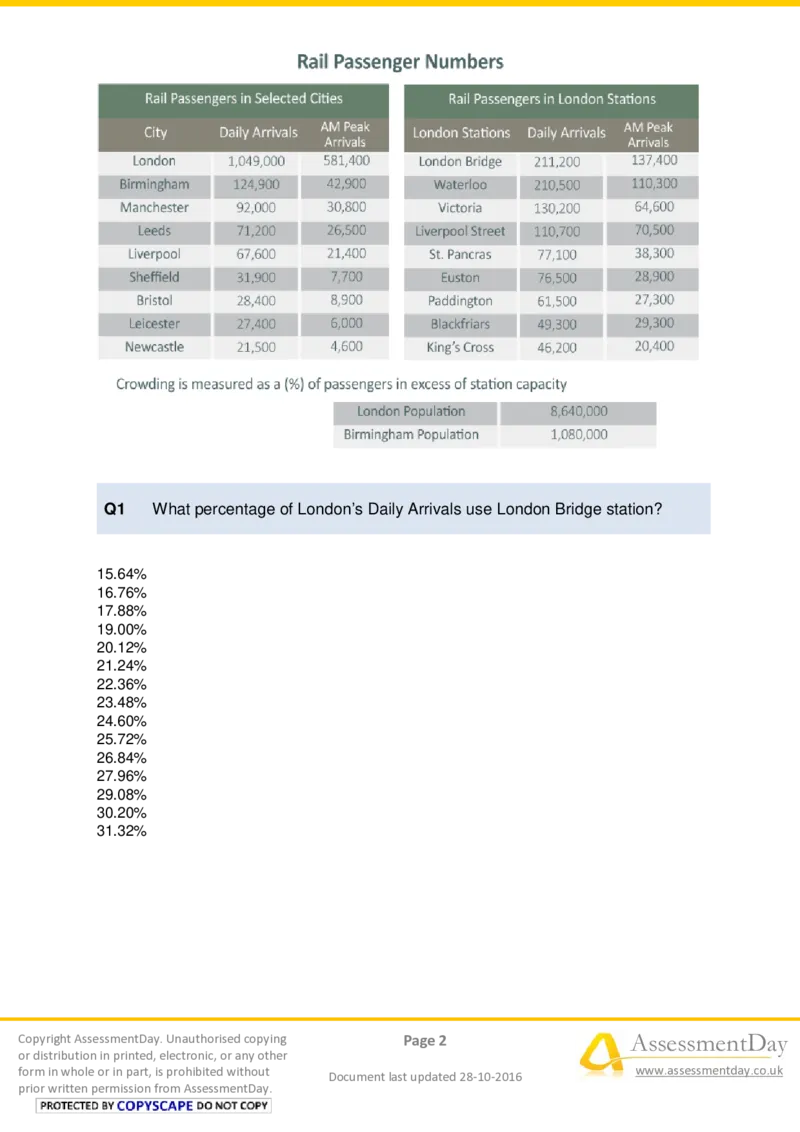
Practice Aptitude TestsQ1 What percentage of London’s Daily Arrivals use London Bridge station?
15.64%
16.76%
17.88%
19.00%
20.12%
21.24%
22.36%
23.48%
24.60%
25.72%
26.84%
27.96%
29.08%
30.20%
31.32%
Copyright AssessmentDay. Unauthorised copying Page 2 AssessmentDay
or distribution in printed, electronic, or any other
form in whole or in part, is prohibited without
Document last updated 28-10-2016
www.assessmentday.co.uk
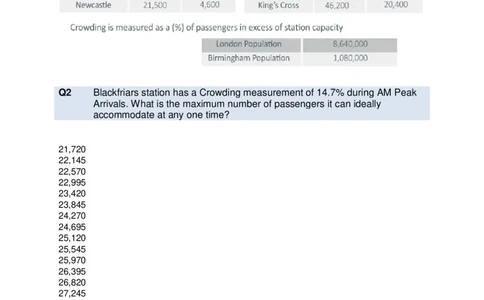
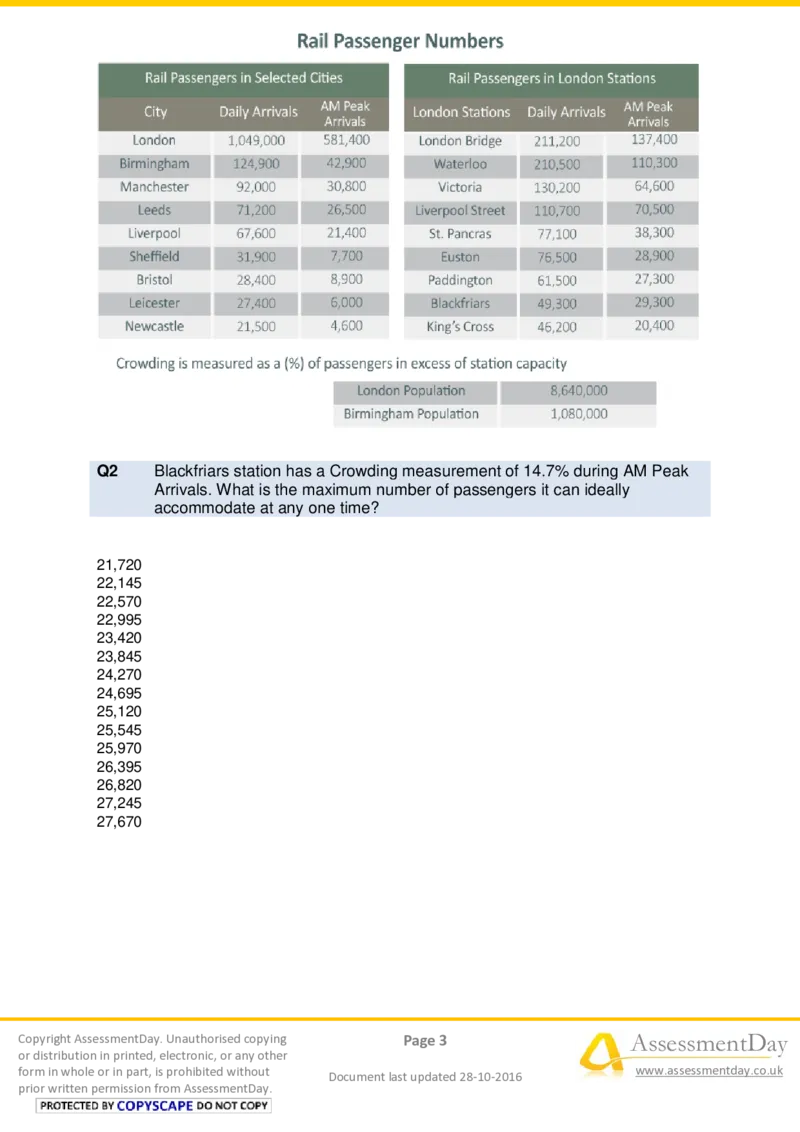
prior written permission from AssessmentDay.Q2 Blackfriars station has a Crowding measurement of 14.7% during AM Peak
Arrivals. What is the maximum number of passengers it can ideally
accommodate at any one time?
21,720
22,145
22,570
22,995
23,420
23,845
24,270
24,695
25,120
25,545
25,970
26,395
26,820
27,245
27,670
Copyright AssessmentDay. Unauthorised copying Page 3 AssessmentDay
or distribution in printed, electronic, or any other
form in whole or in part, is prohibited without
Document last updated 28-10-2016
www.assessmentday.co.uk
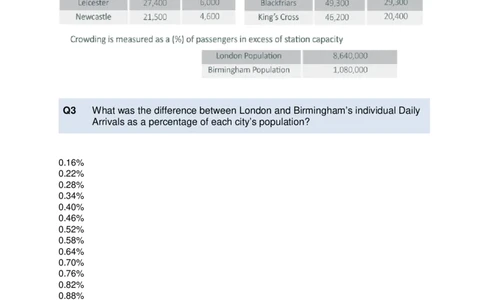
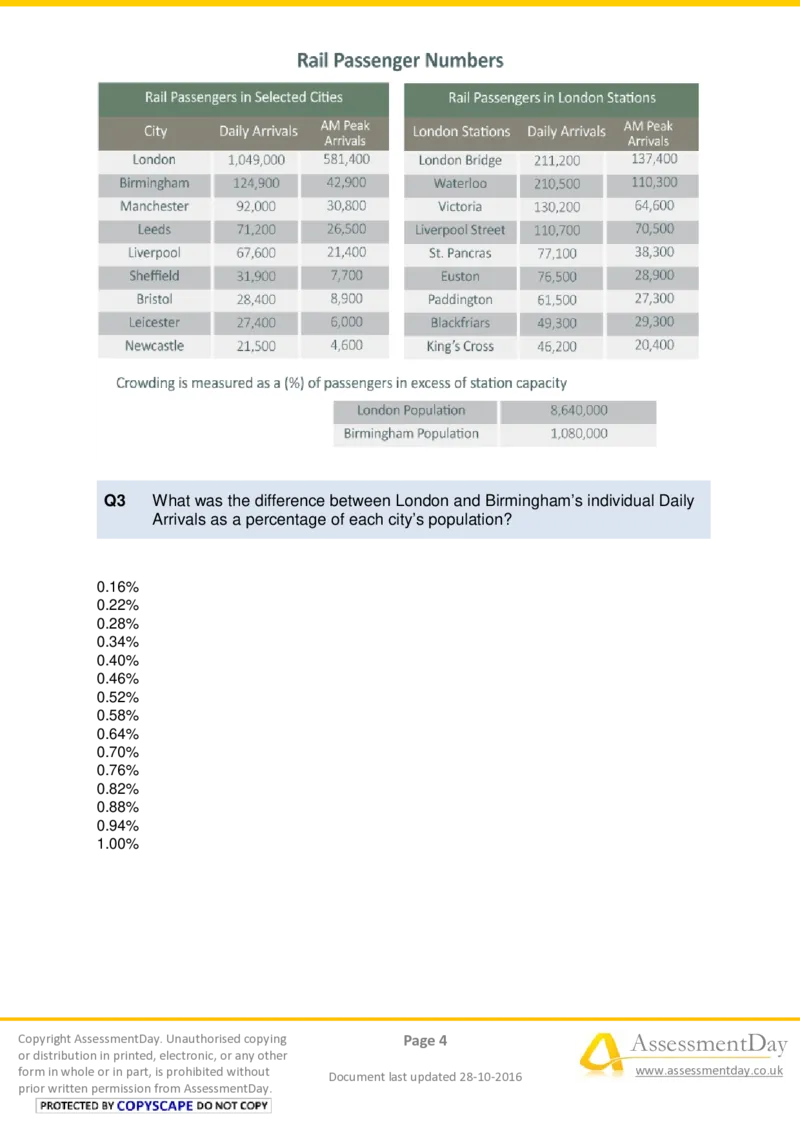
prior written permission from AssessmentDay.Q3 What was the difference between London and Birmingham’s individual Daily
Arrivals as a percentage of each city’s population?
0.16%
0.22%
0.28%
0.34%
0.40%
0.46%
0.52%
0.58%
0.64%
0.70%
0.76%
0.82%
0.88%
0.94%
1.00%
Copyright AssessmentDay. Unauthorised copying Page 4 AssessmentDay
or distribution in printed, electronic, or any other
form in whole or in part, is prohibited without
Document last updated 28-10-2016
www.assessmentday.co.uk
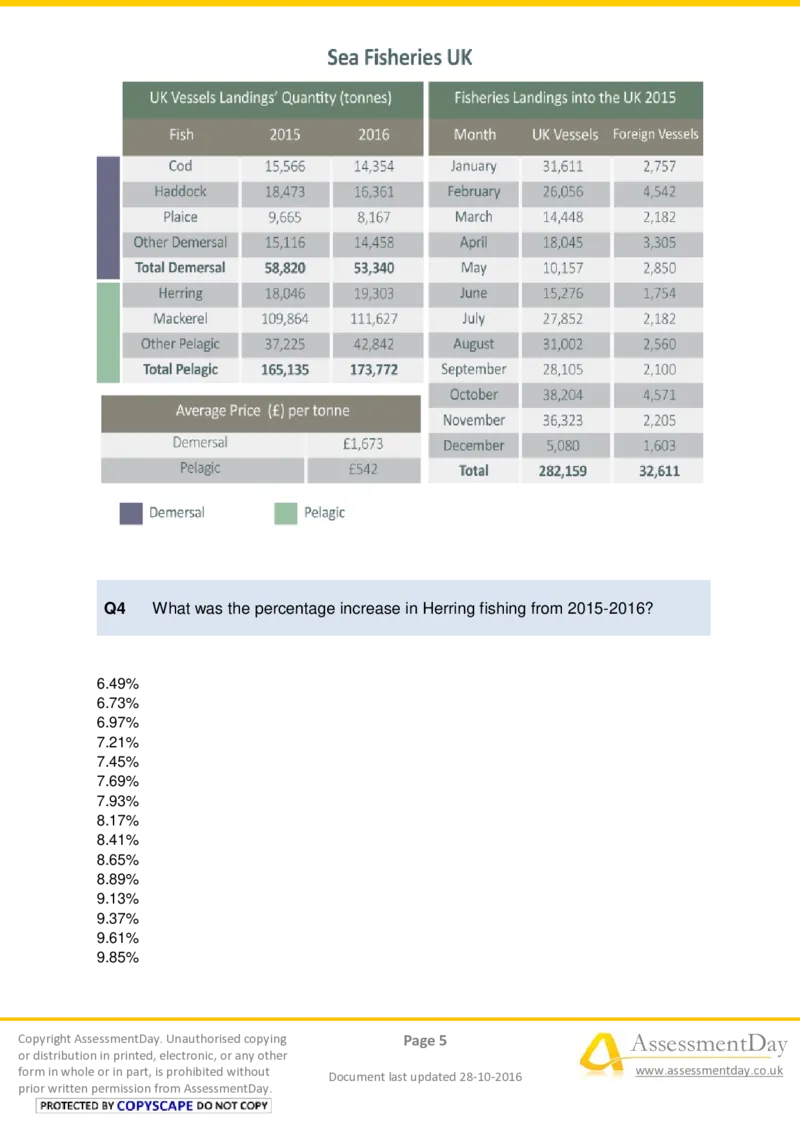
prior written permission from AssessmentDay.Q4 What was the percentage increase in Herring fishing from 2015-2016?
6.49%
6.73%
6.97%
7.21%
7.45%
7.69%
7.93%
8.17%
8.41%
8.65%
8.89%
9.13%
9.37%
9.61%
9.85%
Copyright AssessmentDay. Unauthorised copying Page 5 AssessmentDay
or distribution in printed, electronic, or any other
form in whole or in part, is prohibited without
Document last updated 28-10-2016
www.assessmentday.co.uk
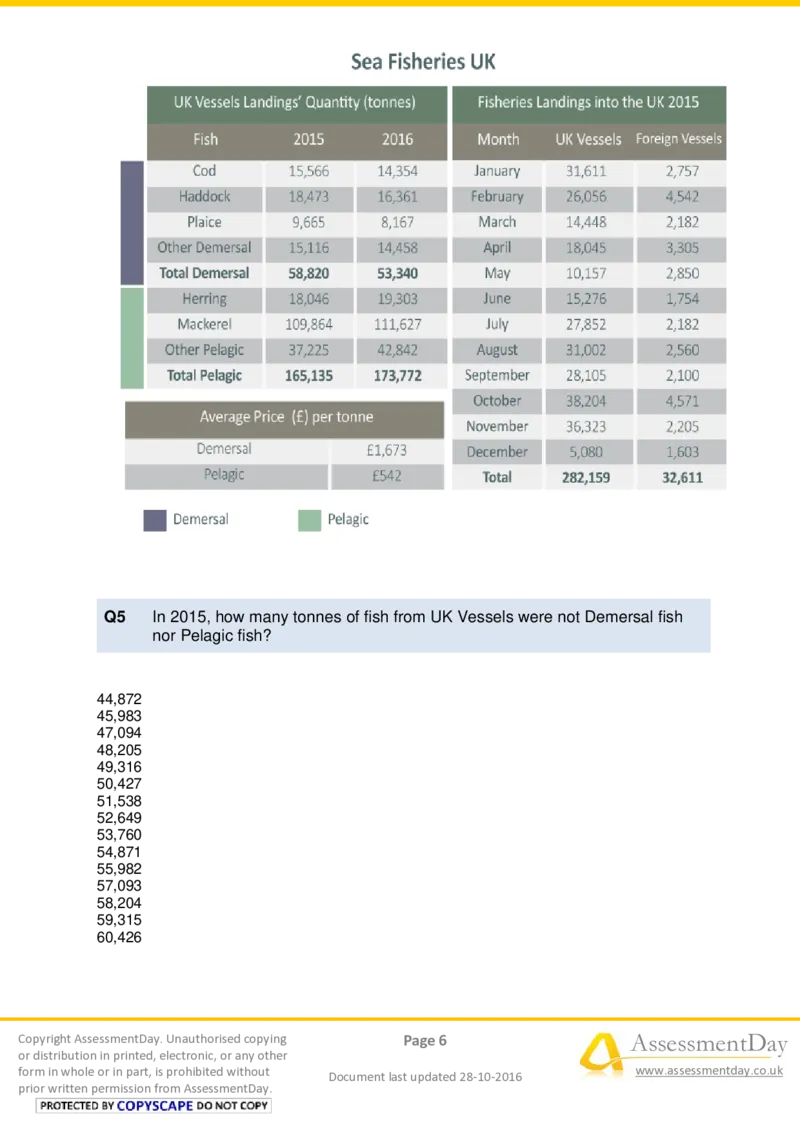
prior written permission from AssessmentDay.Q5 In 2015, how many tonnes of fish from UK Vessels were not Demersal fish
nor Pelagic fish?
44,872
45,983
47,094
48,205
49,316
50,427
51,538
52,649
53,760
54,871
55,982
57,093
58,204
59,315
60,426
Copyright AssessmentDay. Unauthorised copying Page 6 AssessmentDay
or distribution in printed, electronic, or any other
form in whole or in part, is prohibited without
Document last updated 28-10-2016
www.assessmentday.co.uk
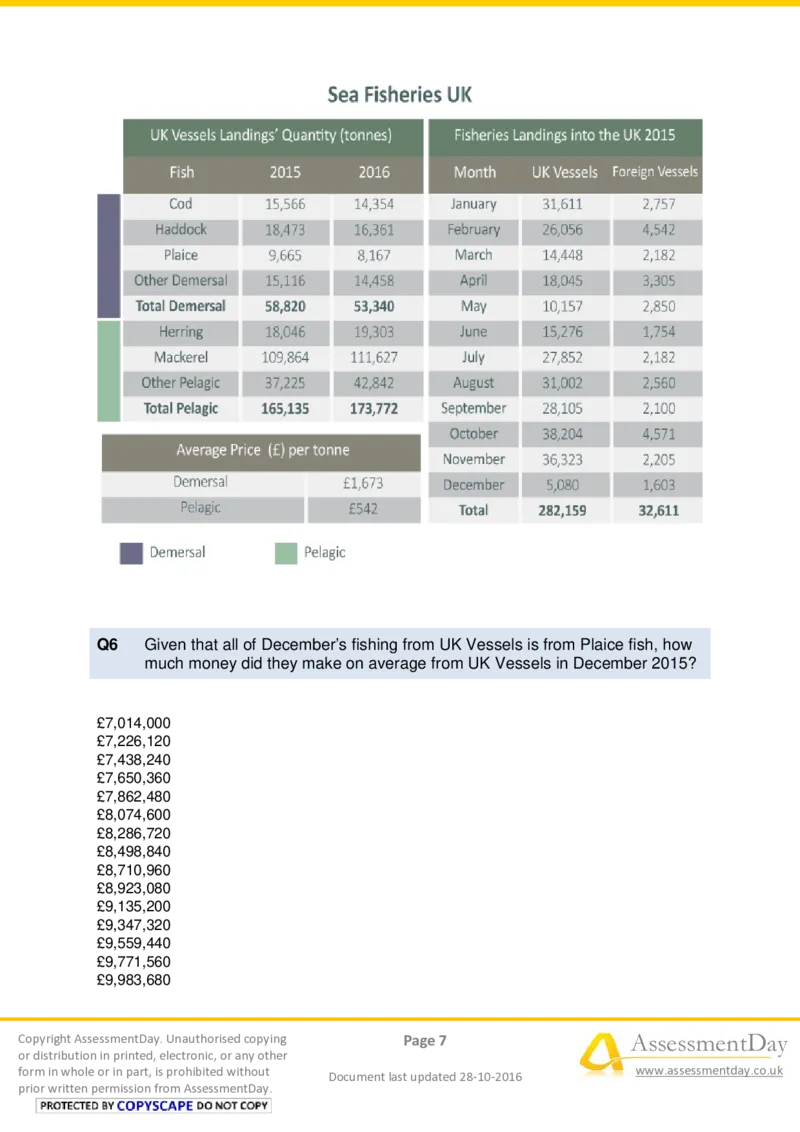
prior written permission from AssessmentDay.Q6 Given that all of December’s fishing from UK Vessels is from Plaice fish, how
much money did they make on average from UK Vessels in December 2015?
£7,014,000
£7,226,120
£7,438,240
£7,650,360
£7,862,480
£8,074,600
£8,286,720
£8,498,840
£8,710,960
£8,923,080
£9,135,200
£9,347,320
£9,559,440
£9,771,560
£9,983,680
Copyright AssessmentDay. Unauthorised copying Page 7 AssessmentDay
or distribution in printed, electronic, or any other
form in whole or in part, is prohibited without
Document last updated 28-10-2016
www.assessmentday.co.uk
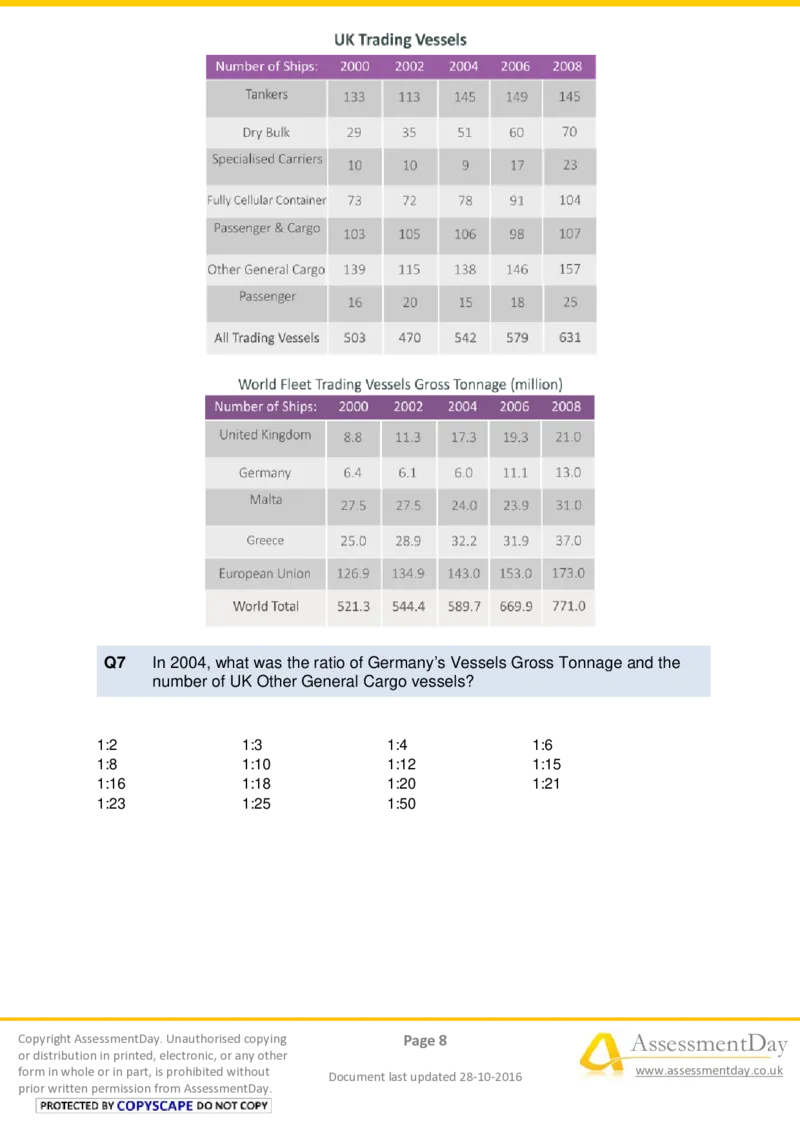
prior written permission from AssessmentDay.Q7 In 2004, what was the ratio of Germany’s Vessels Gross Tonnage and the
number of UK Other General Cargo vessels?
1:2 1:3 1:4 1:6
1:8 1:10 1:12 1:15
1:16 1:18 1:20 1:21
1:23 1:25 1:50
Copyright AssessmentDay. Unauthorised copying Page 8 AssessmentDay
or distribution in printed, electronic, or any other
form in whole or in part, is prohibited without
Document last updated 28-10-2016
www.assessmentday.co.uk
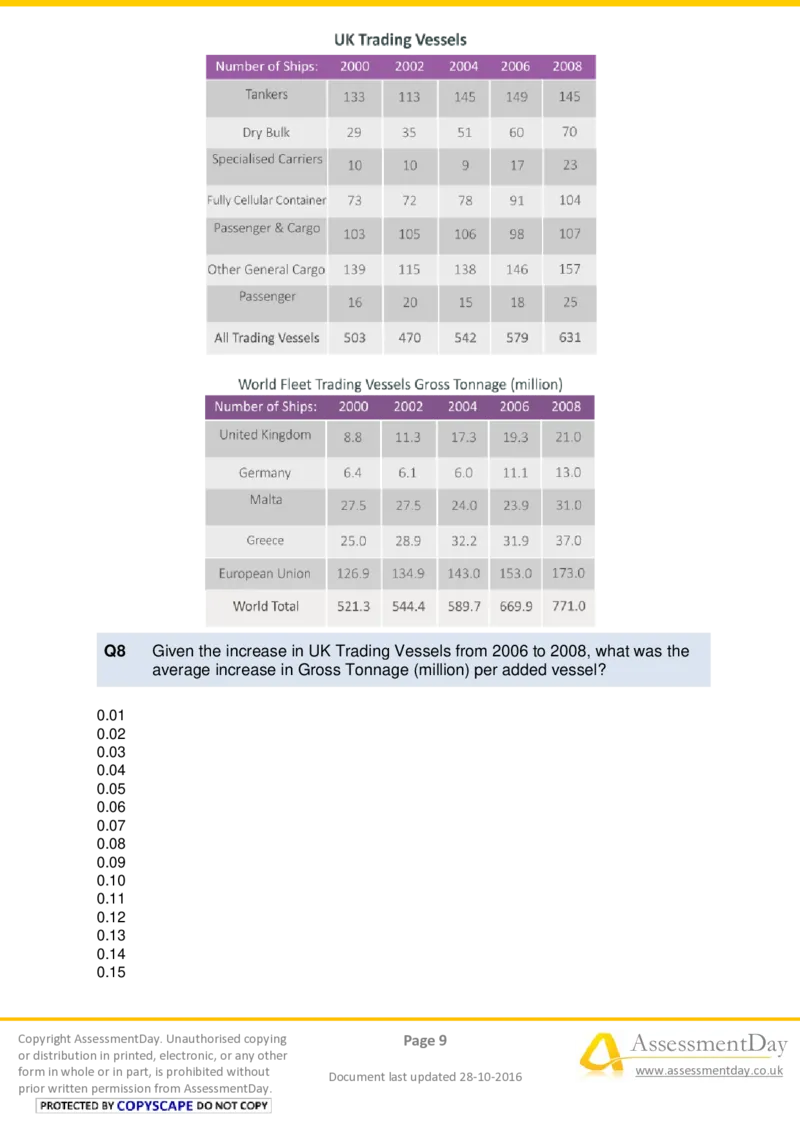
prior written permission from AssessmentDay.Q8 Given the increase in UK Trading Vessels from 2006 to 2008, what was the
average increase in Gross Tonnage (million) per added vessel?
0.01
0.02
0.03
0.04
0.05
0.06
0.07
0.08
0.09
0.10
0.11
0.12
0.13
0.14
0.15
Copyright AssessmentDay. Unauthorised copying Page 9 AssessmentDay
or distribution in printed, electronic, or any other
form in whole or in part, is prohibited without
Document last updated 28-10-2016
www.assessmentday.co.uk
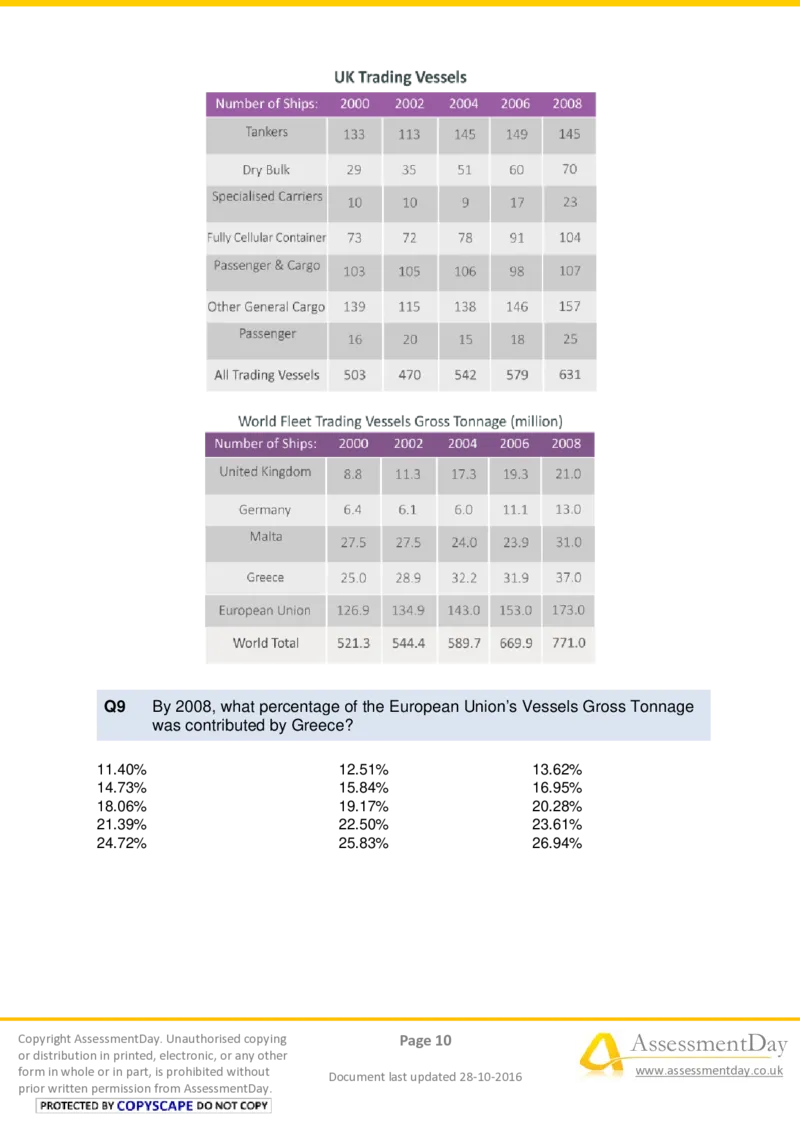
prior written permission from AssessmentDay.Q9 By 2008, what percentage of the European Union’s Vessels Gross Tonnage
was contributed by Greece?
11.40% 12.51% 13.62%
14.73% 15.84% 16.95%
18.06% 19.17% 20.28%
21.39% 22.50% 23.61%
24.72% 25.83% 26.94%
Copyright AssessmentDay. Unauthorised copying Page 10 AssessmentDay
or distribution in printed, electronic, or any other
form in whole or in part, is prohibited without
Document last updated 28-10-2016
www.assessmentday.co.uk
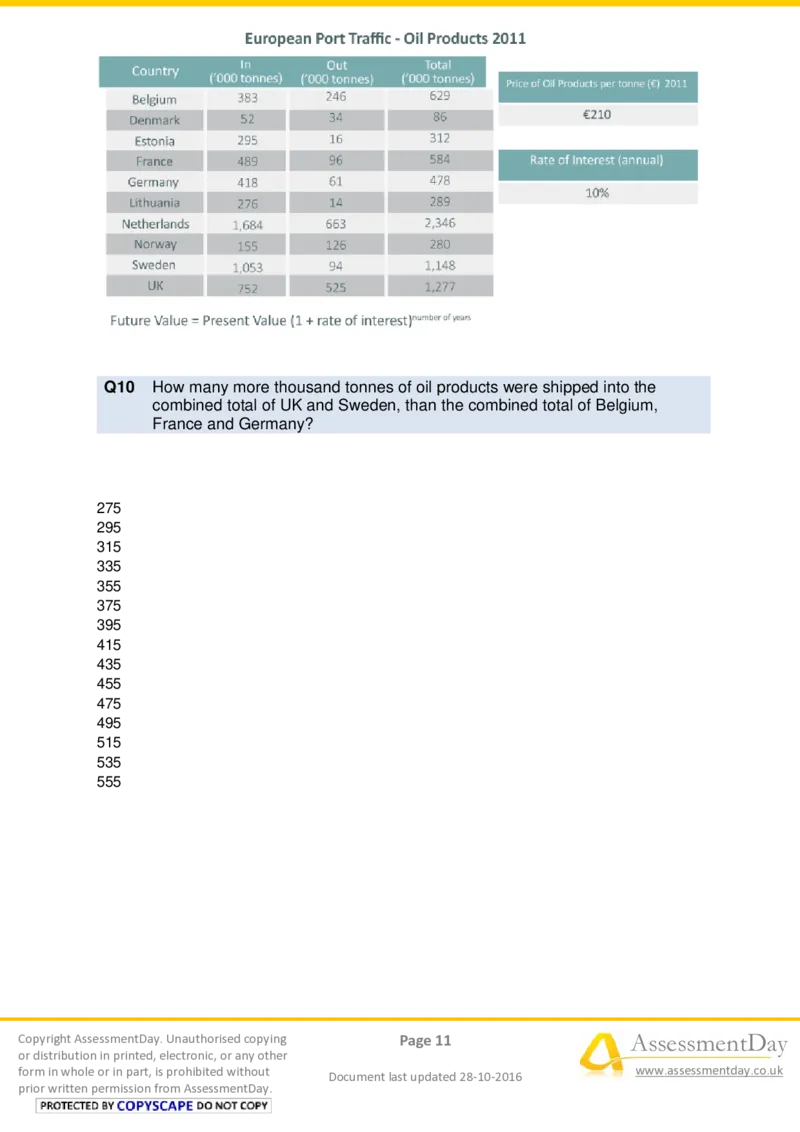
prior written permission from AssessmentDay.Q10 How many more thousand tonnes of oil products were shipped into the
combined total of UK and Sweden, than the combined total of Belgium,
France and Germany?
275
295
315
335
355
375
395
415
435
455
475
495
515
535
555
Copyright AssessmentDay. Unauthorised copying Page 11 AssessmentDay
or distribution in printed, electronic, or any other
form in whole or in part, is prohibited without
Document last updated 28-10-2016
www.assessmentday.co.uk
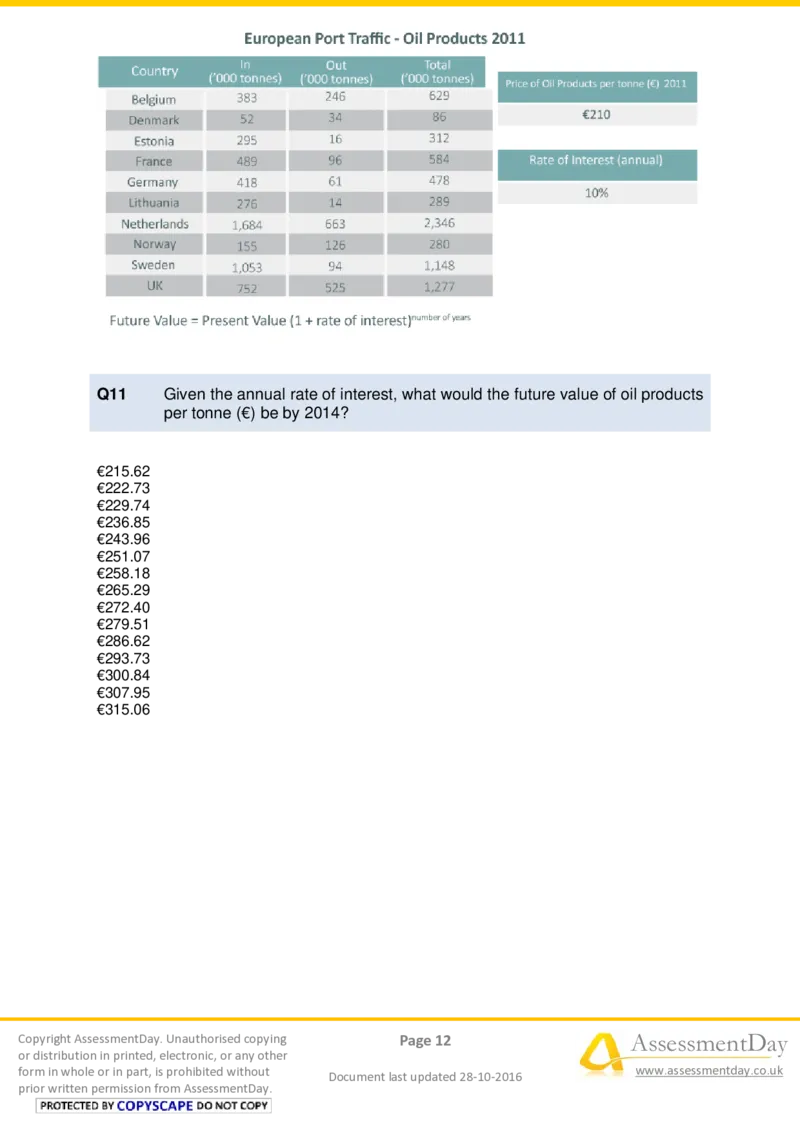
prior written permission from AssessmentDay.Q11 Given the annual rate of interest, what would the future value of oil products
per tonne (€) be by 2014?
€215.62
€222.73
€229.74
€236.85
€243.96
€251.07
€258.18
€265.29
€272.40
€279.51
€286.62
€293.73
€300.84
€307.95
€315.06
Copyright AssessmentDay. Unauthorised copying Page 12 AssessmentDay
or distribution in printed, electronic, or any other
form in whole or in part, is prohibited without
Document last updated 28-10-2016
www.assessmentday.co.uk
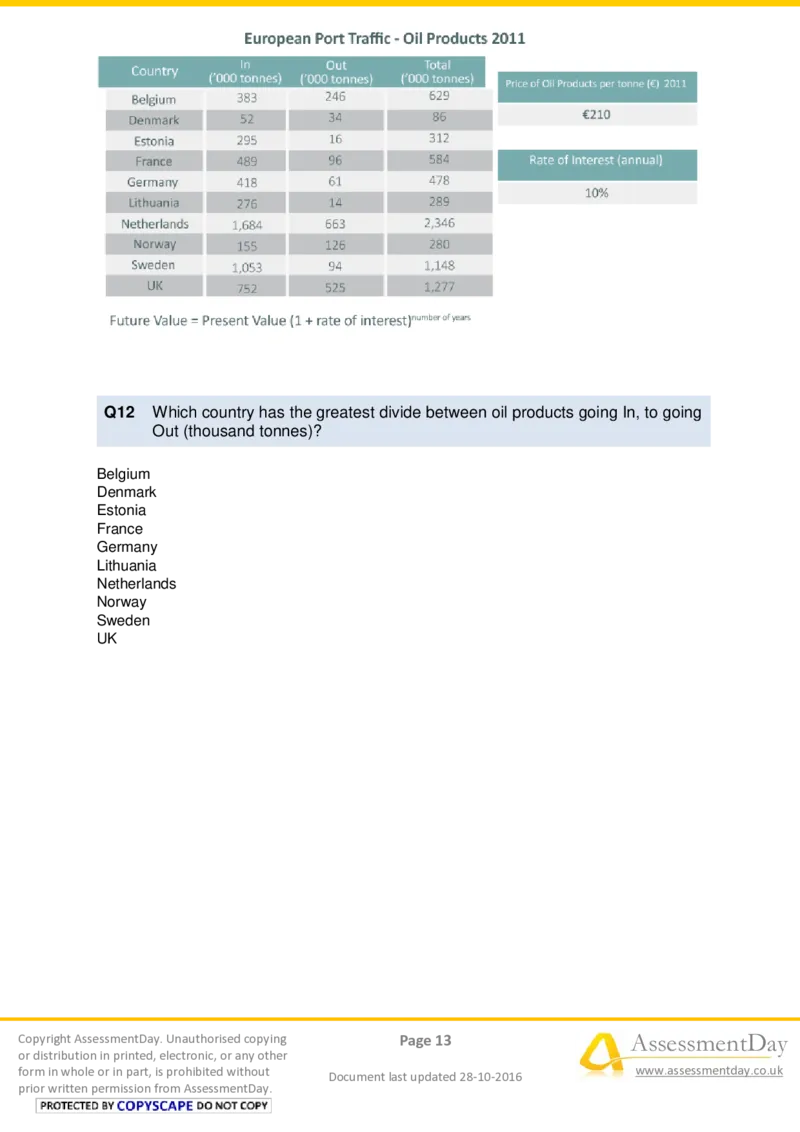
prior written permission from AssessmentDay.Q12 Which country has the greatest divide between oil products going In, to going
Out (thousand tonnes)?
Belgium
Denmark
Estonia
France
Germany
Lithuania
Netherlands
Norway
Sweden
UK
Copyright AssessmentDay. Unauthorised copying Page 13 AssessmentDay
or distribution in printed, electronic, or any other
form in whole or in part, is prohibited without
Document last updated 28-10-2016
www.assessmentday.co.uk
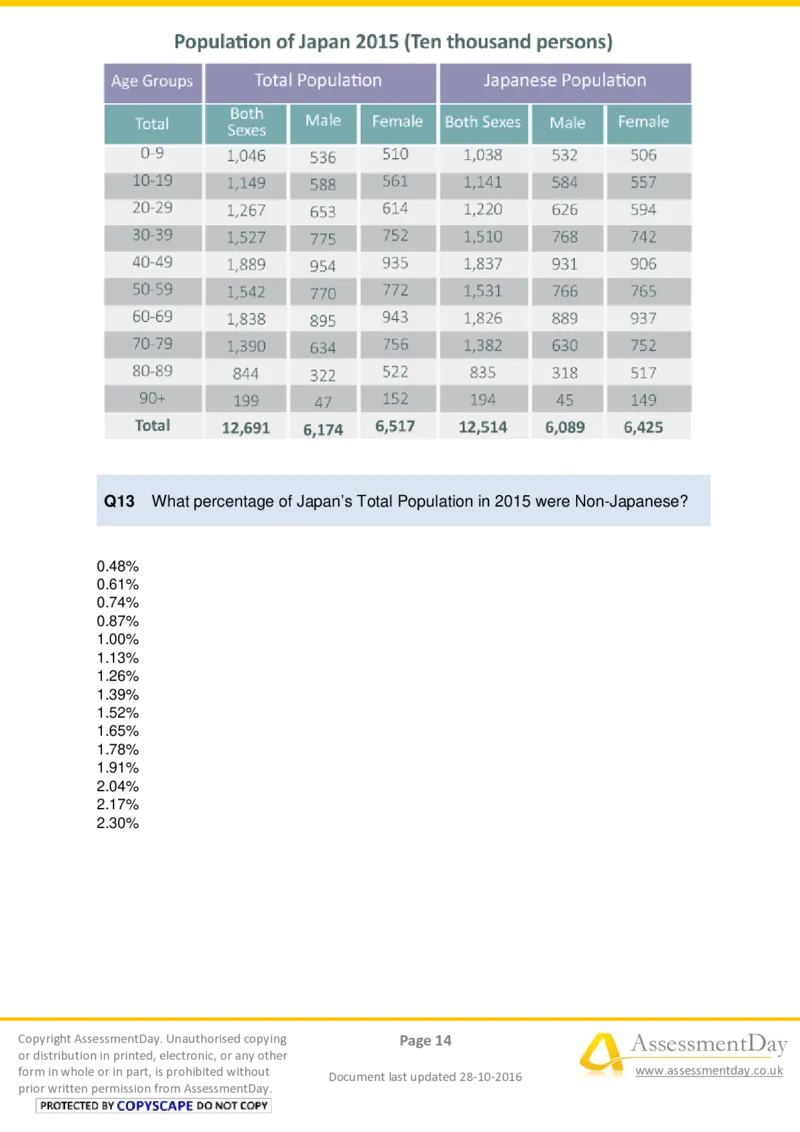
prior written permission from AssessmentDay.Q13 What percentage of Japan’s Total Population in 2015 were Non-Japanese?
0.48%
0.61%
0.74%
0.87%
1.00%
1.13%
1.26%
1.39%
1.52%
1.65%
1.78%
1.91%
2.04%
2.17%
2.30%
Copyright AssessmentDay. Unauthorised copying Page 14 AssessmentDay
or distribution in printed, electronic, or any other
form in whole or in part, is prohibited without
Document last updated 28-10-2016
www.assessmentday.co.uk
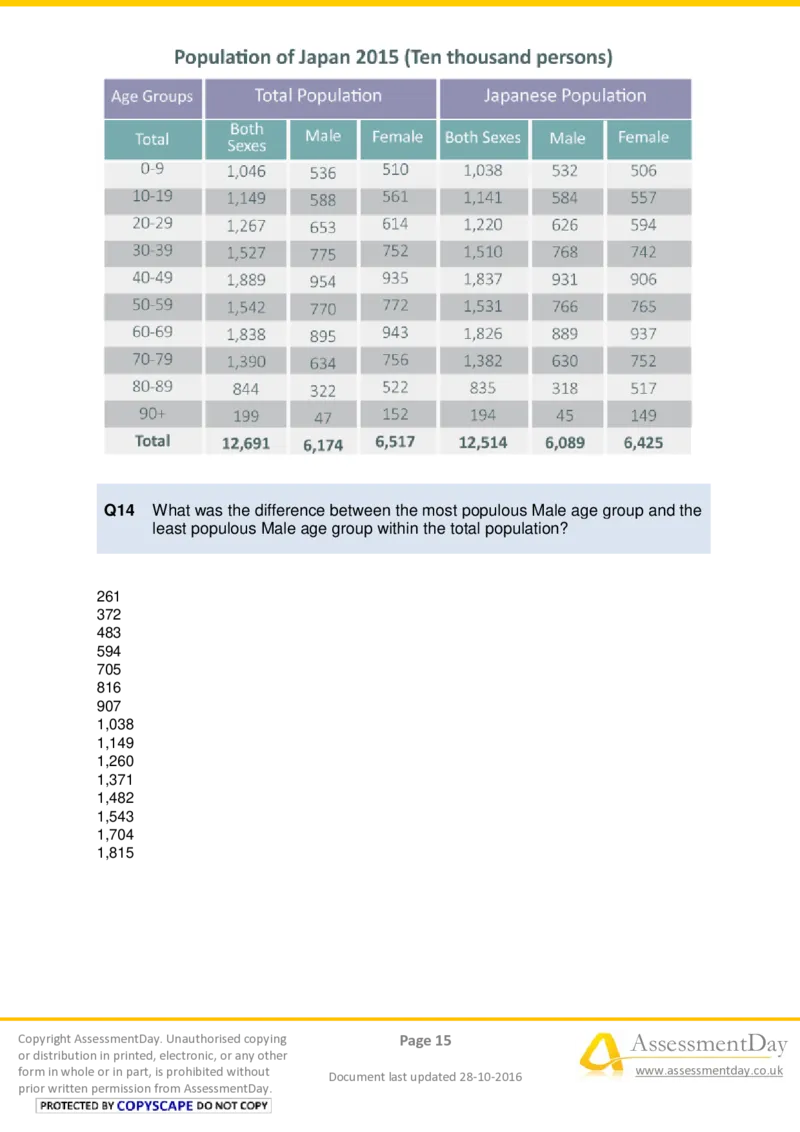
prior written permission from AssessmentDay.Q14 What was the difference between the most populous Male age group and the
least populous Male age group within the total population?
261
372
483
594
705
816
907
1,038
1,149
1,260
1,371
1,482
1,543
1,704
1,815
Copyright AssessmentDay. Unauthorised copying Page 15 AssessmentDay
or distribution in printed, electronic, or any other
form in whole or in part, is prohibited without
Document last updated 28-10-2016
www.assessmentday.co.uk
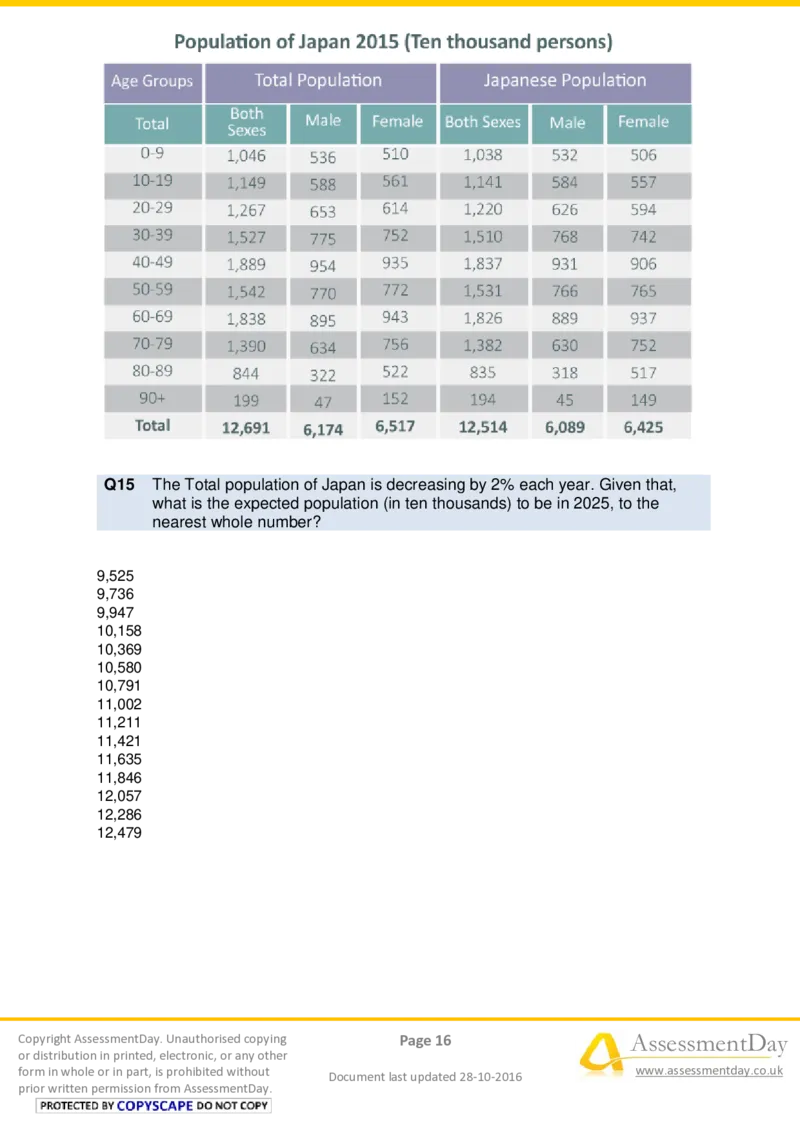
prior written permission from AssessmentDay.Q15 The Total population of Japan is decreasing by 2% each year. Given that,
what is the expected population (in ten thousands) to be in 2025, to the
nearest whole number?
9,525
9,736
9,947
10,158
10,369
10,580
10,791
11,002
11,211
11,421
11,635
11,846
12,057
12,286
12,479
Copyright AssessmentDay. Unauthorised copying Page 16 AssessmentDay
or distribution in printed, electronic, or any other
form in whole or in part, is prohibited without
Document last updated 28-10-2016
www.assessmentday.co.uk
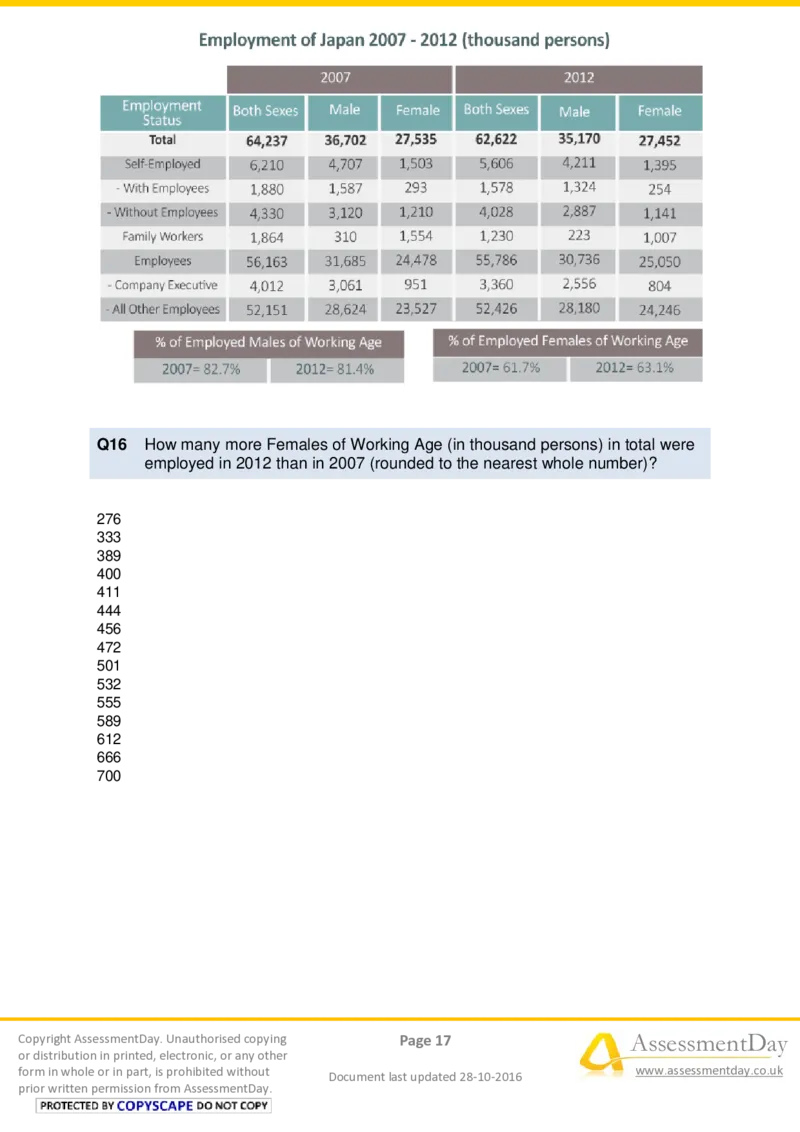
prior written permission from AssessmentDay.Q16 How many more Females of Working Age (in thousand persons) in total were
employed in 2012 than in 2007 (rounded to the nearest whole number)?
276
333
389
400
411
444
456
472
501
532
555
589
612
666
700
Copyright AssessmentDay. Unauthorised copying Page 17 AssessmentDay
or distribution in printed, electronic, or any other
form in whole or in part, is prohibited without
Document last updated 28-10-2016
www.assessmentday.co.uk
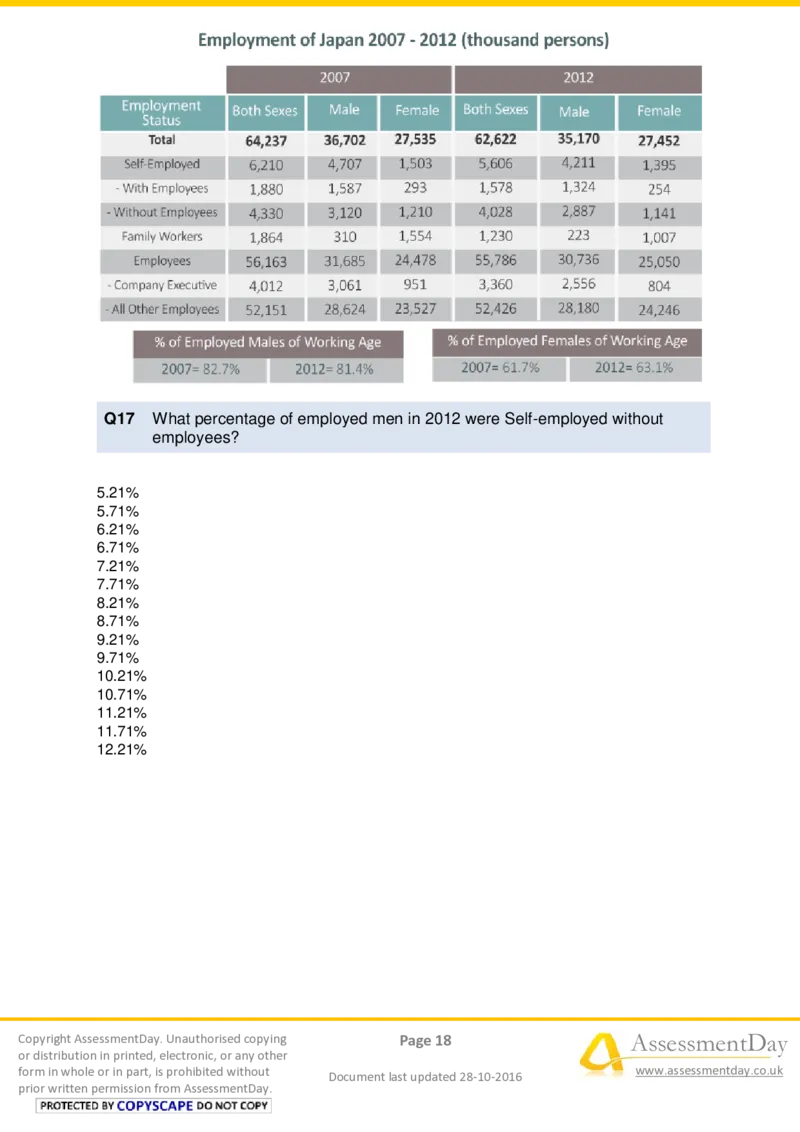
prior written permission from AssessmentDay.Q17 What percentage of employed men in 2012 were Self-employed without
employees?
5.21%
5.71%
6.21%
6.71%
7.21%
7.71%
8.21%
8.71%
9.21%
9.71%
10.21%
10.71%
11.21%
11.71%
12.21%
Copyright AssessmentDay. Unauthorised copying Page 18 AssessmentDay
or distribution in printed, electronic, or any other
form in whole or in part, is prohibited without
Document last updated 28-10-2016
www.assessmentday.co.uk
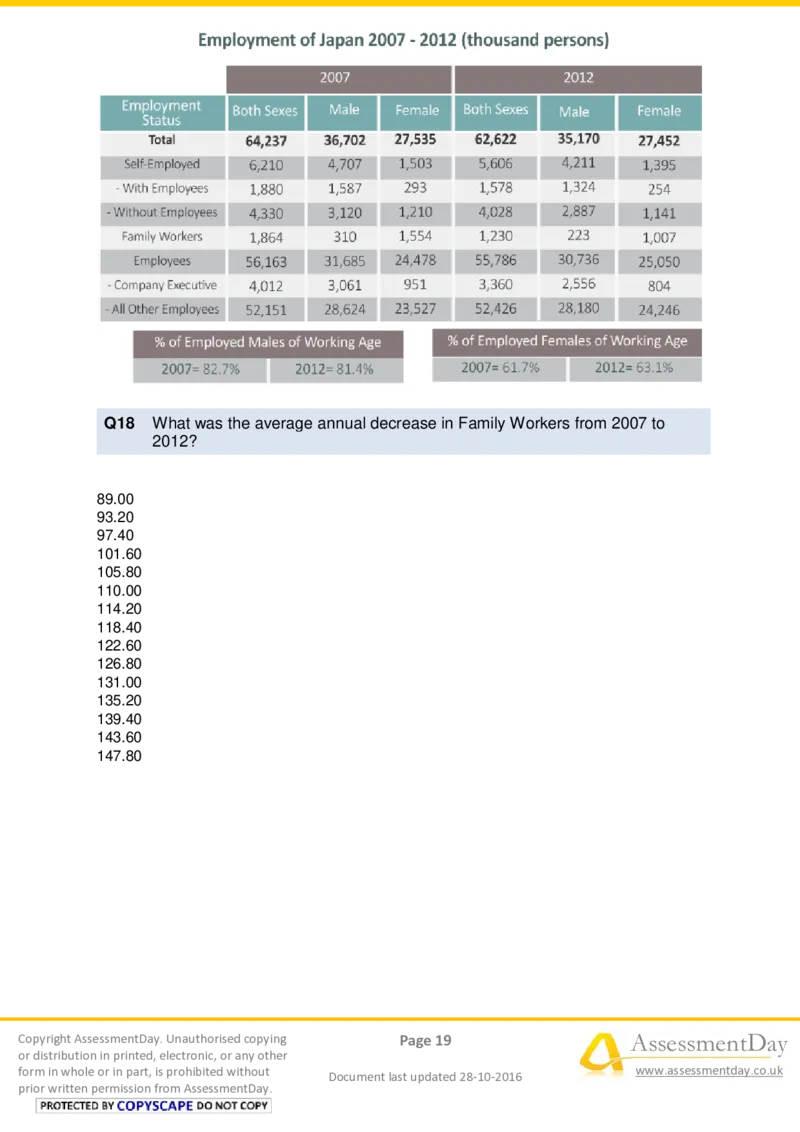
prior written permission from AssessmentDay.Q18 What was the average annual decrease in Family Workers from 2007 to
2012?
89.00
93.20
97.40
101.60
105.80
110.00
114.20
118.40
122.60
126.80
131.00
135.20
139.40
143.60
147.80
Copyright AssessmentDay. Unauthorised copying Page 19 AssessmentDay
or distribution in printed, electronic, or any other
form in whole or in part, is prohibited without
Document last updated 28-10-2016
www.assessmentday.co.uk
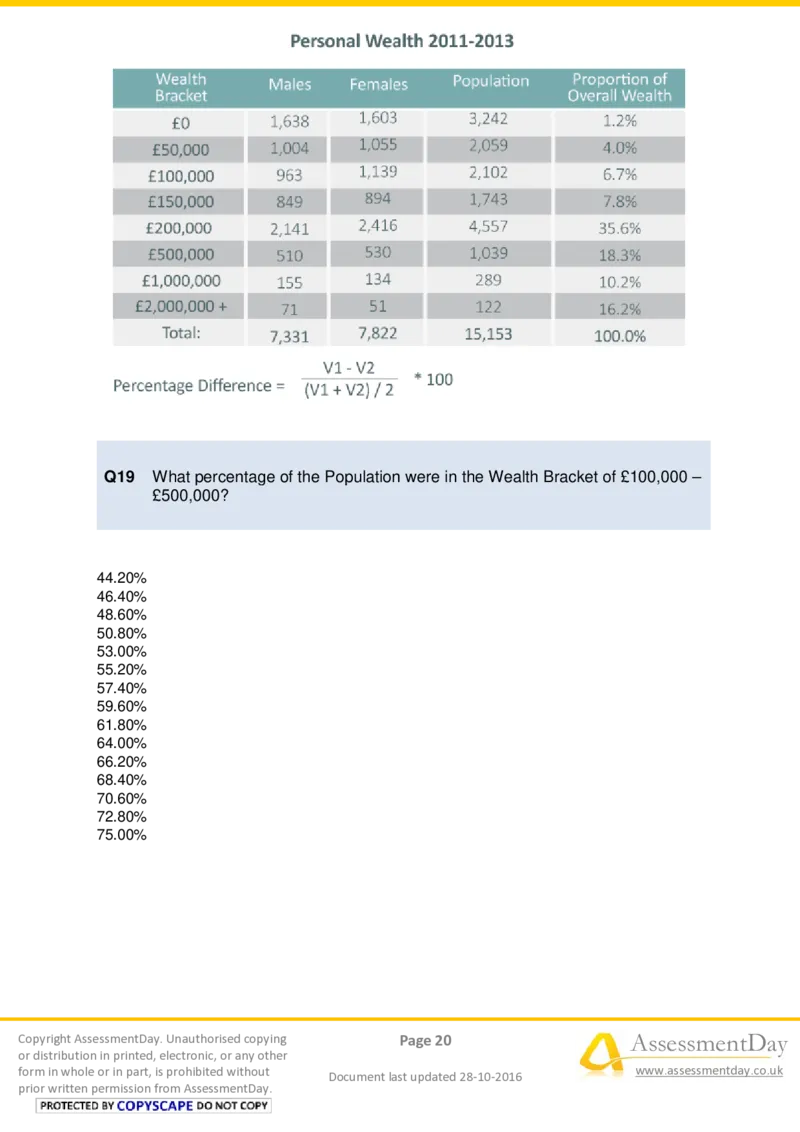
prior written permission from AssessmentDay.Q19 What percentage of the Population were in the Wealth Bracket of £100,000 –
£500,000?
44.20%
46.40%
48.60%
50.80%
53.00%
55.20%
57.40%
59.60%
61.80%
64.00%
66.20%
68.40%
70.60%
72.80%
75.00%
Copyright AssessmentDay. Unauthorised copying Page 20 AssessmentDay
or distribution in printed, electronic, or any other
form in whole or in part, is prohibited without
Document last updated 28-10-2016
www.assessmentday.co.uk
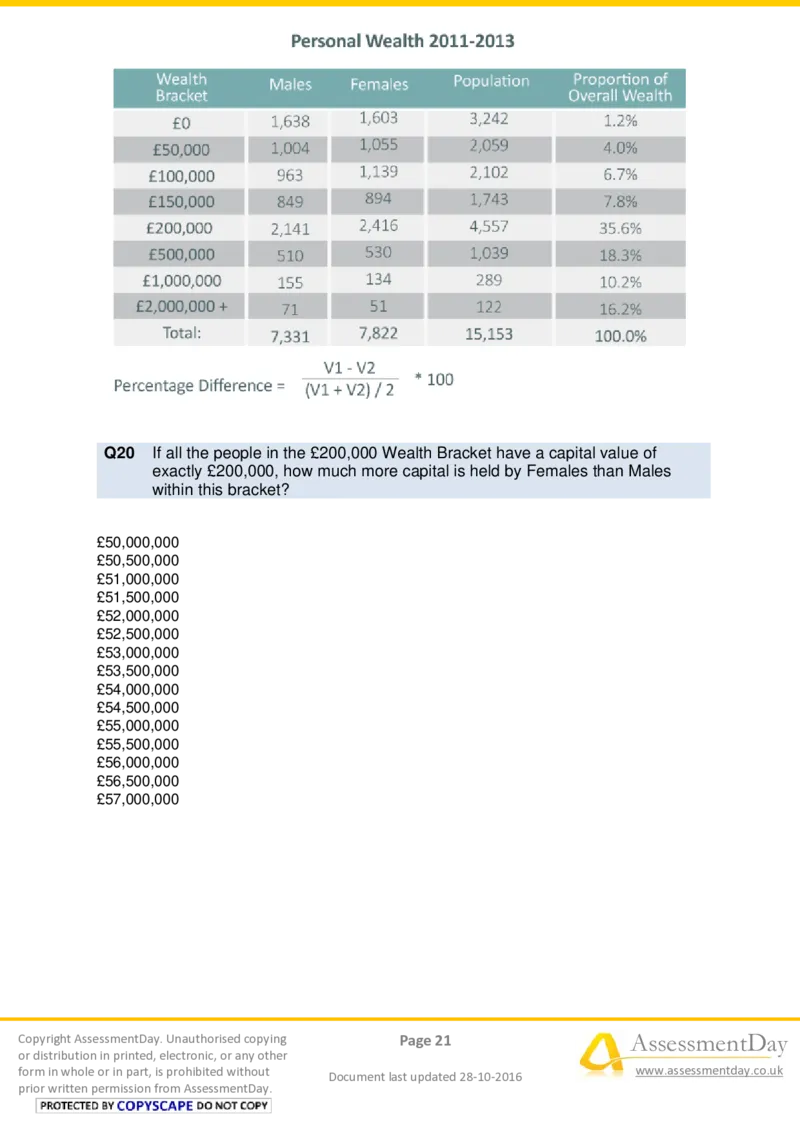
prior written permission from AssessmentDay.Q20 If all the people in the £200,000 Wealth Bracket have a capital value of
exactly £200,000, how much more capital is held by Females than Males
within this bracket?
£50,000,000
£50,500,000
£51,000,000
£51,500,000
£52,000,000
£52,500,000
£53,000,000
£53,500,000
£54,000,000
£54,500,000
£55,000,000
£55,500,000
£56,000,000
£56,500,000
£57,000,000
Copyright AssessmentDay. Unauthorised copying Page 21 AssessmentDay
or distribution in printed, electronic, or any other
form in whole or in part, is prohibited without
Document last updated 28-10-2016
www.assessmentday.co.uk
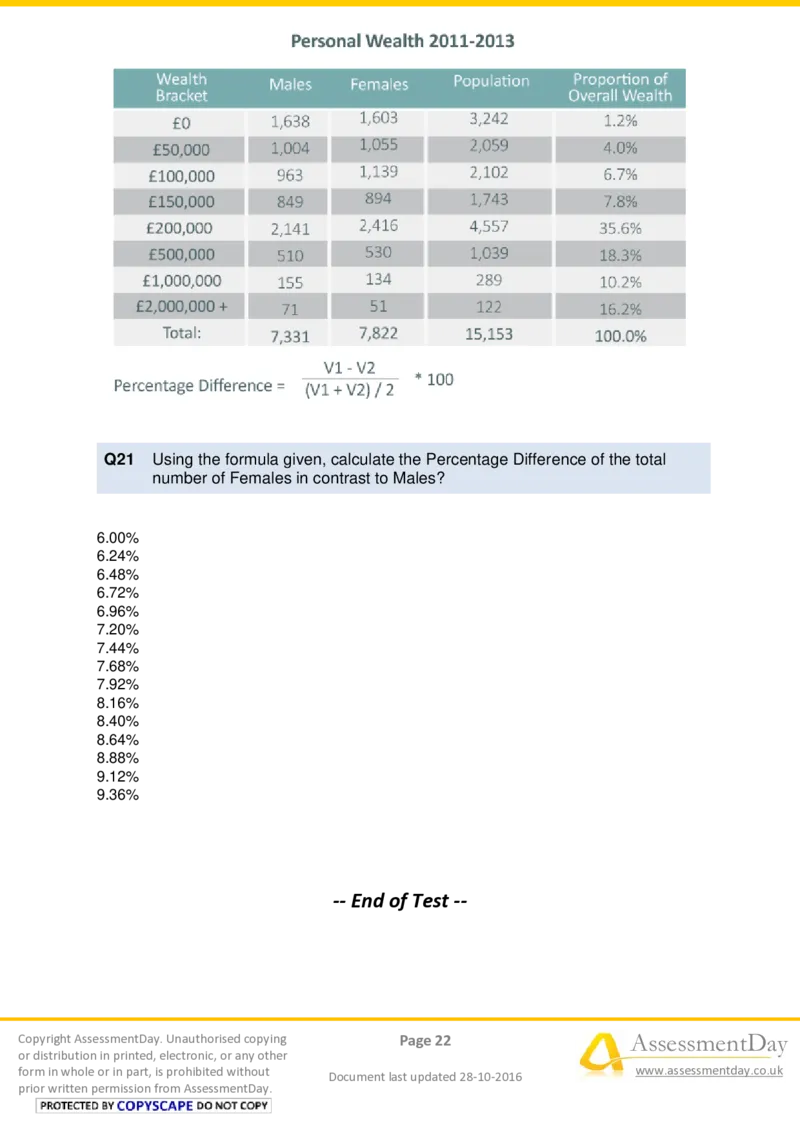
prior written permission from AssessmentDay.Q21 Using the formula given, calculate the Percentage Difference of the total
number of Females in contrast to Males?
6.00%
6.24%
6.48%
6.72%
6.96%
7.20%
7.44%
7.68%
7.92%
8.16%
8.40%
8.64%
8.88%
9.12%
9.36%
-- End of Test --
Copyright AssessmentDay. Unauthorised copying Page 22 AssessmentDay
or distribution in printed, electronic, or any other
form in whole or in part, is prohibited without
Document last updated 28-10-2016
www.assessmentday.co.uk
prior written permission from AssessmentDay.

