
文档内容
Numerical Test 4
Questions Booklet
Instructions
This numerical reasoning test comprises 30 questions, and you will have 30 minutes in
which to correctly answer as many as you can. Calculators are permitted for this test, and it is
recommended you have some rough paper to work on.
You will have to work quickly and accurately to perform well in this test. If you don't know the
answer to a question, leave it and come back to it if you have time. Each question will have
five possible answers, one of which is correct. You may click Back and Next during the test to
review or skip questions.
You can submit your test at any time. If the time limit is up before you click submit the test will
automatically be submitted with the answers you have selected. It is recommended to keep
working until the time limit is up.
Try to find a time and place where you will not be interrupted during the test. The test will
begin on the next page.
AssessmentDay
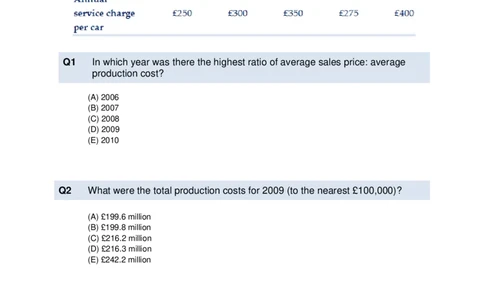
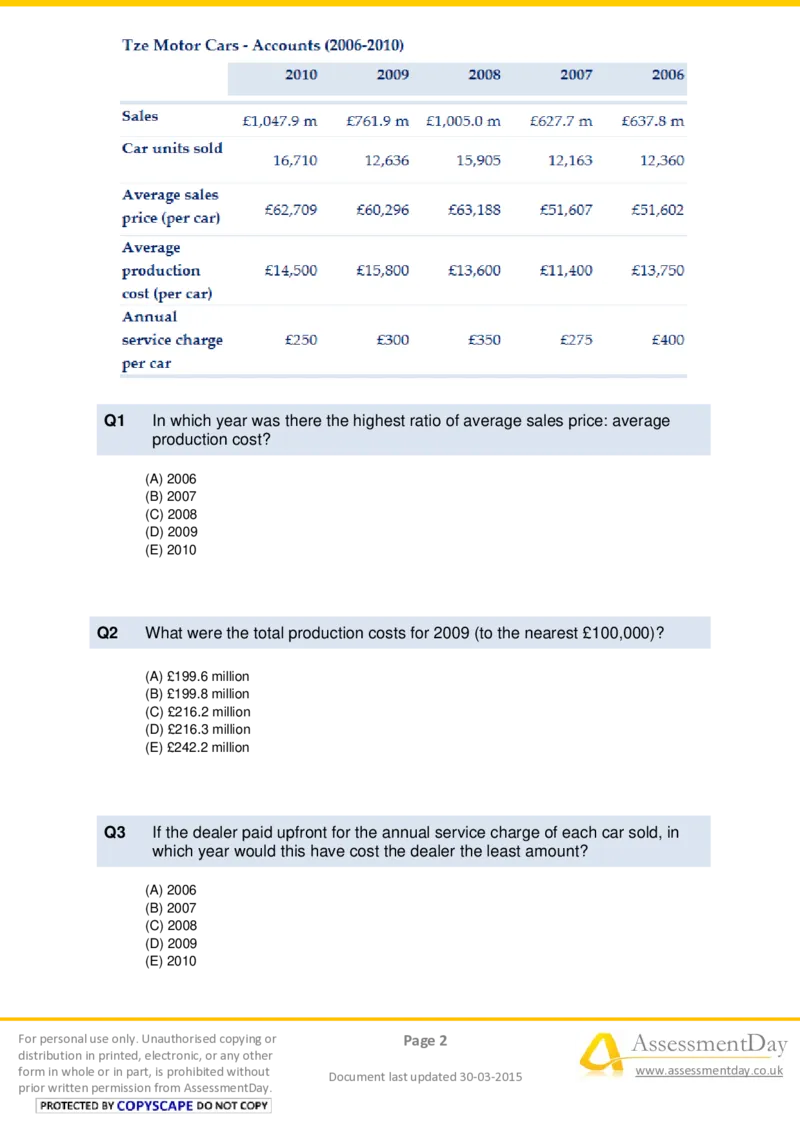
Practice Aptitude TestsQ1 In which year was there the highest ratio of average sales price: average
production cost?
(A) 2006
(B) 2007
(C) 2008
(D) 2009
(E) 2010
Q2 What were the total production costs for 2009 (to the nearest £100,000)?
(A) £199.6 million
(B) £199.8 million
(C) £216.2 million
(D) £216.3 million
(E) £242.2 million
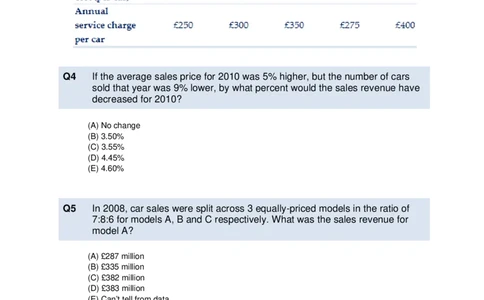
Q3 If the dealer paid upfront for the annual service charge of each car sold, in
which year would this have cost the dealer the least amount?
(A) 2006
(B) 2007
(C) 2008
(D) 2009
(E) 2010
For personal use only. Unauthorised copying or Page 2 AssessmentDay
distribution in printed, electronic, or any other
form in whole or in part, is prohibited without www.assessmentday.co.uk
Document last updated 30-03-2015
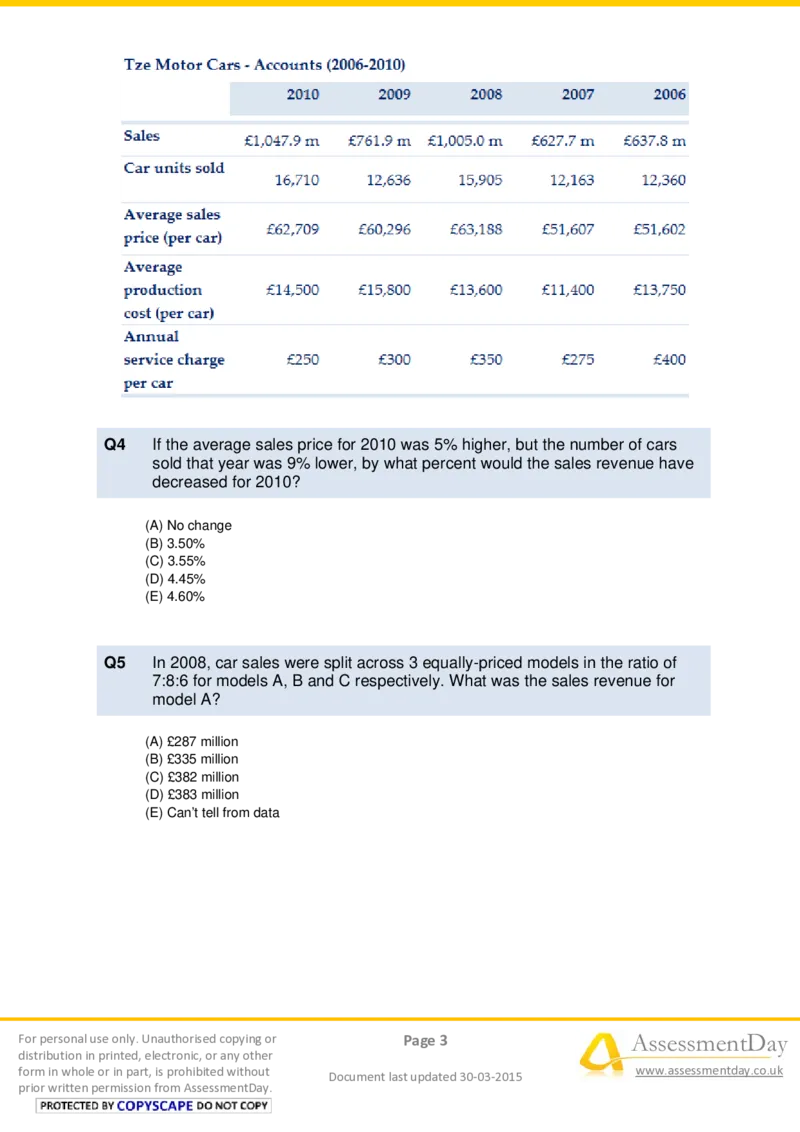
prior written permission from AssessmentDay.Q4 If the average sales price for 2010 was 5% higher, but the number of cars
sold that year was 9% lower, by what percent would the sales revenue have
decreased for 2010?
(A) No change
(B) 3.50%
(C) 3.55%
(D) 4.45%
(E) 4.60%
Q5 In 2008, car sales were split across 3 equally-priced models in the ratio of
7:8:6 for models A, B and C respectively. What was the sales revenue for
model A?
(A) £287 million
(B) £335 million
(C) £382 million
(D) £383 million
(E) Can’t tell from data
For personal use only. Unauthorised copying or Page 3 AssessmentDay
distribution in printed, electronic, or any other
form in whole or in part, is prohibited without www.assessmentday.co.uk
Document last updated 30-03-2015
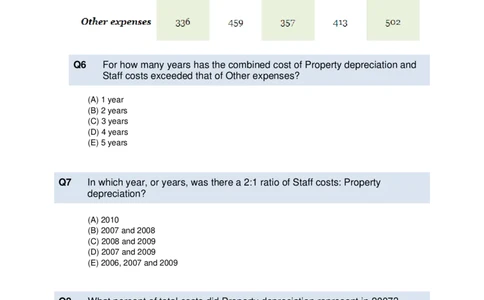
prior written permission from AssessmentDay.Q6 For how many years has the combined cost of Property depreciation and
Staff costs exceeded that of Other expenses?
(A) 1 year
(B) 2 years
(C) 3 years
(D) 4 years
(E) 5 years
Q7 In which year, or years, was there a 2:1 ratio of Staff costs: Property
depreciation?
(A) 2010
(B) 2007 and 2008
(C) 2008 and 2009
(D) 2007 and 2009
(E) 2006, 2007 and 2009
Q8 What percent of total costs did Property depreciation represent in 2007?
(A) 4.7%
(B) 3.7%
(C) 2.7%
(D) 1.9%
(E) 0.9%
For personal use only. Unauthorised copying or Page 4 AssessmentDay
distribution in printed, electronic, or any other
form in whole or in part, is prohibited without www.assessmentday.co.uk
Document last updated 30-03-2015
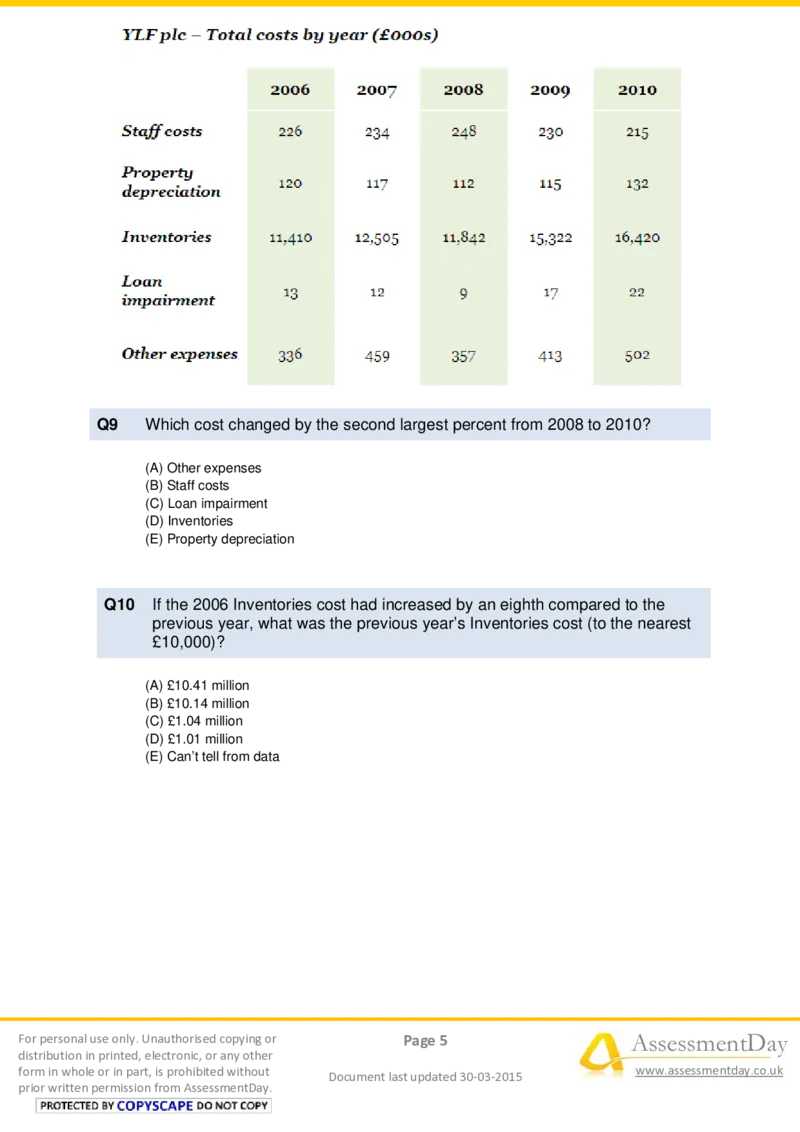
prior written permission from AssessmentDay.Q9 Which cost changed by the second largest percent from 2008 to 2010?
(A) Other expenses
(B) Staff costs
(C) Loan impairment
(D) Inventories
(E) Property depreciation
Q10 If the 2006 Inventories cost had increased by an eighth compared to the
previous year, what was the previous year’s Inventories cost (to the nearest
£10,000)?
(A) £10.41 million
(B) £10.14 million
(C) £1.04 million
(D) £1.01 million
(E) Can’t tell from data
For personal use only. Unauthorised copying or Page 5 AssessmentDay
distribution in printed, electronic, or any other
form in whole or in part, is prohibited without www.assessmentday.co.uk
Document last updated 30-03-2015
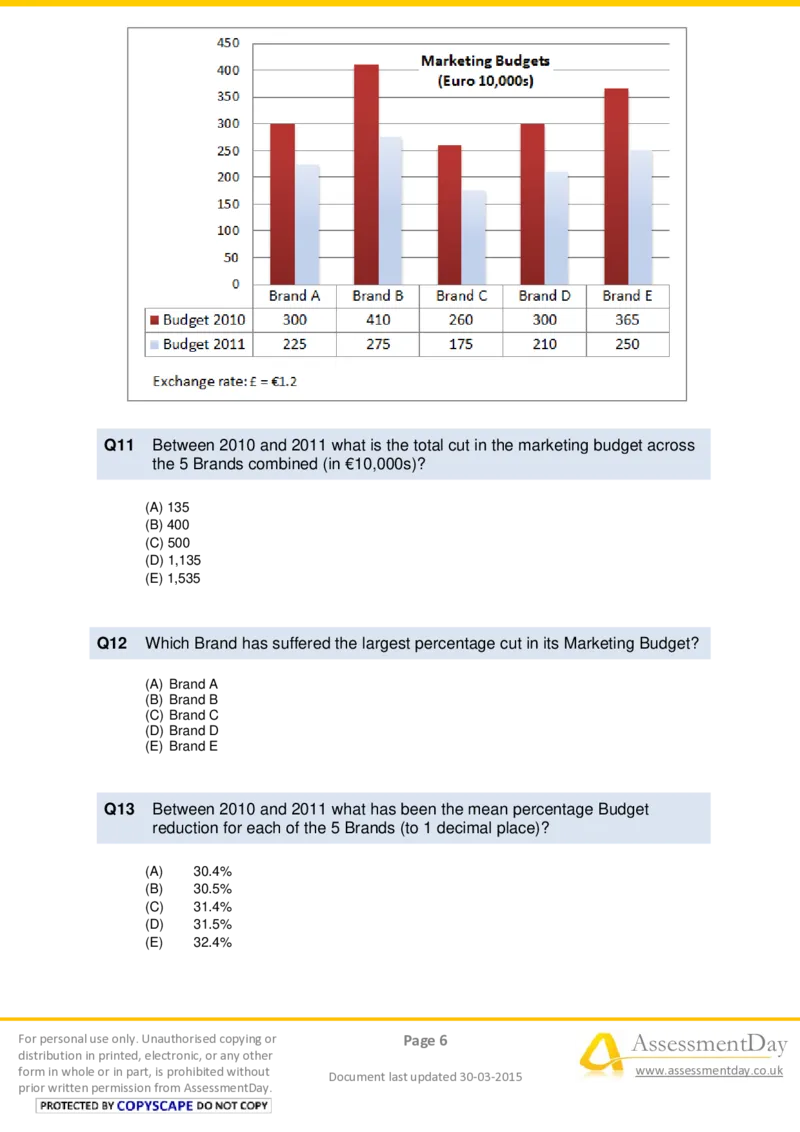
prior written permission from AssessmentDay.Q11 Between 2010 and 2011 what is the total cut in the marketing budget across
the 5 Brands combined (in €10,000s)?
(A) 135
(B) 400
(C) 500
(D) 1,135
(E) 1,535
Q12 Which Brand has suffered the largest percentage cut in its Marketing Budget?
(A) Brand A
(B) Brand B
(C) Brand C
(D) Brand D
(E) Brand E
Q13 Between 2010 and 2011 what has been the mean percentage Budget
reduction for each of the 5 Brands (to 1 decimal place)?
(A) 30.4%
(B) 30.5%
(C) 31.4%
(D) 31.5%
(E) 32.4%
For personal use only. Unauthorised copying or Page 6 AssessmentDay
distribution in printed, electronic, or any other
form in whole or in part, is prohibited without www.assessmentday.co.uk
Document last updated 30-03-2015
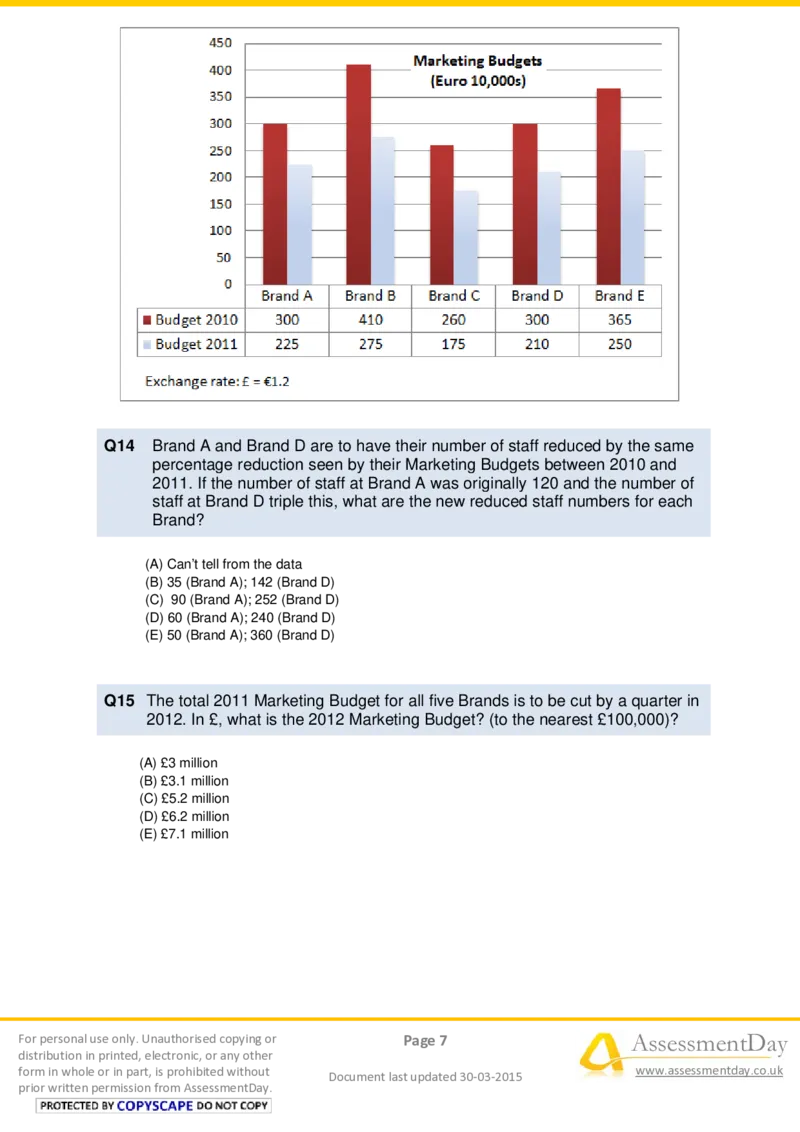
prior written permission from AssessmentDay.Q14 Brand A and Brand D are to have their number of staff reduced by the same
percentage reduction seen by their Marketing Budgets between 2010 and
2011. If the number of staff at Brand A was originally 120 and the number of
staff at Brand D triple this, what are the new reduced staff numbers for each
Brand?
(A) Can’t tell from the data
(B) 35 (Brand A); 142 (Brand D)
(C) 90 (Brand A); 252 (Brand D)
(D) 60 (Brand A); 240 (Brand D)
(E) 50 (Brand A); 360 (Brand D)
Q15 The total 2011 Marketing Budget for all five Brands is to be cut by a quarter in
2012. In £, what is the 2012 Marketing Budget? (to the nearest £100,000)?
(A) £3 million
(B) £3.1 million
(C) £5.2 million
(D) £6.2 million
(E) £7.1 million
For personal use only. Unauthorised copying or Page 7 AssessmentDay
distribution in printed, electronic, or any other
form in whole or in part, is prohibited without www.assessmentday.co.uk
Document last updated 30-03-2015
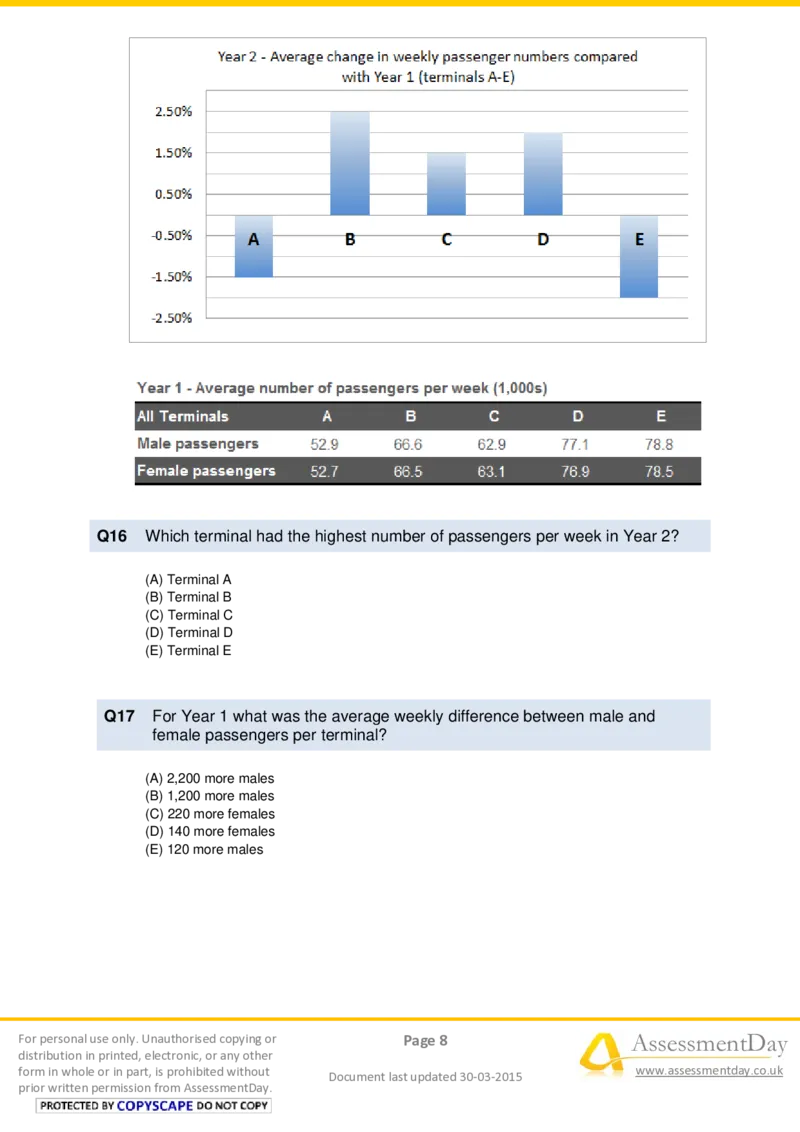
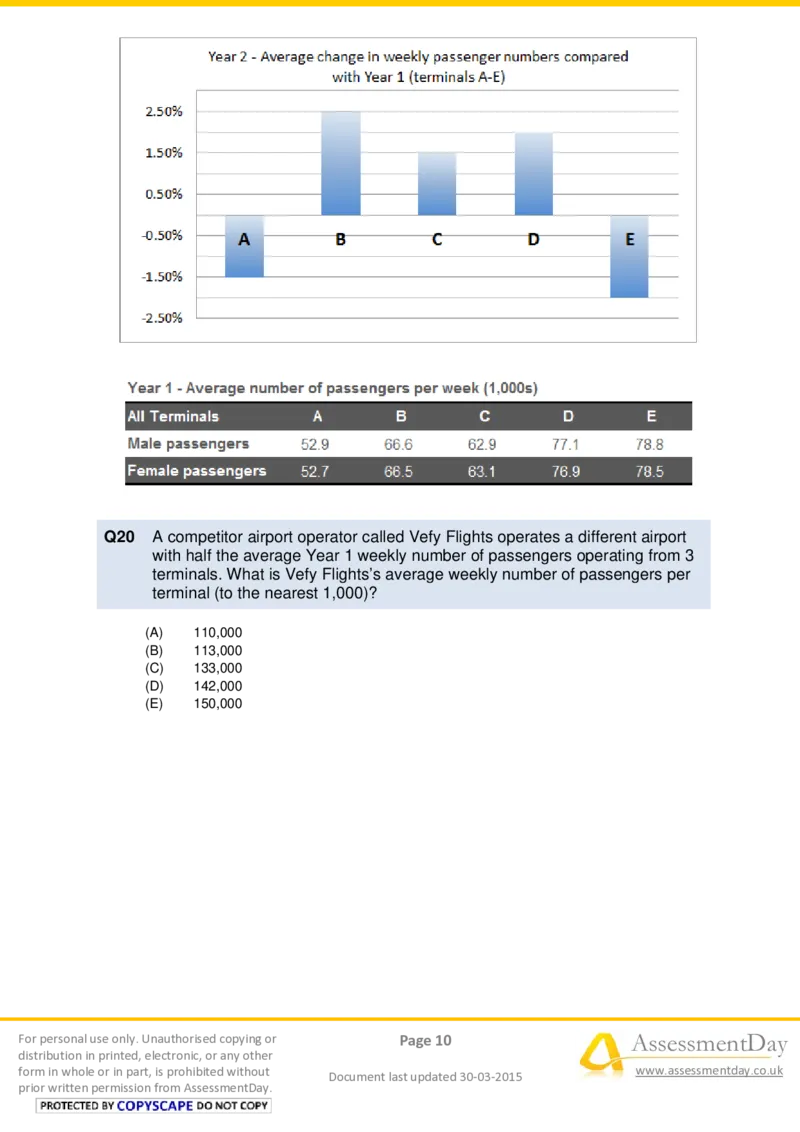
prior written permission from AssessmentDay.Q16 Which terminal had the highest number of passengers per week in Year 2?
(A) Terminal A
(B) Terminal B
(C) Terminal C
(D) Terminal D
(E) Terminal E
Q17 For Year 1 what was the average weekly difference between male and
female passengers per terminal?
(A) 2,200 more males
(B) 1,200 more males
(C) 220 more females
(D) 140 more females
(E) 120 more males
For personal use only. Unauthorised copying or Page 8 AssessmentDay
distribution in printed, electronic, or any other
form in whole or in part, is prohibited without www.assessmentday.co.uk
Document last updated 30-03-2015
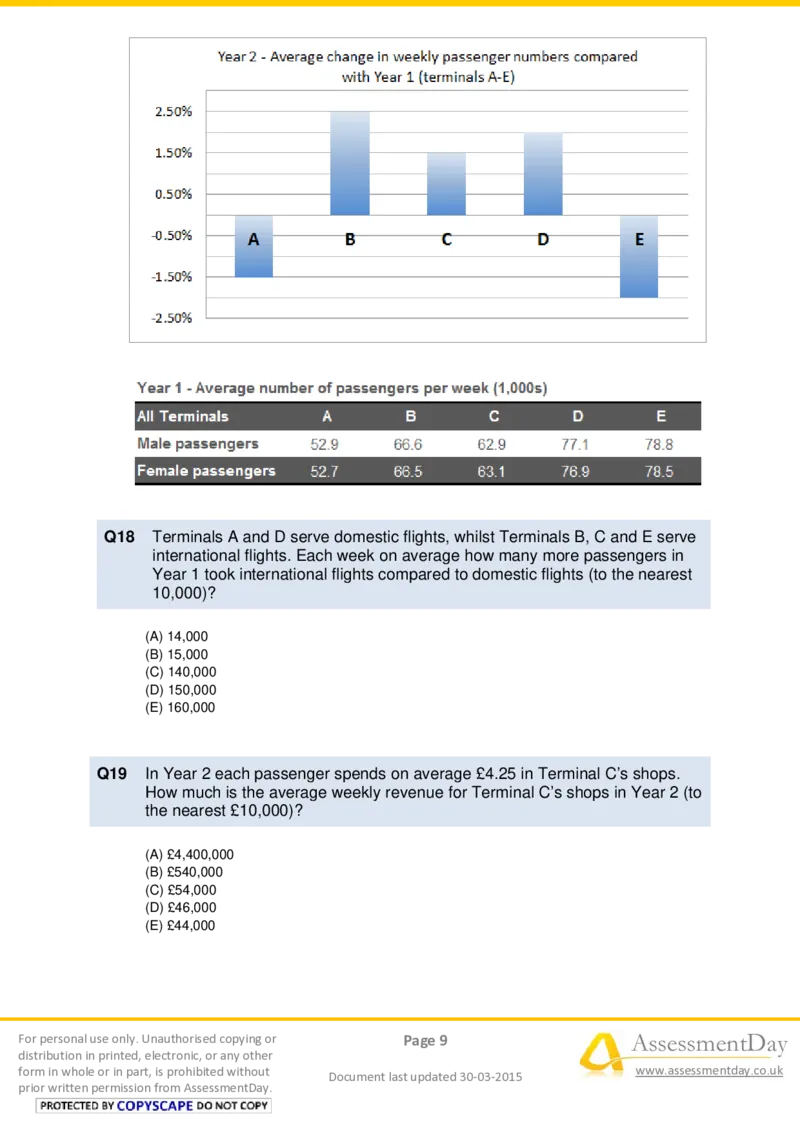
prior written permission from AssessmentDay.Q18 Terminals A and D serve domestic flights, whilst Terminals B, C and E serve
international flights. Each week on average how many more passengers in
Year 1 took international flights compared to domestic flights (to the nearest
10,000)?
(A) 14,000
(B) 15,000
(C) 140,000
(D) 150,000
(E) 160,000
Q19 In Year 2 each passenger spends on average £4.25 in Terminal C’s shops.
How much is the average weekly revenue for Terminal C’s shops in Year 2 (to
the nearest £10,000)?
(A) £4,400,000
(B) £540,000
(C) £54,000
(D) £46,000
(E) £44,000
For personal use only. Unauthorised copying or Page 9 AssessmentDay
distribution in printed, electronic, or any other
form in whole or in part, is prohibited without www.assessmentday.co.uk
Document last updated 30-03-2015
prior written permission from AssessmentDay.Q20 A competitor airport operator called Vefy Flights operates a different airport
with half the average Year 1 weekly number of passengers operating from 3
terminals. What is Vefy Flights’s average weekly number of passengers per
terminal (to the nearest 1,000)?
(A) 110,000
(B) 113,000
(C) 133,000
(D) 142,000
(E) 150,000
For personal use only. Unauthorised copying or Page 10 AssessmentDay
distribution in printed, electronic, or any other
form in whole or in part, is prohibited without www.assessmentday.co.uk
Document last updated 30-03-2015
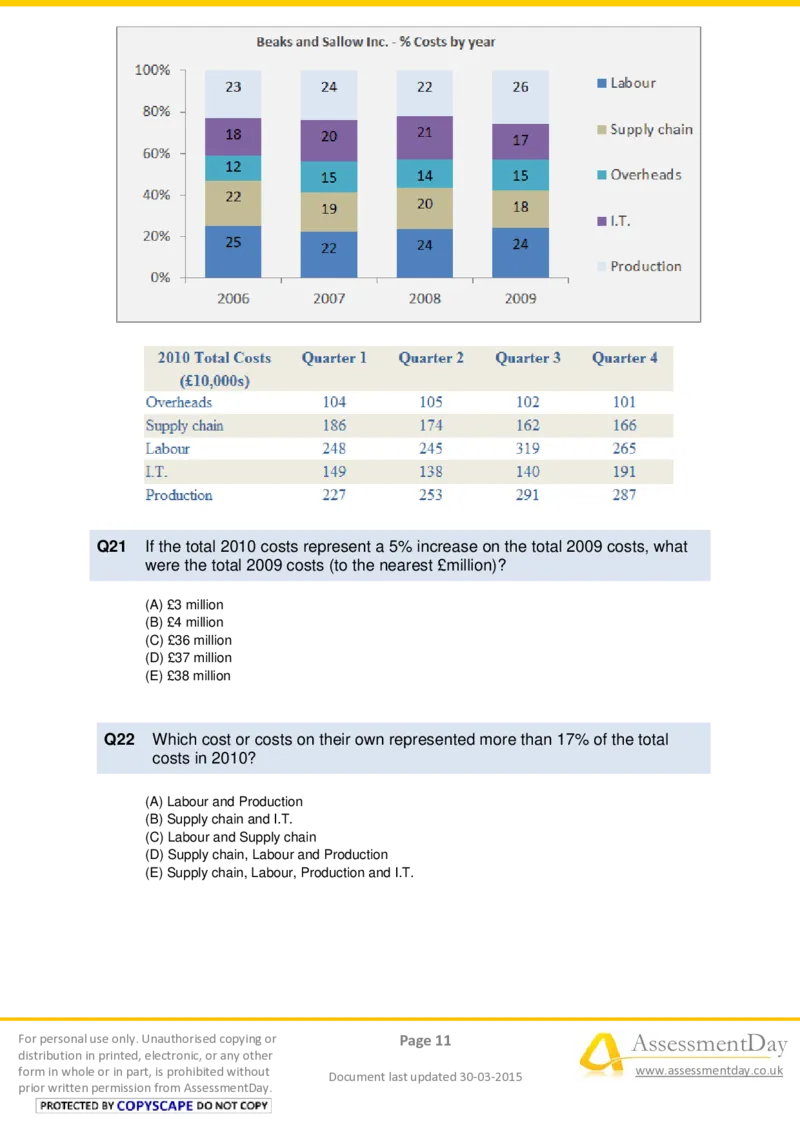
prior written permission from AssessmentDay.Q21 If the total 2010 costs represent a 5% increase on the total 2009 costs, what
were the total 2009 costs (to the nearest £million)?
(A) £3 million
(B) £4 million
(C) £36 million
(D) £37 million
(E) £38 million
Q22 Which cost or costs on their own represented more than 17% of the total
costs in 2010?
(A) Labour and Production
(B) Supply chain and I.T.
(C) Labour and Supply chain
(D) Supply chain, Labour and Production
(E) Supply chain, Labour, Production and I.T.
For personal use only. Unauthorised copying or Page 11 AssessmentDay
distribution in printed, electronic, or any other
form in whole or in part, is prohibited without www.assessmentday.co.uk
Document last updated 30-03-2015
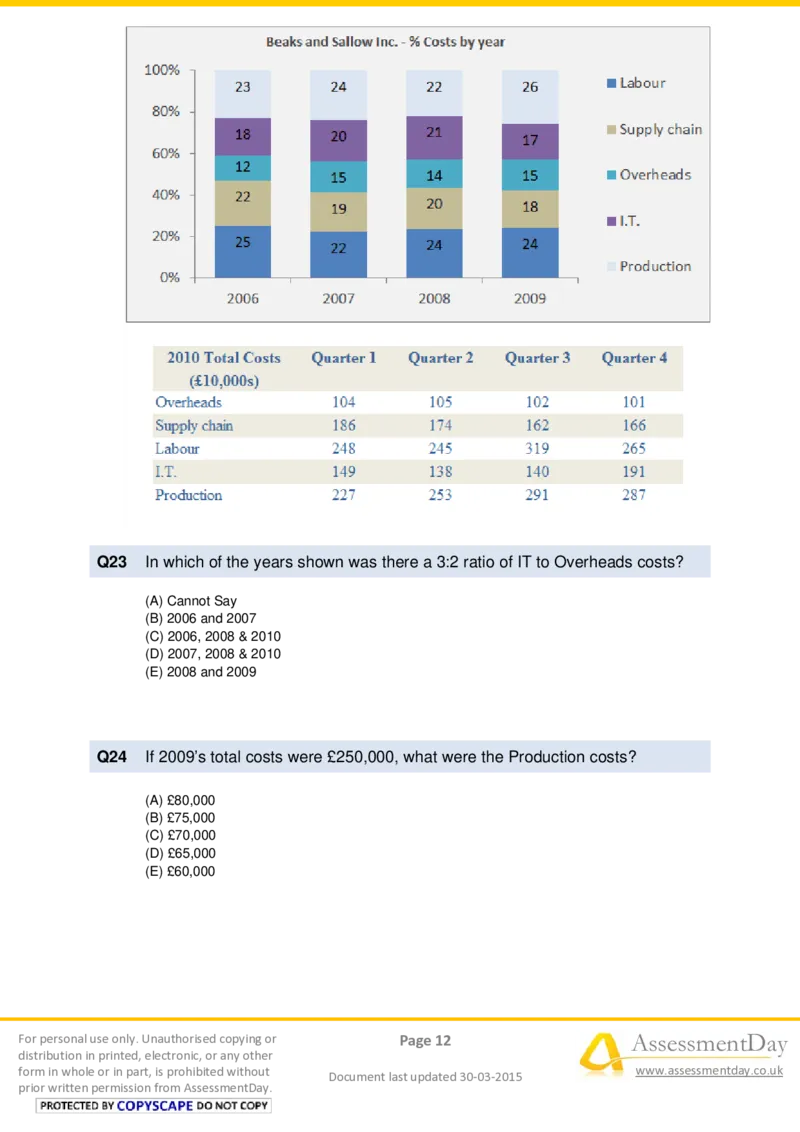
prior written permission from AssessmentDay.Q23 In which of the years shown was there a 3:2 ratio of IT to Overheads costs?
(A) Cannot Say
(B) 2006 and 2007
(C) 2006, 2008 & 2010
(D) 2007, 2008 & 2010
(E) 2008 and 2009
Q24 If 2009’s total costs were £250,000, what were the Production costs?
(A) £80,000
(B) £75,000
(C) £70,000
(D) £65,000
(E) £60,000
For personal use only. Unauthorised copying or Page 12 AssessmentDay
distribution in printed, electronic, or any other
form in whole or in part, is prohibited without www.assessmentday.co.uk
Document last updated 30-03-2015
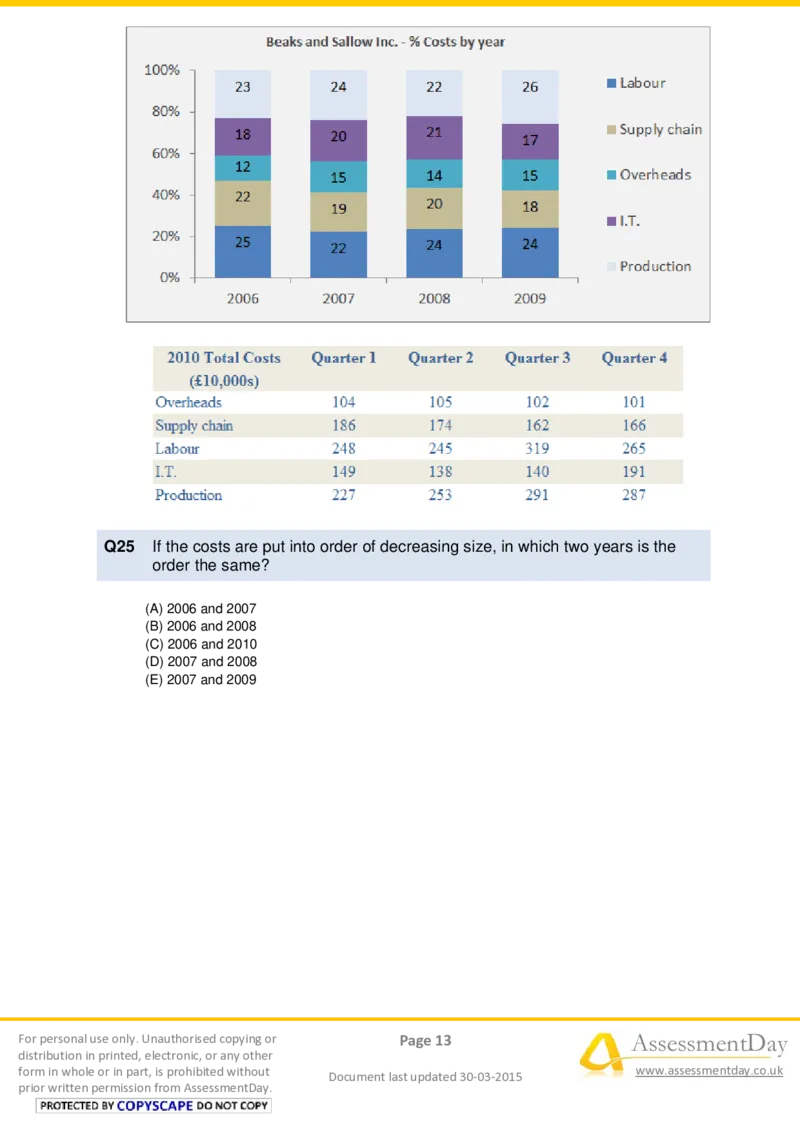
prior written permission from AssessmentDay.Q25 If the costs are put into order of decreasing size, in which two years is the
order the same?
(A) 2006 and 2007
(B) 2006 and 2008
(C) 2006 and 2010
(D) 2007 and 2008
(E) 2007 and 2009
For personal use only. Unauthorised copying or Page 13 AssessmentDay
distribution in printed, electronic, or any other
form in whole or in part, is prohibited without www.assessmentday.co.uk
Document last updated 30-03-2015
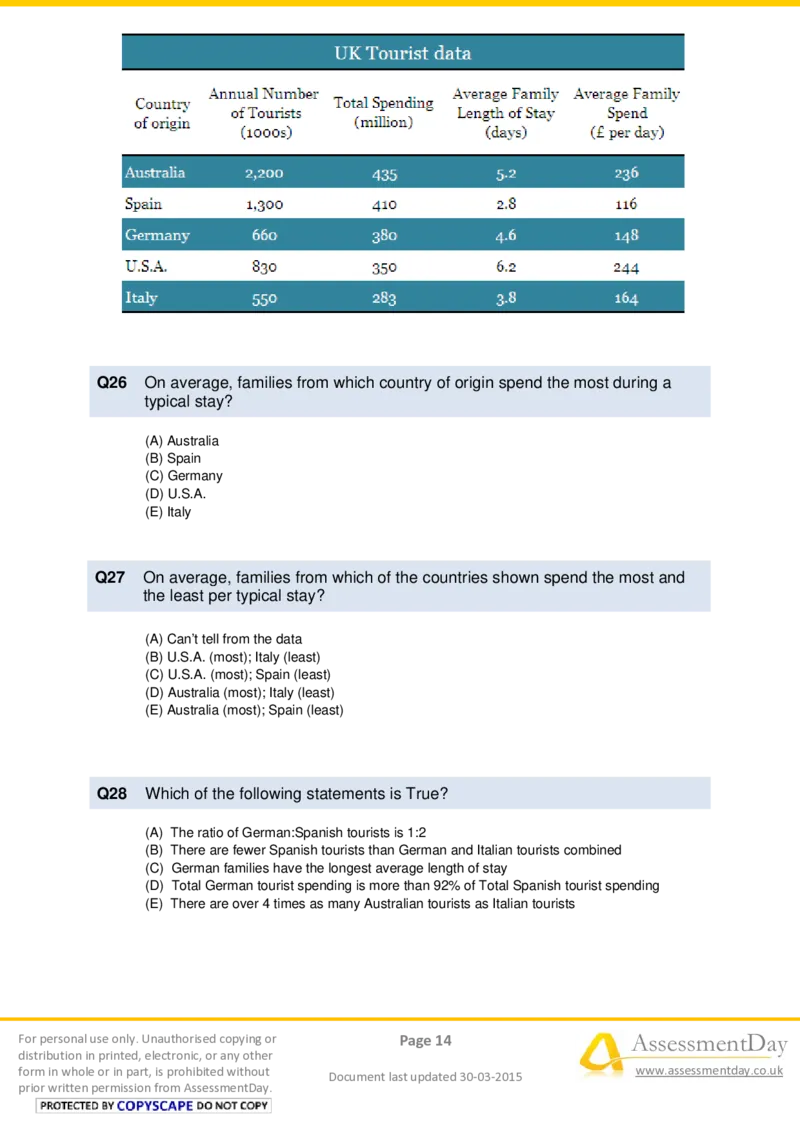
prior written permission from AssessmentDay.Q26 On average, families from which country of origin spend the most during a
typical stay?
(A) Australia
(B) Spain
(C) Germany
(D) U.S.A.
(E) Italy
Q27 On average, families from which of the countries shown spend the most and
the least per typical stay?
(A) Can’t tell from the data
(B) U.S.A. (most); Italy (least)
(C) U.S.A. (most); Spain (least)
(D) Australia (most); Italy (least)
(E) Australia (most); Spain (least)
Q28 Which of the following statements is True?
(A) The ratio of German:Spanish tourists is 1:2
(B) There are fewer Spanish tourists than German and Italian tourists combined
(C) German families have the longest average length of stay
(D) Total German tourist spending is more than 92% of Total Spanish tourist spending
(E) There are over 4 times as many Australian tourists as Italian tourists
For personal use only. Unauthorised copying or Page 14 AssessmentDay
distribution in printed, electronic, or any other
form in whole or in part, is prohibited without www.assessmentday.co.uk
Document last updated 30-03-2015
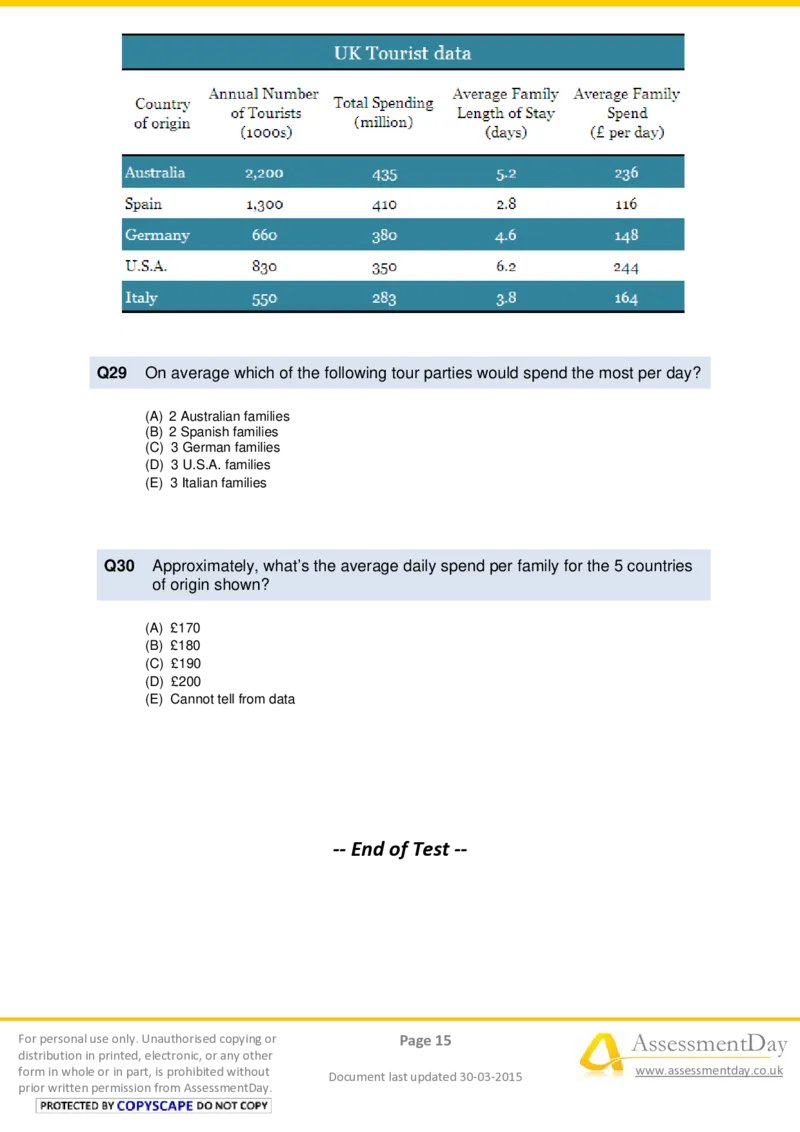
prior written permission from AssessmentDay.Q29 On average which of the following tour parties would spend the most per day?
(A) 2 Australian families
(B) 2 Spanish families
(C) 3 German families
(D) 3 U.S.A. families
(E) 3 Italian families
Q30 Approximately, what’s the average daily spend per family for the 5 countries
of origin shown?
(A) £170
(B) £180
(C) £190
(D) £200
(E) Cannot tell from data
-- End of Test --
For personal use only. Unauthorised copying or Page 15 AssessmentDay
distribution in printed, electronic, or any other
form in whole or in part, is prohibited without www.assessmentday.co.uk
Document last updated 30-03-2015
prior written permission from AssessmentDay.
