文档内容
1、
(1)
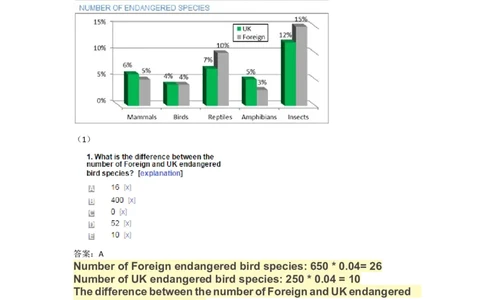
答案:A
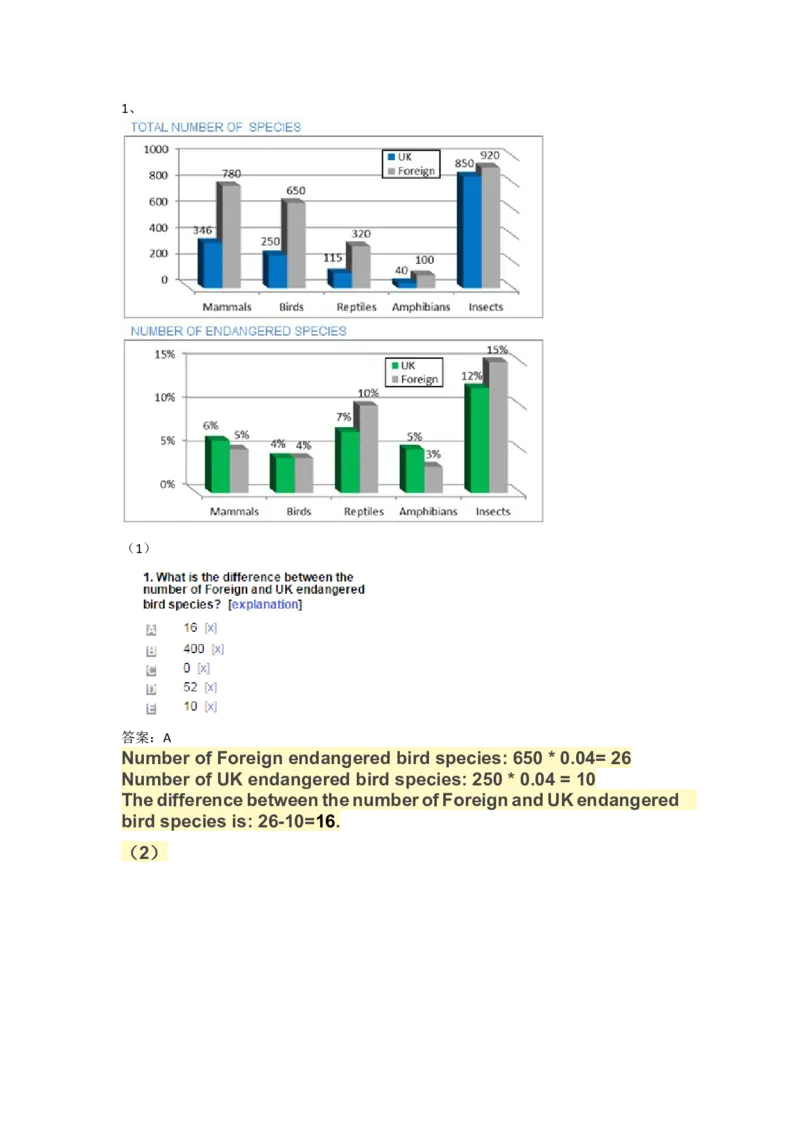
Number of Foreign endangered bird species: 650 * 0.04= 26
Number of UK endangered bird species: 250 * 0.04 = 10
The difference between the number of Foreign and UK endangered
bird species is: 26-10=16.
(2)答案:B
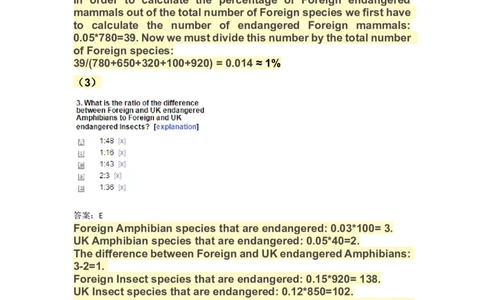
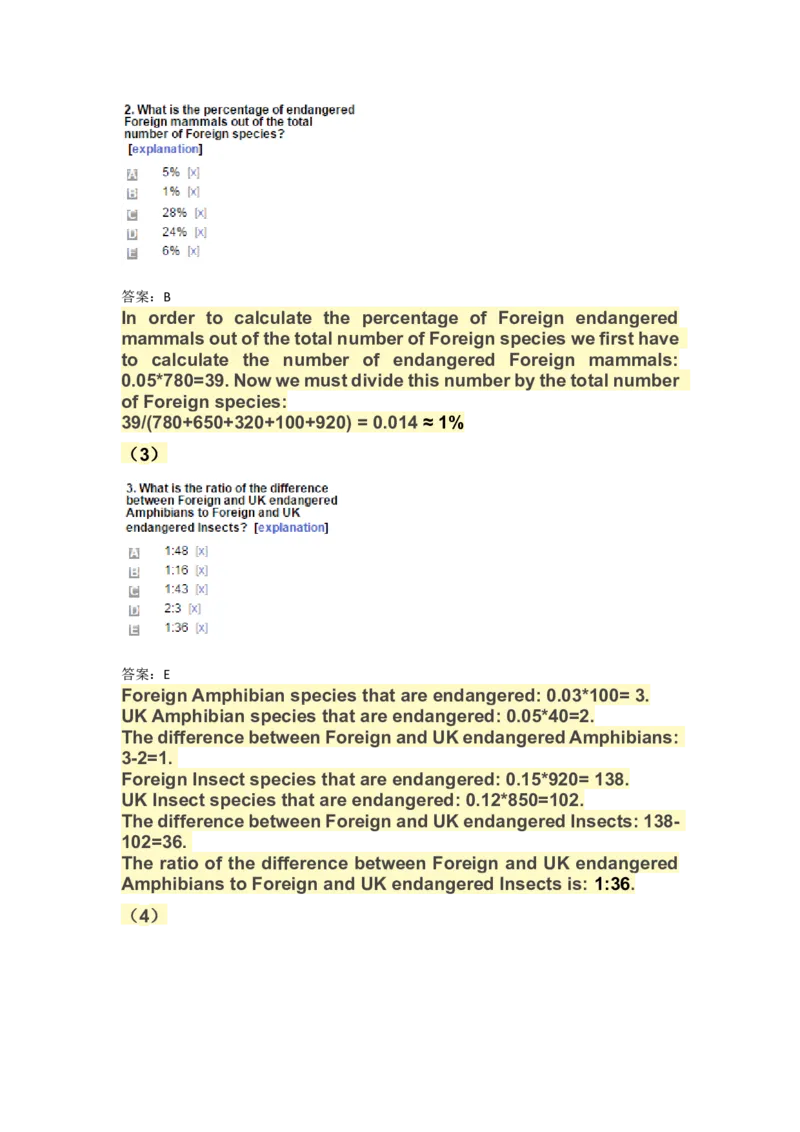
In order to calculate the percentage of Foreign endangered
mammals out of the total number of Foreign species we first have
to calculate the number of endangered Foreign mammals:
0.05*780=39. Now we must divide this number by the total number
of Foreign species:
39/(780+650+320+100+920) = 0.014 ≈ 1%
(3)
答案:E
Foreign Amphibian species that are endangered: 0.03*100= 3.
UK Amphibian species that are endangered: 0.05*40=2.
The difference between Foreign and UK endangered Amphibians:
3-2=1.
Foreign Insect species that are endangered: 0.15*920= 138.
UK Insect species that are endangered: 0.12*850=102.
The difference between Foreign and UK endangered Insects: 138-
102=36.
The ratio of the difference between Foreign and UK endangered
Amphibians to Foreign and UK endangered Insects is: 1:36.
(4)答案:D
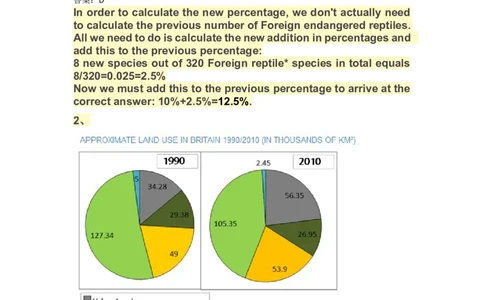
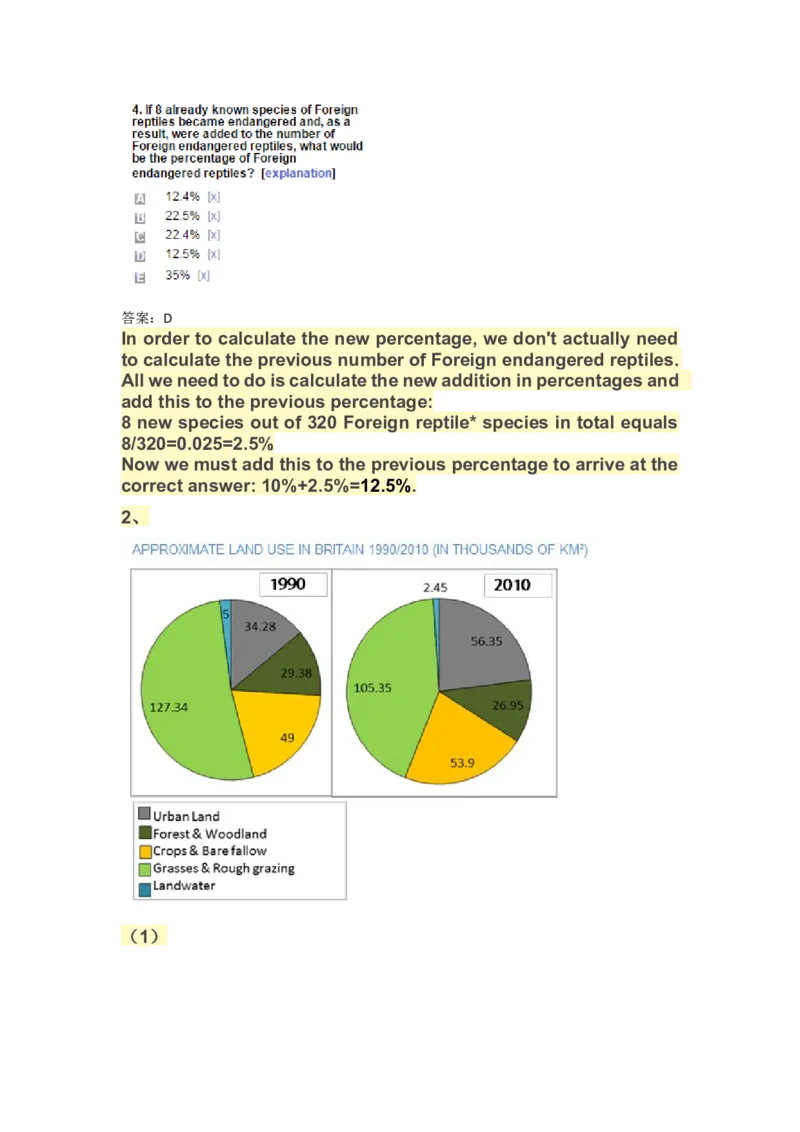
In order to calculate the new percentage, we don't actually need
to calculate the previous number of Foreign endangered reptiles.
All we need to do is calculate the new addition in percentages and
add this to the previous percentage:
8 new species out of 320 Foreign reptile* species in total equals
8/320=0.025=2.5%
Now we must add this to the previous percentage to arrive at the
correct answer: 10%+2.5%=12.5%.
2、
(1)答案:C
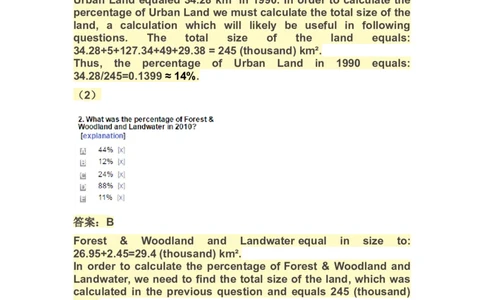
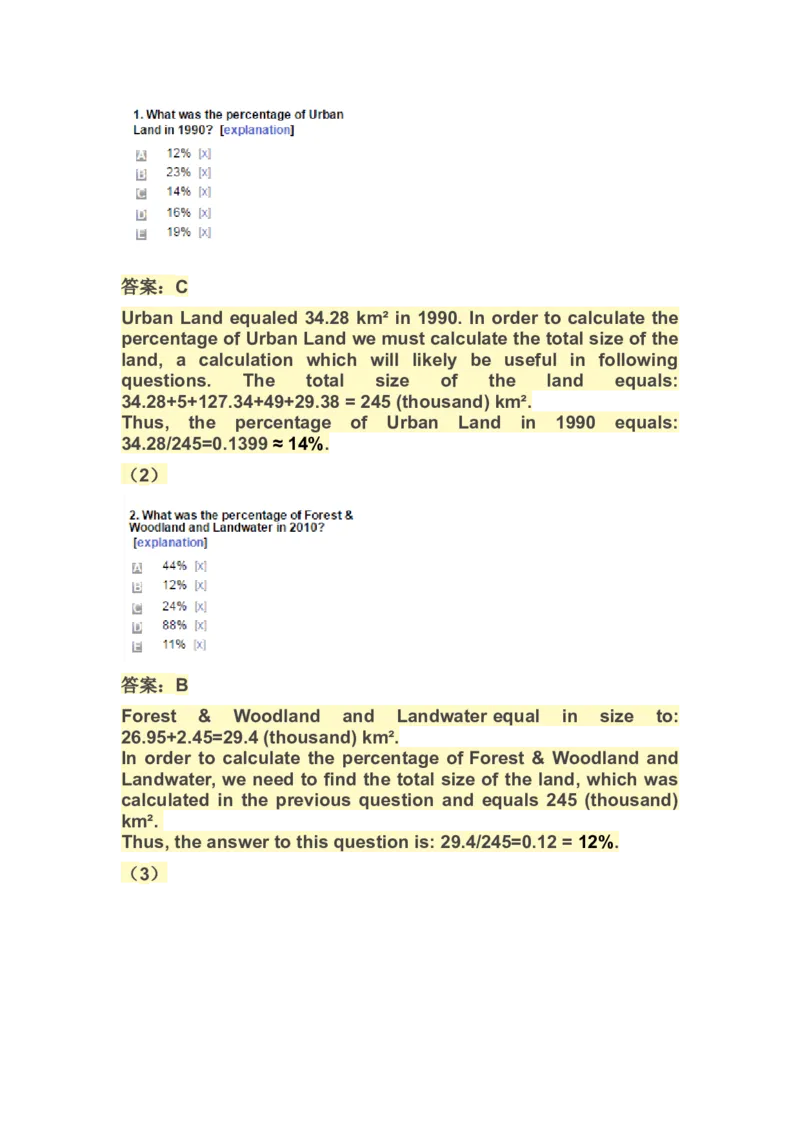
Urban Land equaled 34.28 km² in 1990. In order to calculate the
percentage of Urban Land we must calculate the total size of the
land, a calculation which will likely be useful in following
questions. The total size of the land equals:
34.28+5+127.34+49+29.38 = 245 (thousand) km².
Thus, the percentage of Urban Land in 1990 equals:
34.28/245=0.1399 ≈ 14%.
(2)
答案:B
Forest & Woodland and Landwater equal in size to:
26.95+2.45=29.4 (thousand) km².
In order to calculate the percentage of Forest & Woodland and
Landwater, we need to find the total size of the land, which was
calculated in the previous question and equals 245 (thousand)
km².
Thus, the answer to this question is: 29.4/245=0.12 = 12%.
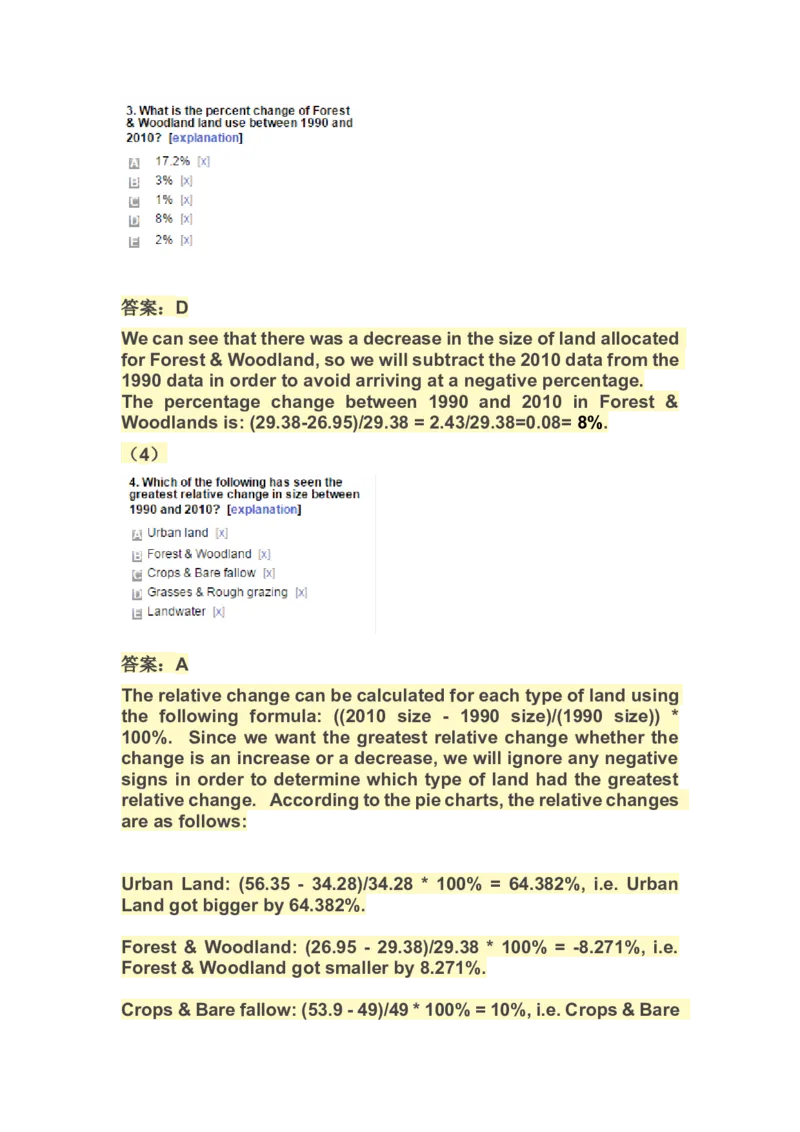
(3)答案:D
We can see that there was a decrease in the size of land allocated
for Forest & Woodland, so we will subtract the 2010 data from the
1990 data in order to avoid arriving at a negative percentage.
The percentage change between 1990 and 2010 in Forest &
Woodlands is: (29.38-26.95)/29.38 = 2.43/29.38=0.08= 8%.
(4)
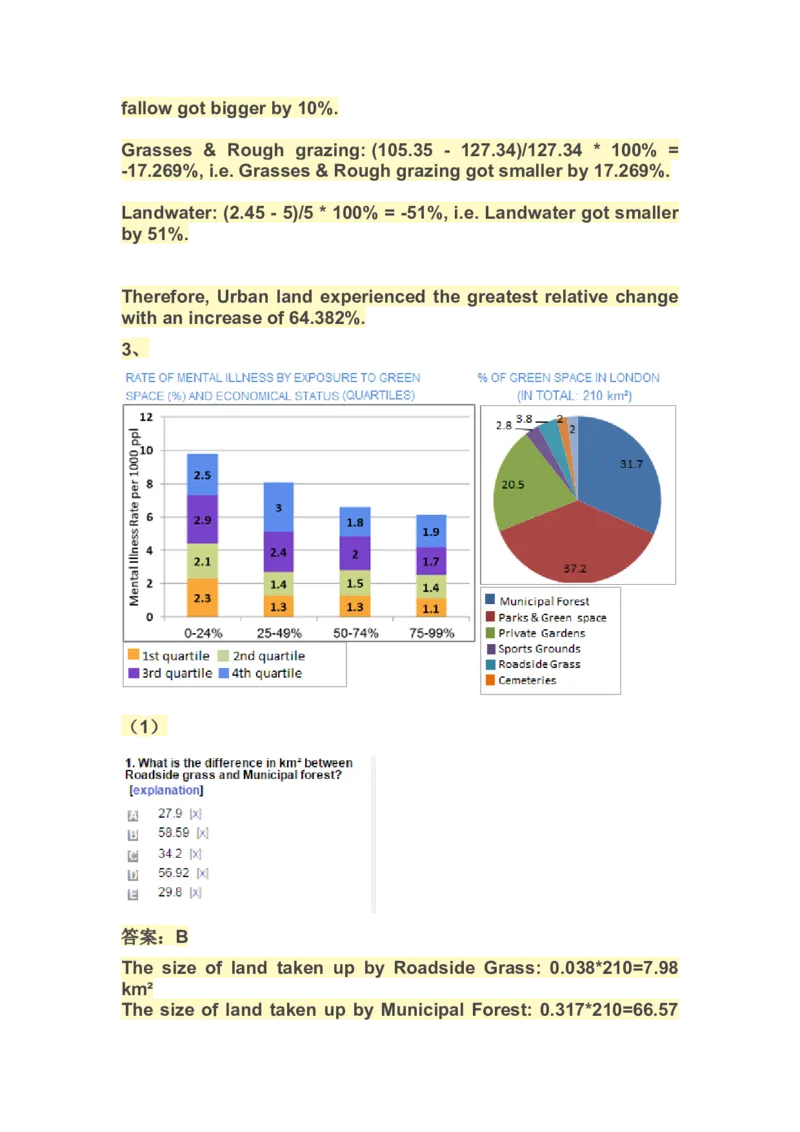
答案:A
The relative change can be calculated for each type of land using
the following formula: ((2010 size - 1990 size)/(1990 size)) *
100%. Since we want the greatest relative change whether the
change is an increase or a decrease, we will ignore any negative
signs in order to determine which type of land had the greatest
relative change. According to the pie charts, the relative changes
are as follows:
Urban Land: (56.35 - 34.28)/34.28 * 100% = 64.382%, i.e. Urban
Land got bigger by 64.382%.
Forest & Woodland: (26.95 - 29.38)/29.38 * 100% = -8.271%, i.e.
Forest & Woodland got smaller by 8.271%.
Crops & Bare fallow: (53.9 - 49)/49 * 100% = 10%, i.e. Crops & Barefallow got bigger by 10%.
Grasses & Rough grazing: (105.35 - 127.34)/127.34 * 100% =
-17.269%, i.e. Grasses & Rough grazing got smaller by 17.269%.
Landwater: (2.45 - 5)/5 * 100% = -51%, i.e. Landwater got smaller
by 51%.
Therefore, Urban land experienced the greatest relative change
with an increase of 64.382%.
3、
(1)
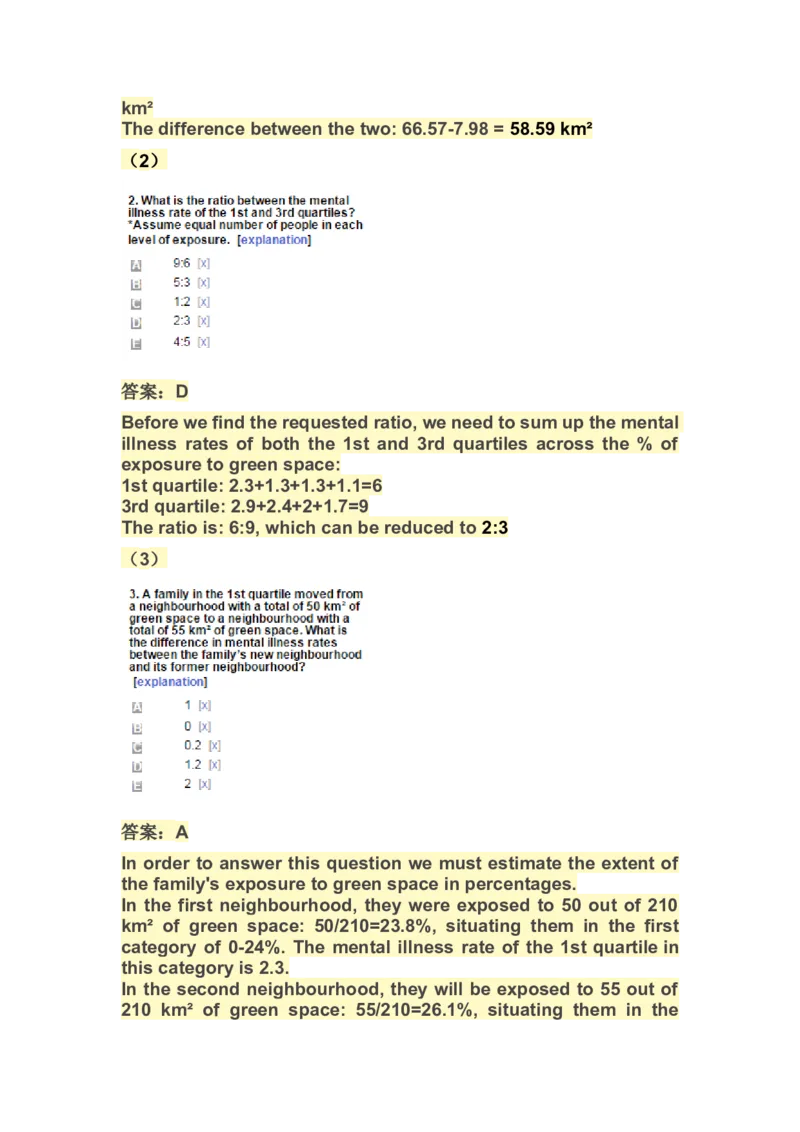
答案:B
The size of land taken up by Roadside Grass: 0.038*210=7.98
km²
The size of land taken up by Municipal Forest: 0.317*210=66.57km²
The difference between the two: 66.57-7.98 = 58.59 km²
(2)
答案:D
Before we find the requested ratio, we need to sum up the mental
illness rates of both the 1st and 3rd quartiles across the % of
exposure to green space:
1st quartile: 2.3+1.3+1.3+1.1=6
3rd quartile: 2.9+2.4+2+1.7=9
The ratio is: 6:9, which can be reduced to 2:3
(3)
答案:A
In order to answer this question we must estimate the extent of
the family's exposure to green space in percentages.
In the first neighbourhood, they were exposed to 50 out of 210
km² of green space: 50/210=23.8%, situating them in the first
category of 0-24%. The mental illness rate of the 1st quartile in
this category is 2.3.
In the second neighbourhood, they will be exposed to 55 out of
210 km² of green space: 55/210=26.1%, situating them in thesecond category of 25-49%. The mental illness rate of
the 1st quartile in this category is 1.3.
Thus, the difference in mental illness rate is: 2.3-1.3=1.
(4)
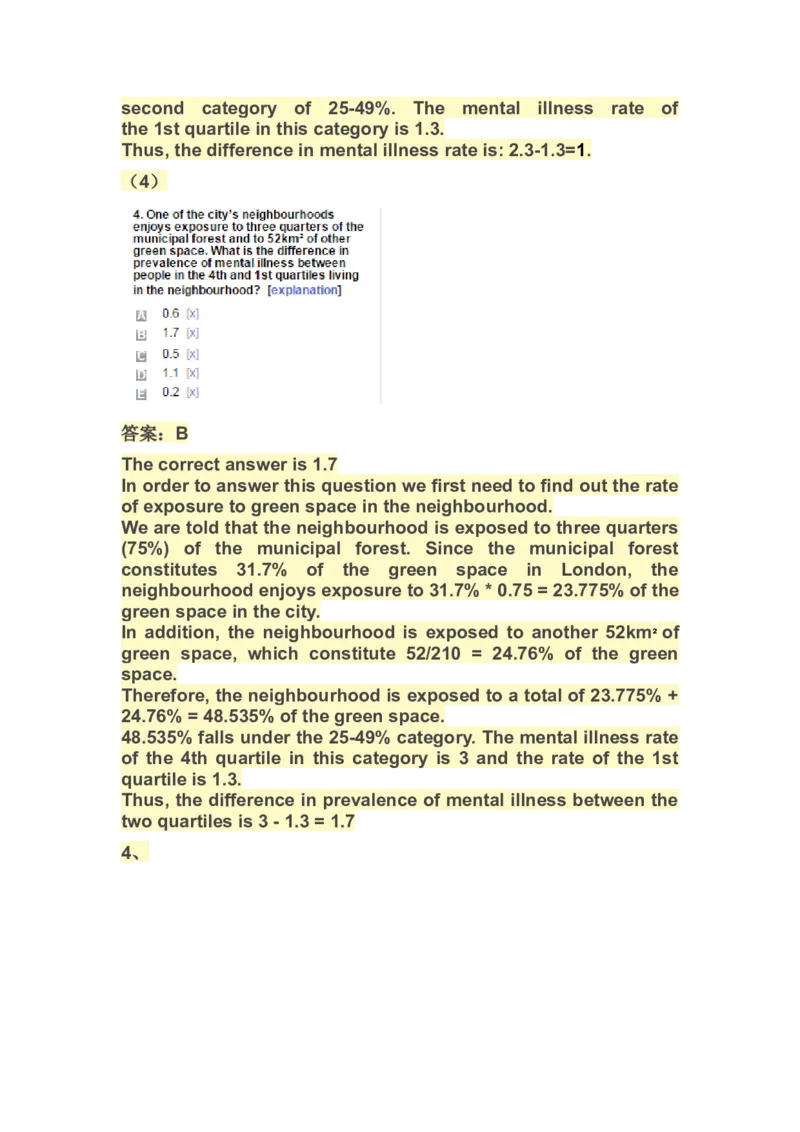
答案:B
The correct answer is 1.7
In order to answer this question we first need to find out the rate
of exposure to green space in the neighbourhood.
We are told that the neighbourhood is exposed to three quarters
(75%) of the municipal forest. Since the municipal forest
constitutes 31.7% of the green space in London, the
neighbourhood enjoys exposure to 31.7% * 0.75 = 23.775% of the
green space in the city.
In addition, the neighbourhood is exposed to another 52km² of
green space, which constitute 52/210 = 24.76% of the green
space.
Therefore, the neighbourhood is exposed to a total of 23.775% +
24.76% = 48.535% of the green space.
48.535% falls under the 25-49% category. The mental illness rate
of the 4th quartile in this category is 3 and the rate of the 1st
quartile is 1.3.
Thus, the difference in prevalence of mental illness between the
two quartiles is 3 - 1.3 = 1.7
4、(1)
答案:D
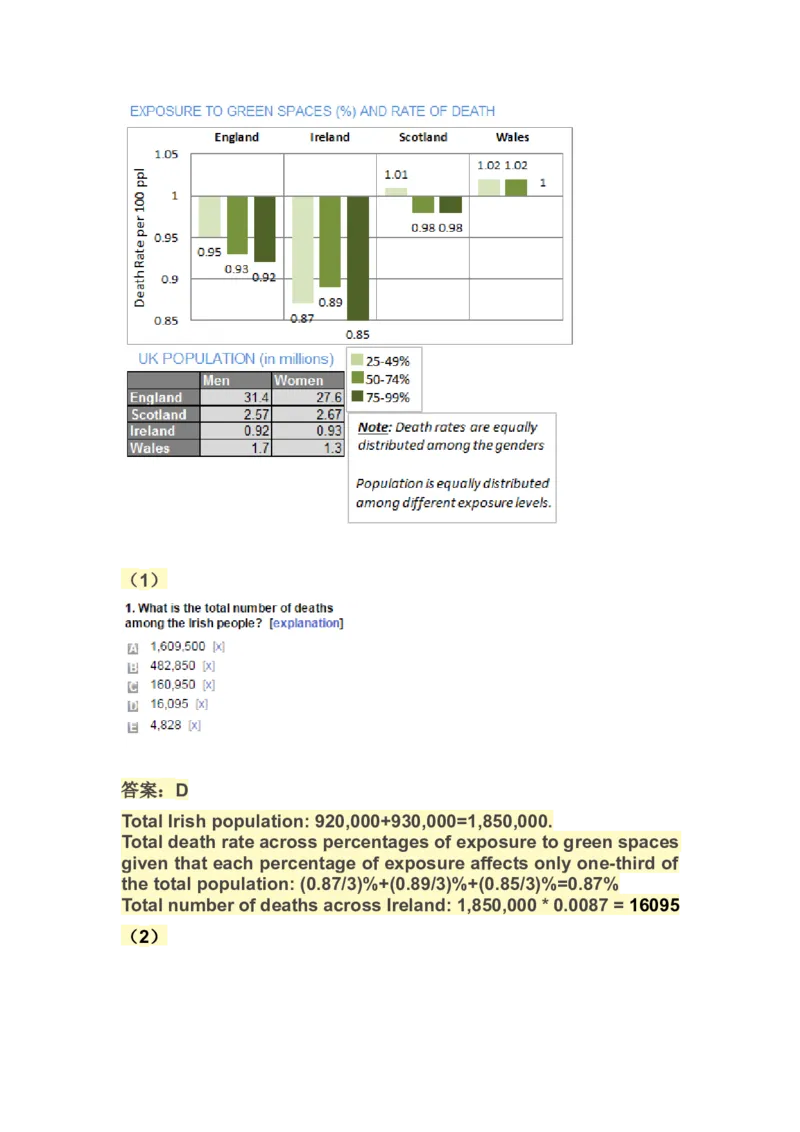
Total Irish population: 920,000+930,000=1,850,000.
Total death rate across percentages of exposure to green spaces
given that each percentage of exposure affects only one-third of
the total population: (0.87/3)%+(0.89/3)%+(0.85/3)%=0.87%
Total number of deaths across Ireland: 1,850,000 * 0.0087 = 16095
(2)答案:B
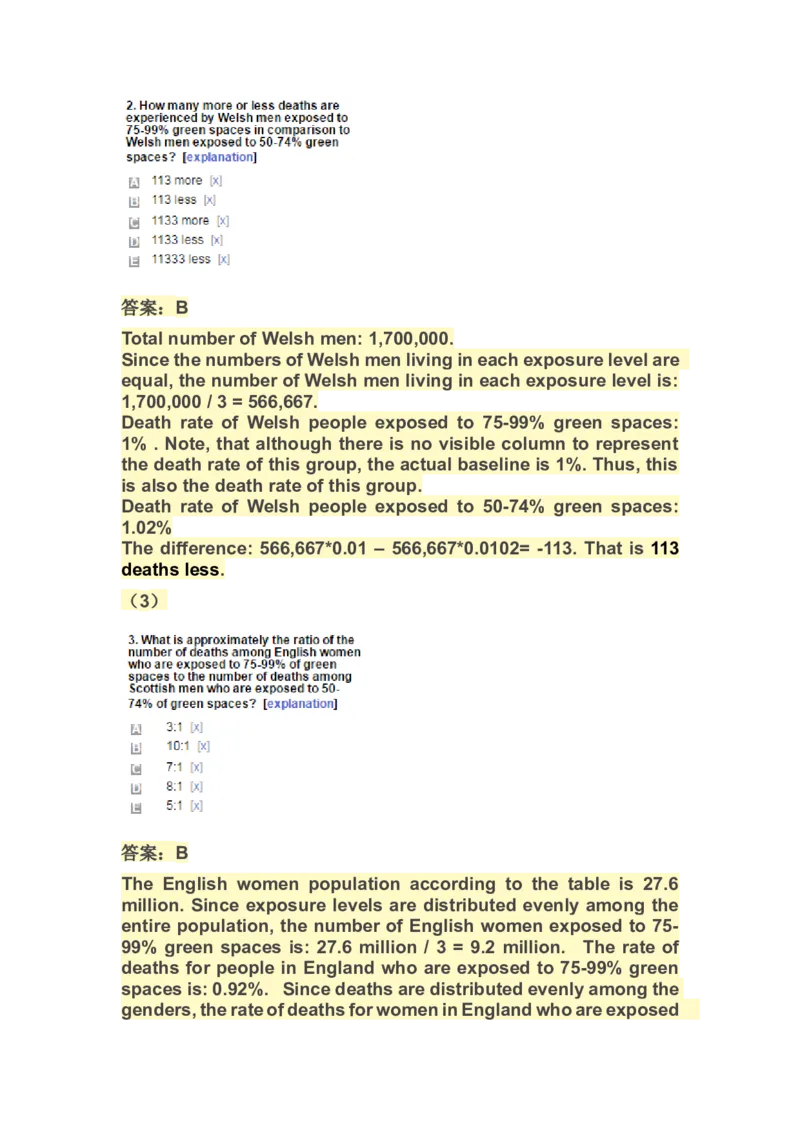
Total number of Welsh men: 1,700,000.
Since the numbers of Welsh men living in each exposure level are
equal, the number of Welsh men living in each exposure level is:
1,700,000 / 3 = 566,667.
Death rate of Welsh people exposed to 75-99% green spaces:
1% . Note, that although there is no visible column to represent
the death rate of this group, the actual baseline is 1%. Thus, this
is also the death rate of this group.
Death rate of Welsh people exposed to 50-74% green spaces:
1.02%
The difference: 566,667*0.01 – 566,667*0.0102= -113. That is 113
deaths less.
(3)
答案:B
The English women population according to the table is 27.6
million. Since exposure levels are distributed evenly among the
entire population, the number of English women exposed to 75-
99% green spaces is: 27.6 million / 3 = 9.2 million. The rate of
deaths for people in England who are exposed to 75-99% green
spaces is: 0.92%. Since deaths are distributed evenly among the
genders, the rate of deaths for women in England who are exposedto 75-99% green spaces is: 0.92% / 2 = 0.46%.
Thus, the number of deaths among this population is:
9,200,000*0.0046 = 42,320.
The Scottish men population according to the table is 2.57
million. Since exposure levels are distributed evenly among the
entire population, the number of Scottish men exposed to 50-74%
green spaces is: 2.75 million / 3 = 0.917 million. The rate of deaths
for people in Scotland who are exposed to 50-74% green spaces
is: 0.98%. Since deaths are distributed evenly among the
genders, the rate of deaths for Scottish men who are exposed to
50-74% green spaces is: 0.98% / 2 = 0.49%. Thus, the number of
deaths among this population is: 917,000*0.0049 = 4,490.
The ratio of the number of deaths among English women and
Scottish men is: 42,320:4,490.
The ratio can be reduced to approximately 10:1.
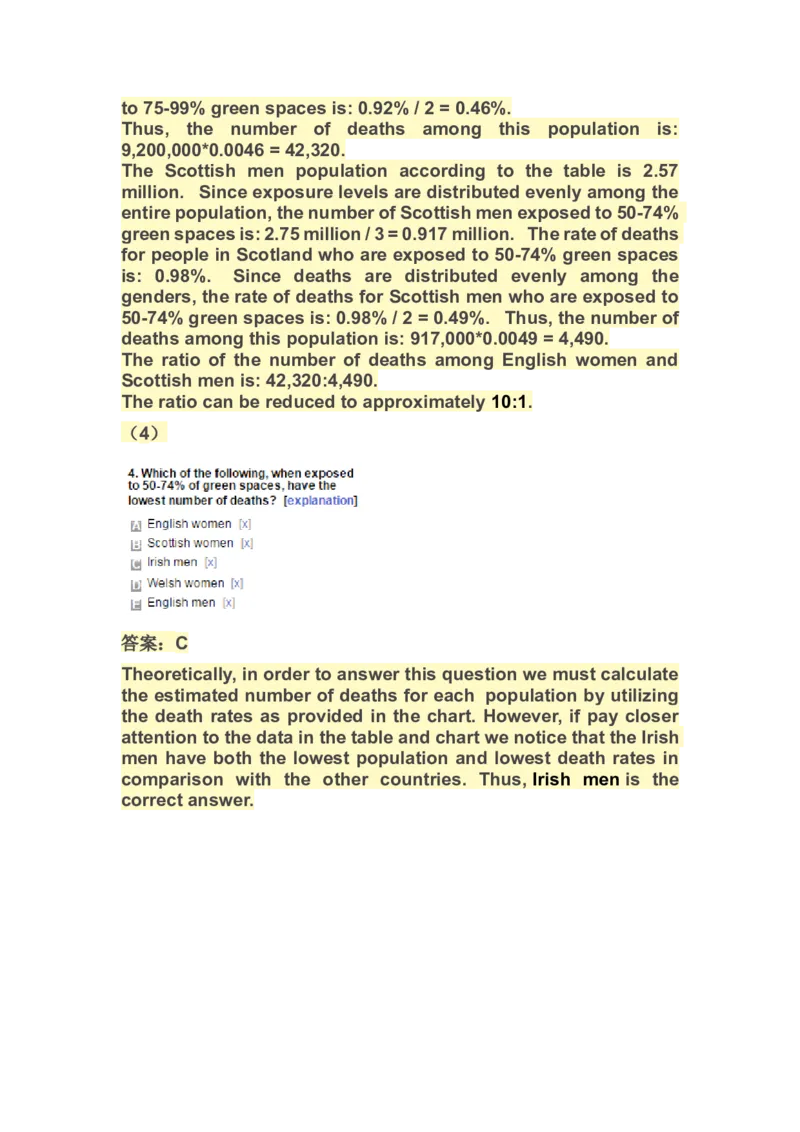
(4)
答案:C
Theoretically, in order to answer this question we must calculate
the estimated number of deaths for each population by utilizing
the death rates as provided in the chart. However, if pay closer
attention to the data in the table and chart we notice that the Irish
men have both the lowest population and lowest death rates in
comparison with the other countries. Thus, Irish men is the
correct answer.

