

文档内容
考研英语作文模板教程讲解
3. 首段写作方法(1)
欢迎关注WX公众号
见山考研首段
要点
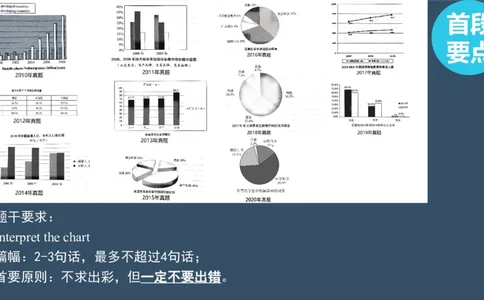
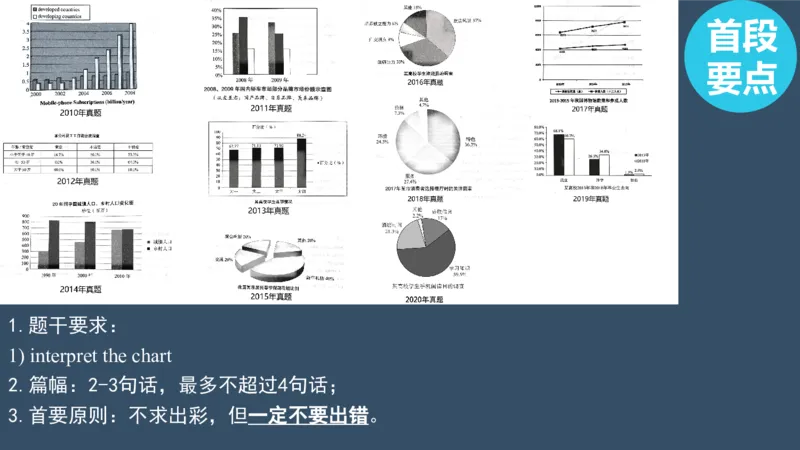
1.题干要求:
1) interpret the chart
2.篇幅:2-3句话,最多不超过4句话;
3.首要原则:不求出彩,但一定不要出错。首段
要点
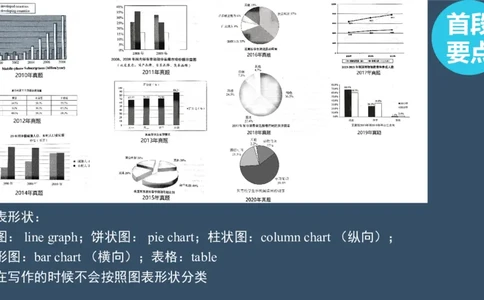
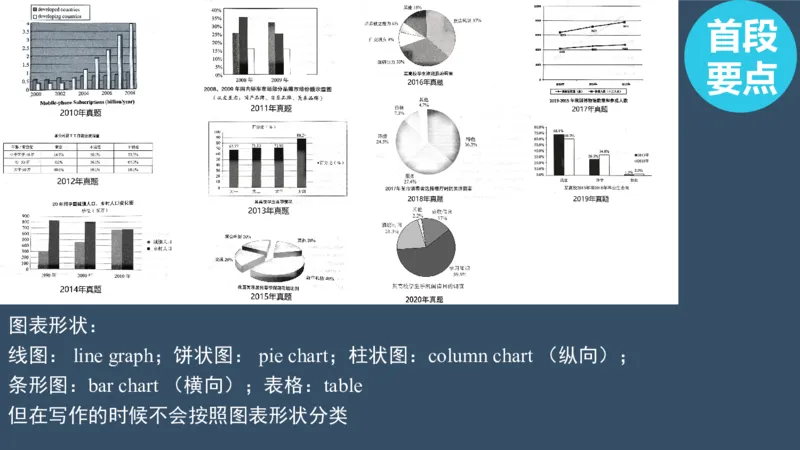
图表形状:
线图: line graph;饼状图: pie chart;柱状图:column chart (纵向);
条形图:bar chart (横向);表格:table
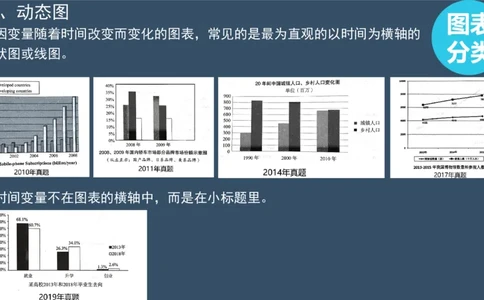
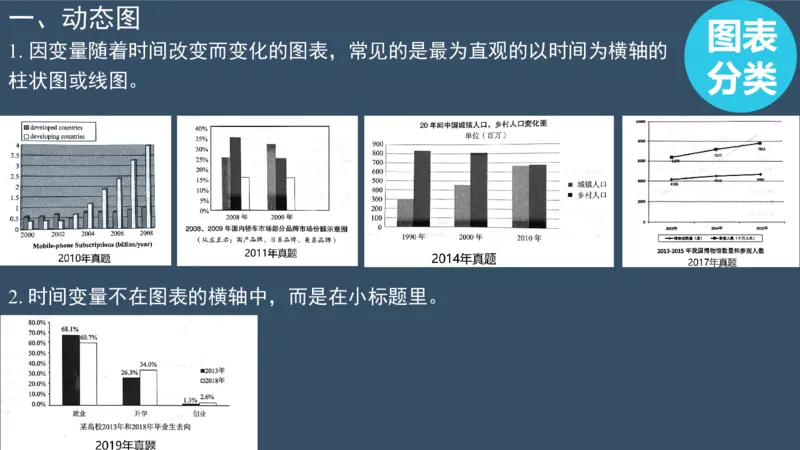
但在写作的时候不会按照图表形状分类一、动态图
图表
1. 因变量随着时间改变而变化的图表,常见的是最为直观的以时间为横轴的
分类
柱状图或线图。
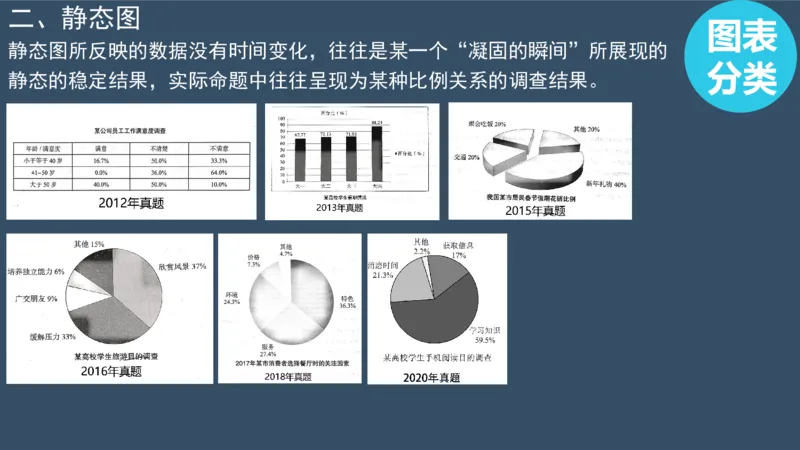
2. 时间变量不在图表的横轴中,而是在小标题里。二、静态图
图表
静态图所反映的数据没有时间变化,往往是某一个“凝固的瞬间”所展现的
分类
静态的稳定结果,实际命题中往往呈现为某种比例关系的调查结果。描述步骤
图表
1. 总述;2. 描述最大信息点。
描述
动态图总述句1:
The column chart clearly reflects/reveals the changes in the statistics of mobile-phone
subscriptions in developing countries and developed countries from 2000 to 2008.
译文:该柱状图清晰地反映了2000年至2008年发展中国家和发达国家手机用户统计数据的
变化。
所包含信息:
图表类型(column chart),时间(2000 to 2008)、地点(in developing countries and
developed countries)、统计对象(mobile-phone subscriptions)。描述步骤
图表
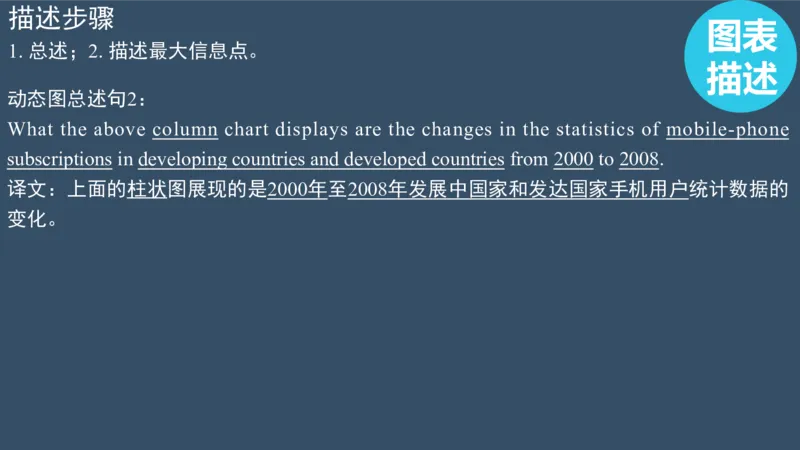
1. 总述;2. 描述最大信息点。
描述
动态图总述句2:
What the above column chart displays are the changes in the statistics of mobile-phone
subscriptions in developing countries and developed countries from 2000 to 2008.
译文:上面的柱状图展现的是2000年至2008年发展中国家和发达国家手机用户统计数据的
变化。描述步骤
图表
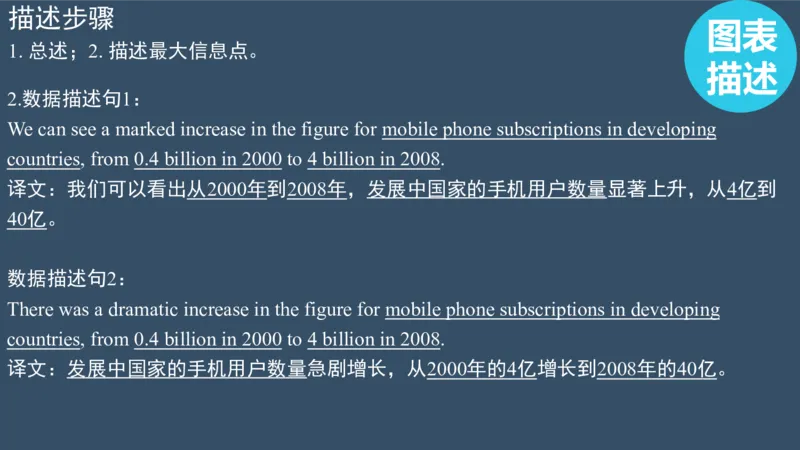
1. 总述;2. 描述最大信息点。
描述
2.数据描述句1:
We can see a marked increase in the figure for mobile phone subscriptions in developing
countries, from 0.4 billion in 2000 to 4 billion in 2008.
译文:我们可以看出从2000年到2008年,发展中国家的手机用户数量显著上升,从4亿到
40亿。
数据描述句2:
There was a dramatic increase in the figure for mobile phone subscriptions in developing
countries, from 0.4 billion in 2000 to 4 billion in 2008.
译文:发展中国家的手机用户数量急剧增长,从2000年的4亿增长到2008年的40亿。描述步骤
图表
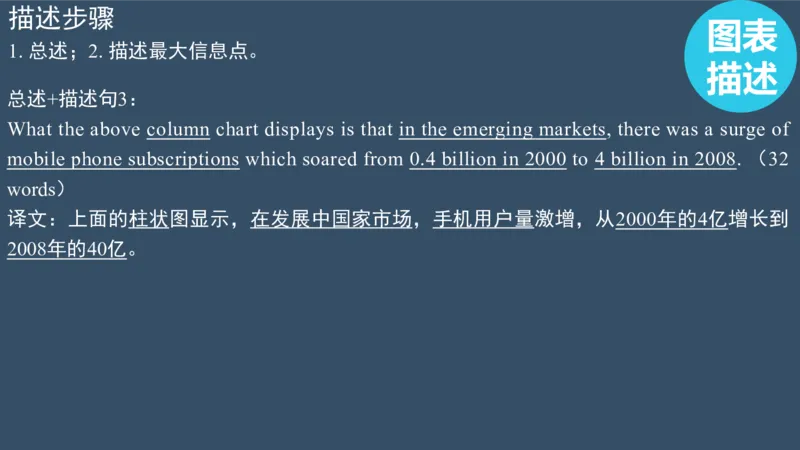
1. 总述;2. 描述最大信息点。
描述
总述+描述句3:
What the above column chart displays is that in the emerging markets, there was a surge of
mobile phone subscriptions which soared from 0.4 billion in 2000 to 4 billion in 2008. (32
words)
译文:上面的柱状图显示,在发展中国家市场,手机用户量激增,从2000年的4亿增长到
2008年的40亿。描述步骤
图表
静态图描述
描述
若静态图的图表表述的是过去的信息,描述图表时则用一般过去时;
如果图表的标题中没有过去的时间点,更倾向于是一种常态化和规律性的信息,最贴切的
时态是一般现在时,但是用一般过去时也可以。描述步骤
图表
静态图总述句1:
描述
The pie chart clearly reflects/reveals the percentages of the residents' spending
during the Spring Festival Vacation in a certain city in China.
译文:这个饼状图清楚地反映了我国某市居民春节假期期间的花销比例。
静态图总述句2:
What the above pie chart displays is the result of a survey in which residents in a specific Chinese
city were asked about their distribution of Spring Festival's spending.
译文:上面的饼状图显示的是一项关于某市居民春节假期花销比例的调查结果。描述步骤
图表
静态图数据描述句1:
描述
The percentage of the spending on New Year presents during the Spring Festival is
the highest among the four categories, at 40%; while the figure for transportation,
gathering and other parts is 20% each.
译文:春节期间的礼物消费在四类消费中所占比例最高,为40%;而交通、聚
会以及其他等费用各占20%。
静态图数据描述句2:
The percentage of the students travelling for appreciating the scenery is 37%, and 33% of the
students in the university aim to release pressure by taking a trip.
译文:为了欣赏风景而去旅游的学生占了37%,而33%的学生是为了缓解压力而去旅游的。

