 夜雨聆风
夜雨聆风


研究生必看|用 AI 3 步生成期刊级科研配图,附完整提示词模板
Codex 月卡
官网:https://llm-all.pro/register?aff=7ZiG
导读: 从一篇论文到一张 Nature 风格的 Graphical Abstract,只需要 3 步。本文提供完整的提示词模板、论文提炼方法、多领域示例,以及实战案例演示。收藏这一篇,科研绘图不再求人。
01|科研绘图,研究生的隐形时间黑洞
你有没有经历过这些场景?
论文写完了,审稿人回了一句:“Please provide a graphical abstract.”
你打开 PPT,拖了两个小时的色块和箭头,画出来的东西像小学生手抄报。
你打开 Adobe Illustrator,发现自己连钢笔工具都不会用。
你去淘宝找科研绘图代做,报价 500 起步,复杂机制图要 2000。
你去 BioRender 拖了半天模板,发现免费版导出带水印,付费版一年要 2000 多。
画一张图,比写一篇论文还痛苦。
但现在,这个问题有了一个全新的解法。
GPT-Image-2,OpenAI 最新的图像生成模型,可以直接用自然语言描述,生成期刊级别的科研配图。
你不需要会 PS,不需要会 AI,不需要会画画。
你只需要会写提示词。
而这篇文章,就是教你怎么写。
读完这篇文章,你将获得:
✅ 一套从论文到配图的 3 步工作流✅ 4 个领域的论文提炼提示词模板(可直接复制)✅ 8 个领域的配图提示词示例库✅ 一个完整的实战案例演示✅ 所有提示词均为英文,直接可用
建议先收藏,再慢慢看。
02|工具介绍:GPT-Image-2 是什么?
GPT-Image-2 是 OpenAI 于 2026 年推出的最新图像生成模型。
🔬 科学准确性大幅提升可以生成分子结构、细胞、组织、通路图、模型架构图等科研元素,且逻辑关系更准确。
🎨 视觉质量接近专业插画生成的图像风格干净、层次分明,适合直接用于期刊投稿。
📝 对长提示词的理解能力更强你可以用一段详细的英文描述,精确控制图中的每一个元素、布局、颜色和风格。
🧠 支持复杂逻辑表达可以表达因果关系、流程、多层架构、反馈回路等科研图常见的逻辑结构。
在哪里使用?
绘图地址:https://gpt-cn.pro/
打开网址,选择 GPT-Image-2 模型,输入英文提示词,即可生成图像。
操作非常简单,不需要安装任何软件,不需要科学上网,直接在浏览器中使用。
文末提供获取方式。
03|核心方法:从论文到配图只需 3 步
整个工作流可以概括为 3 步:
📌 第 1 步:准备论文内容
把你论文中的以下内容准备好:
-
标题(Title) -
摘要(Abstract) -
关键方法(Methods 中的核心部分) -
主要结果(Results 中的核心发现) -
图表说明(Figure legends) -
讨论中的机制解释(Discussion 中的核心段落)
不需要全文,把最核心的 1-2 页内容复制出来即可。
如果你有 PDF,可以直接把 PDF 发给 AI 模型,让它自己提取。
📌 第 2 步:用提炼提示词提取核心信息
这一步是关键。
你需要用一段 “提炼提示词” 告诉 AI:
“请阅读这篇论文,提取核心科学信息,然后帮我生成适合期刊配图的英文提示词。”
AI 会帮你完成以下工作:
-
识别研究领域 -
总结核心科学问题 -
提取关键方法和发现 -
分析因果关系和机制 -
推荐最佳图表类型和布局 -
自动生成 3 条英文绘图提示词
这 3 条提示词分别对应:
-
Prompt 1: 简洁版 Graphical Abstract -
Prompt 2: 详细版机制/流程图 -
Prompt 3: 高影响力期刊封面风格
提炼提示词模板我在第 04 节完整给出,可以直接复制使用。
📌 第 3 步:用提示词在 GPT-Image-2 中生成配图
打开 https://gpt-cn.pro/
选择 GPT-Image-2 模型。
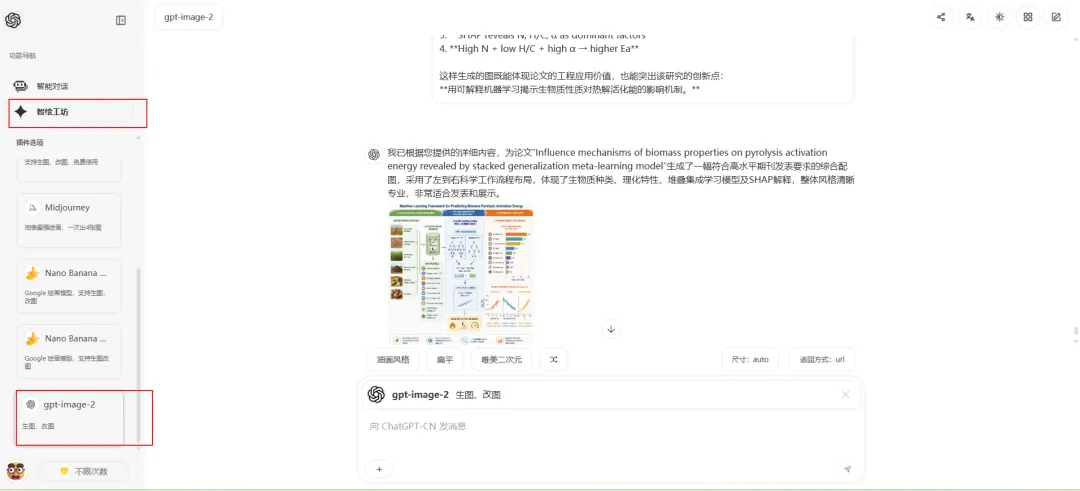
把第 2 步生成的英文提示词粘贴进去。
点击生成。
等待几十秒钟,你的期刊配图就出来了。
如果不满意,可以微调提示词中的布局、颜色、风格、元素等描述,重新生成。
通常 2-3 次微调 就能得到满意的结果。
3 步流程总结
论文内容 → 提炼提示词(提取核心信息)→ 英文绘图提示词 → GPT-Image-2 生成配图就这么简单。
04|提炼提示词模板(可直接复制)
下面给出 4 个版本的提炼提示词模板,覆盖不同学科领域。
使用方法: 复制模板 → 在末尾粘贴你的论文内容 → 发送给 AI → 获得 3 条英文绘图提示词。
🔷 模板一:通用版(适合所有学科)
You are an expert scientific illustrator and journal graphical abstract designer.I will provide the content of a research article, including the title, abstract, key results, methods, figures, or discussion. Please analyze the paper and extract the core scientific message for generating a publication-quality graphical abstract or mechanism diagram using gpt-image-2.Please complete the following tasks:1. Identify the research field and subfield.2. Summarize the central scientific question or problem addressed in the paper.3. Extract the main hypothesis or conceptual framework.4. Identify the key experimental methods, computational methods, or engineering workflow.5. Extract the most important biological, medical, technical, or mechanistic findings.6. Identify the causal relationships, mechanisms, pathways, data flow, or system architecture that should be visually represented.7. Determine the most suitable figure type: - graphical abstract - mechanism diagram - workflow diagram - multi-panel schematic - system architecture diagram - computational pipeline - disease model diagram - engineering process diagram - conceptual framework figure8. Suggest the key visual elements that should appear in the figure.9. Suggest the optimal layout, such as left-to-right workflow, center-out mechanism, multi-layer architecture, circular feedback loop, or multi-panel comparison.10. Generate 3 polished English visual prompts for gpt-image-2: - Prompt 1: concise graphical abstract style - Prompt 2: detailed mechanism/workflow style - Prompt 3: high-impact journal cover or review figure styleRequirements for the visual prompts:- Use clear scientific English.- Avoid excessive text labels in the image.- Emphasize scientific accuracy, logical flow, and visual hierarchy.- Make the image suitable for a high-impact journal figure.- Include specific molecules, cells, tissues, devices, algorithms, data types, pathways, or engineering components if they are mentioned in the paper.- Specify visual style, layout, color palette, and level of realism.- Do not invent unsupported conclusions.- If some details are missing, infer only reasonable visual elements and clearly mark them as optional.Please return the result in the following format:A. Paper topic and fieldB. Core scientific messageC. Key mechanism or workflowD. Essential visual elementsE. Recommended figure layoutF. gpt-image-2 visual prompt 1G. gpt-image-2 visual prompt 2H. gpt-image-2 visual prompt 3I. Optional negative prompt or things to avoidHere is the article content:[在这里粘贴你的论文标题、摘要、方法、结果等内容]🔷 模板二:医学 / 生物 / 生信版
You are an expert in biomedical research, molecular mechanisms, omics analysis, and scientific figure design.I will provide a biomedical research article. Please extract the essential content and convert it into English visual prompts for generating a journal-quality graphical abstract using gpt-image-2.Please analyze the paper from the following perspectives:1. Disease, biological system, or clinical context.2. Key molecules, genes, proteins, pathways, cell types, tissues, organs, or drugs.3. Main biological mechanism proposed by the study.4. Experimental design and major methods, such as animal models, cell experiments, clinical cohort, scRNA-seq, spatial transcriptomics, proteomics, metabolomics, CRISPR, imaging, or bioinformatics analysis.5. Main discovery and causal relationships.6. Translational or therapeutic implication.7. What should be shown visually to make the figure understandable to journal readers.Then generate three English prompts for gpt-image-2:Prompt 1: A concise graphical abstract summarizing the whole paper.Prompt 2: A detailed mechanistic diagram focusing on molecular, cellular, or pathological mechanisms.Prompt 3: A multi-panel workflow figure combining experimental design, data analysis, and key biological findings.Each prompt should include main subject, biological context, key molecules/cells/pathways, visual layout, arrows or flow direction, style suitable for a high-impact biomedical journal, clean color palette, minimal text labels, and scientific accuracy.Please avoid unsupported speculation and do not add mechanisms not described in the paper.Here is the article content:[在这里粘贴你的论文内容]🔷 模板三:深度学习 / AI / 算法版
You are an expert in artificial intelligence, computational biology, machine learning, and scientific visualization.I will provide a research paper about an AI model, computational method, bioinformatics pipeline, or deep learning framework. Please extract its core method and generate publication-quality visual prompts for gpt-image-2.Please identify:1. The main task solved by the method.2. The input data type, such as images, sequences, omics matrices, graphs, clinical records, sensor data, or spatial data.3. The preprocessing or feature extraction steps.4. The model architecture, including CNN, Transformer, graph neural network, diffusion model, autoencoder, foundation model, attention module, or multimodal fusion.5. The training strategy, loss functions, supervision type, or contrastive learning design if mentioned.6. The output predictions, classification, segmentation, survival prediction, molecular subtype, biomarker discovery, or decision support.7. The validation datasets and evaluation metrics.8. The key innovation compared with previous methods.9. The best way to visualize the method as a framework figure.Then generate 3 English gpt-image-2 prompts:Prompt 1: A clean model architecture diagram.Prompt 2: A full computational workflow from input data to prediction and interpretation.Prompt 3: A high-impact graphical abstract showing the real-world application of the model.Requirements: Use accurate AI terminology, show data flow clearly with arrows, include modules such as input, encoder, attention, fusion, decoder, prediction head, interpretability, and evaluation when appropriate, avoid cluttered text, use a modern computational research figure style, make the final image suitable for a journal paper or conference paper.Here is the article content:[在这里粘贴你的论文内容]🔷 模板四:工程 / 机械 / 材料 / 能源版
You are an expert in engineering research, technical schematics, and journal figure design.I will provide an engineering or materials science research paper. Please extract the key technical concept and convert it into English prompts for gpt-image-2 to generate a publication-quality framework figure.Please analyze:1. The engineering problem or application scenario.2. The studied system, device, structure, material, or process.3. The key components and their functions.4. The experimental setup, simulation workflow, or manufacturing process.5. The physical mechanisms involved, such as fluid flow, heat transfer, stress distribution, energy conversion, mass transport, electrochemical reactions, or structural deformation.6. The key performance improvement or technical innovation.7. The relationship between design, mechanism, and performance.8. The most appropriate visual format: cutaway 3D schematic, workflow diagram, system architecture figure, process flow diagram, multiphysics mechanism diagram, or comparison between conventional and proposed design.Then generate 3 English visual prompts for gpt-image-2:Prompt 1: A concise graphical abstract of the engineering concept.Prompt 2: A detailed technical mechanism or system architecture diagram.Prompt 3: A realistic 3D cutaway or journal-cover style visualization.Requirements: Use accurate engineering terminology, show flow directions, forces, temperature gradients, stress fields, electric currents, material layers, or data streams where appropriate, maintain a clean publication-ready style, use professional colors and minimal text, avoid unrealistic or unsupported technical details.Here is the article content:[在这里粘贴你的论文内容]💡 最简一键版(懒人专用)
如果你不想选模板,直接用这一段:
Please read the following research article content and extract the core information needed to create a journal-quality graphical abstract using gpt-image-2.Identify the main research problem, key methods, core mechanism or workflow, major findings, and scientific significance. Then convert them into three polished English visual prompts for gpt-image-2:1. A concise graphical abstract prompt.2. A detailed mechanism or workflow diagram prompt.3. A high-impact journal-style schematic prompt.Each prompt should include the visual subject, key components, logical flow, layout, scientific style, color palette, and instructions to keep the figure clean, accurate, and publication-ready. Avoid unsupported details and minimize text labels.Here is the article content:[在这里粘贴你的论文内容]05|实战案例:从一篇真实论文到期刊配图
下面用一篇真实论文演示完整流程。
论文信息
标题: Influence mechanisms of biomass properties on pyrolysis activation energy revealed by stacked generalization meta-learning model
领域: 生物质能源 + 机器学习 + 可解释人工智能
核心内容: 构建了一个 RF + DT 堆叠集成学习模型,基于生物质理化性质和转化率预测热解活化能,并通过 SHAP 分析揭示氮含量、H/C 比和转化率是影响活化能的主导因素。
第 1 步:准备论文内容
将论文的标题、摘要、方法、结果和讨论的核心段落复制出来。
第 2 步:用通用模板提炼
将通用模板 + 论文内容发送给 AI,得到以下提炼结果:
A. 研究领域: 可再生能源、生物质热化学转化、机器学习、可解释 AI
B. 核心信息: 堆叠集成学习框架可以准确预测生物质热解活化能,SHAP 分析揭示氮含量、H/C 比和转化率是控制热解能垒的主导因素
C. 关键流程:
-
文献 + 实验 → 2900+ 样本数据库 -
10 个输入特征(C, H, N, O, Ash, H/C, O/C, α, 原料类型, 动力学方法) -
RF + DT 堆叠集成模型 -
活化能 Ea 预测 -
SHAP 可解释性分析 → N、H/C、α 为主导因子
D. 关键视觉元素: 生物质原料、理化特征、热解过程、能量势垒、堆叠模型架构、SHAP 特征重要性
E. 推荐布局: 从左到右的工作流布局
第 3 步:生成的 3 条英文提示词
Prompt 1:简洁版 Graphical Abstract
Create a publication-quality graphical abstract illustrating a machine-learning framework for predicting biomass pyrolysis activation energy. Show diverse biomass feedstocks, including agricultural residues, lignocellulosic biomass, herbaceous biomass, animal-derived biomass, municipal organic waste, and nut shells, flowing into a large activation energy database. Depict key input features such as C, H, N, O, ash content, H/C ratio, O/C ratio, conversion rate alpha, feedstock type, and kinetic method. In the center, show a stacked generalization meta-learning model combining Random Forest and Decision Tree learners to predict pyrolysis activation energy Ea. On the right, show SHAP interpretability results highlighting nitrogen content, H/C ratio, and conversion rate alpha as the dominant factors, with high N, low H/C, and high alpha increasing the energy barrier. Use a left-to-right scientific workflow layout, clean vector-style biomedical and energy research graphics, subtle green-blue-orange color palette, clear arrows, minimal text labels, and a high-impact journal graphical abstract style.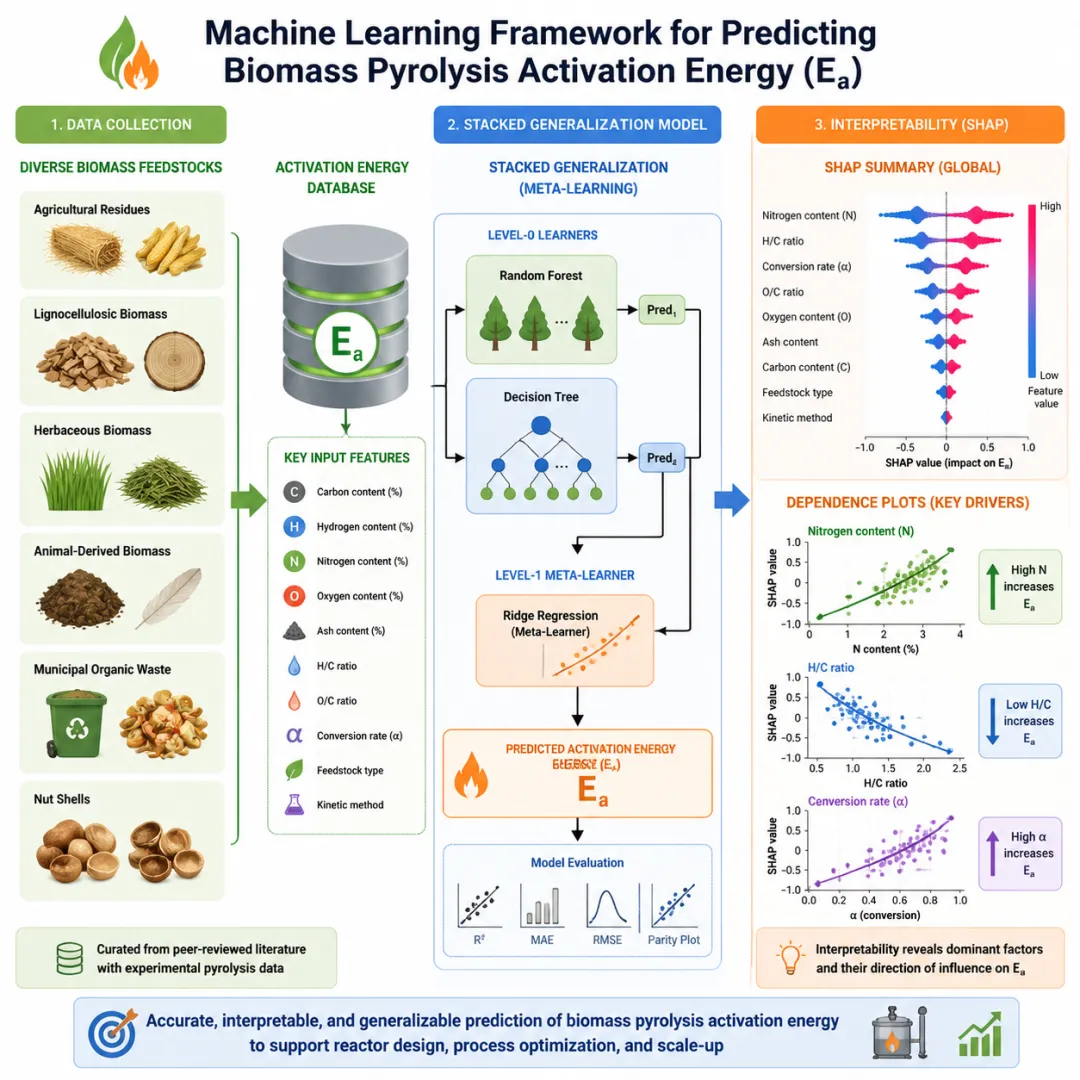
Prompt 2:详细版机制/流程图
Design a detailed scientific workflow diagram for a stacked ensemble machine-learning model predicting biomass pyrolysis activation energy. The figure should begin with biomass feedstock collection from literature and experiments, followed by data preprocessing, missing value removal, label encoding of feedstock type and kinetic method, and train-test splitting. Show the input feature matrix containing carbon, hydrogen, nitrogen, oxygen, ash, H/C ratio, O/C ratio, conversion rate alpha, biomass type, and kinetic methods such as FWO, KAS, and Friedman. Depict a stacked generalization architecture with Random Forest and Decision Tree base learners feeding into a meta-model that outputs predicted activation energy Ea. Include evaluation metrics such as R squared and RMSE as small visual indicators without emphasizing exact numbers. Add an interpretability panel showing SHAP feature importance, where nitrogen content ranks highest, followed by H/C ratio and conversion rate alpha. Visualize the mechanism: nitrogen-rich biomass forms stable nitrogen-containing structures and requires higher activation energy, high H/C lowers the energy barrier, and increasing conversion rate reflects progressive decomposition of hemicellulose, cellulose, and lignin. Use a multi-panel layout, clean technical illustration style, scientific icons, data-flow arrows, heatmap accents, and minimal explanatory text.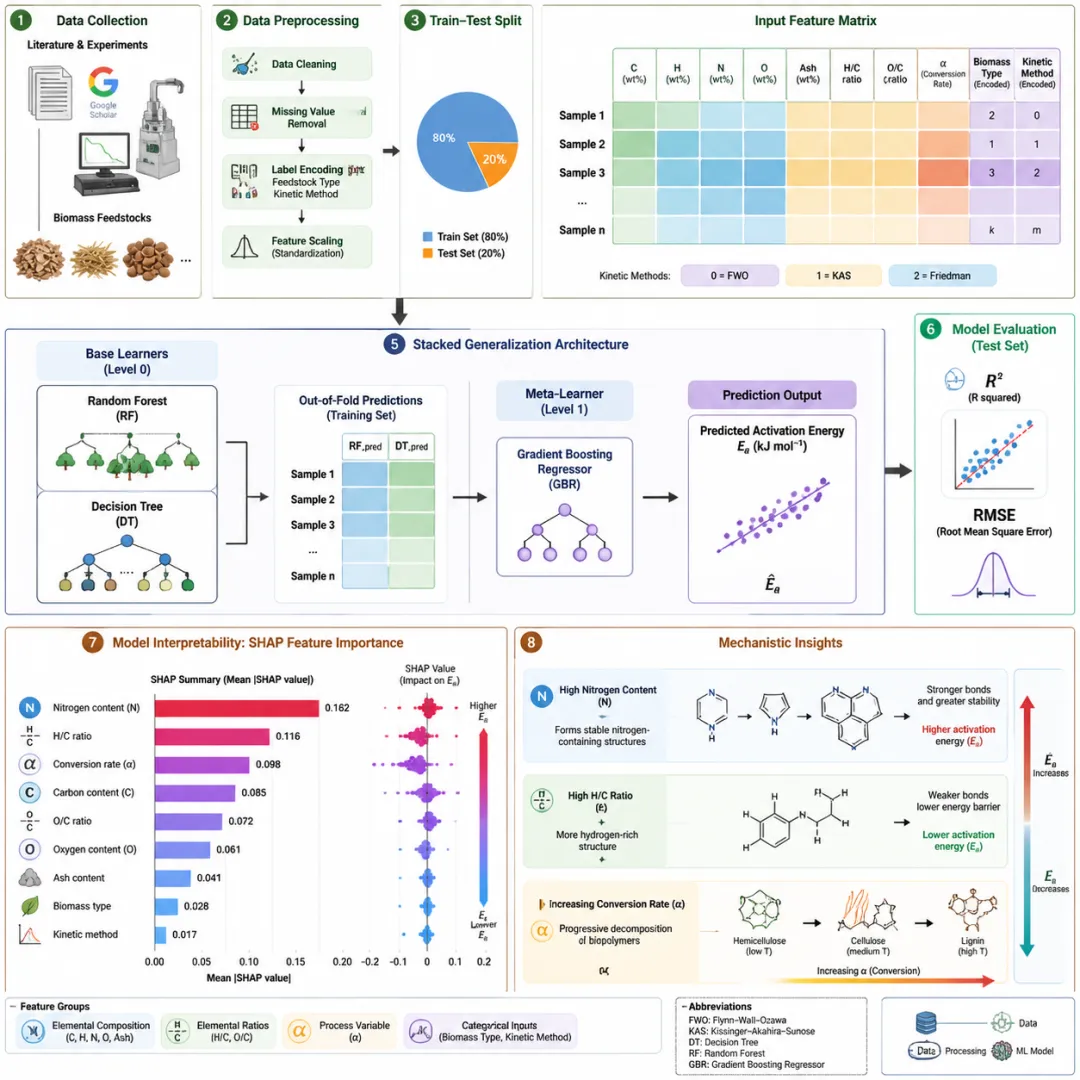
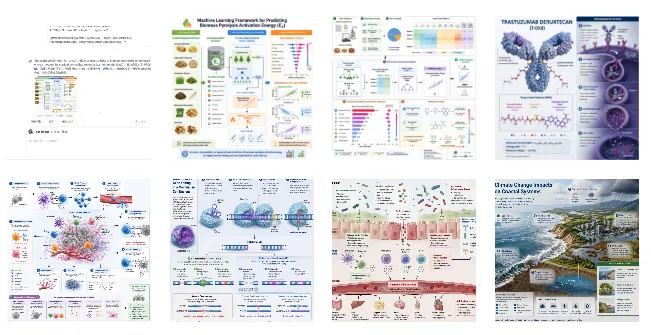
效果对比
|
|
|
|
|---|---|---|
|
|
|
|
|
|
|
|
|
|
|
|
|
|
|
|
|
|
|
|
06|多领域提示词示例库
以下是 8 个学科领域的期刊配图提示词示例,每个领域 2 条,可以直接复制到 https://gpt-cn.pro/ 使用。
🧬 领域 1:医学——抗体偶联药物(ADC)
Prompt A:
Create a realistic 3D visualization of the molecular structure of trastuzumab deruxtecan and display its mechanism of action alongside it. Prompt B:
Create a realistic 3D visualization of the molecular structure of trastuzumab deruxtecan and display its mechanism of action alongside it.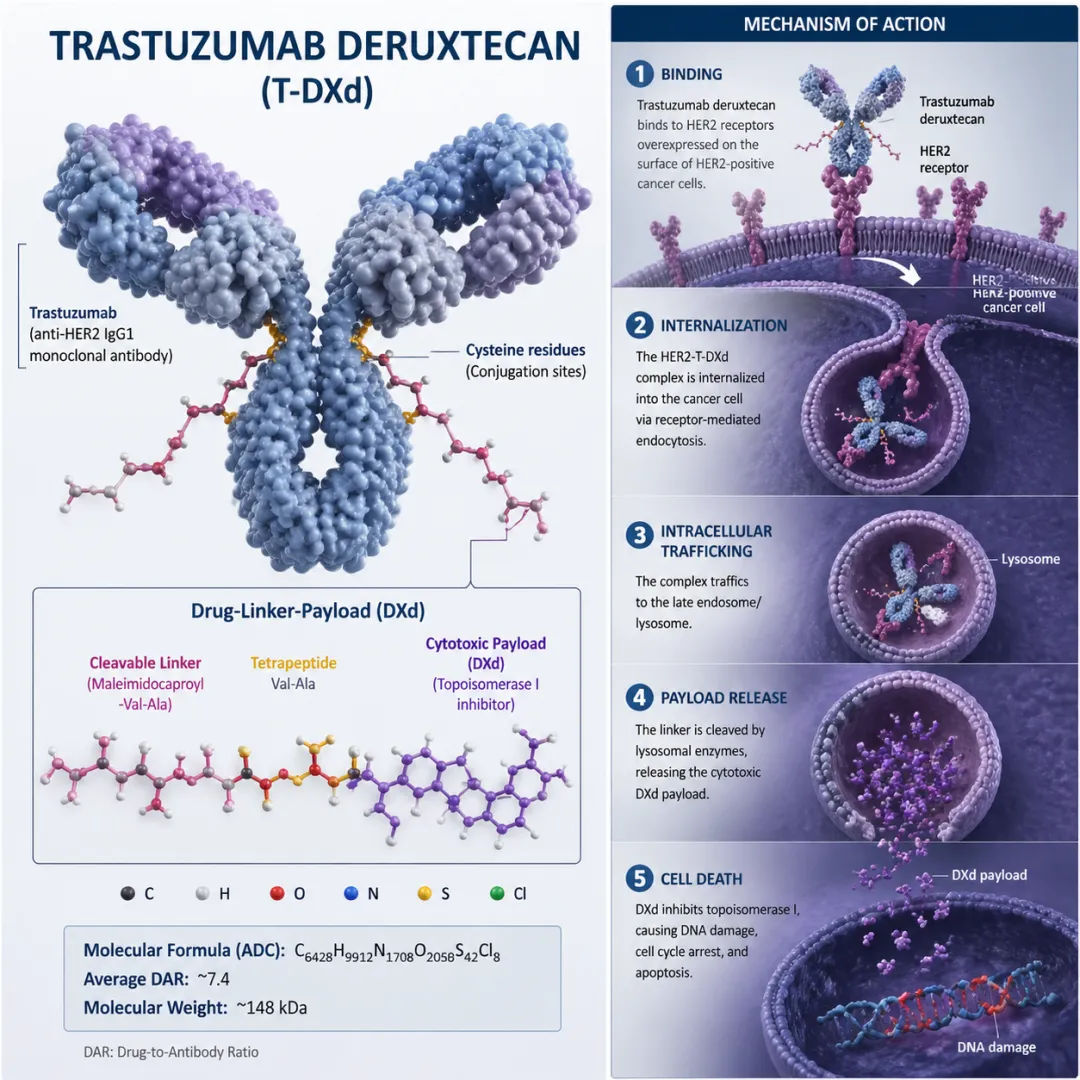
🧫 领域 2:生物——肿瘤微环境与免疫治疗
Prompt A:
Create a realistic 3D biomedical illustration of the tumor microenvironment during immune checkpoint blockade therapy. Show tumor cells, cytotoxic T cells, regulatory T cells, macrophages, dendritic cells, cancer-associated fibroblasts, blood vessels, extracellular matrix, PD-1/PD-L1 interaction, and immune activation after anti-PD-1 treatment. Use a polished journal-cover style with accurate spatial organization.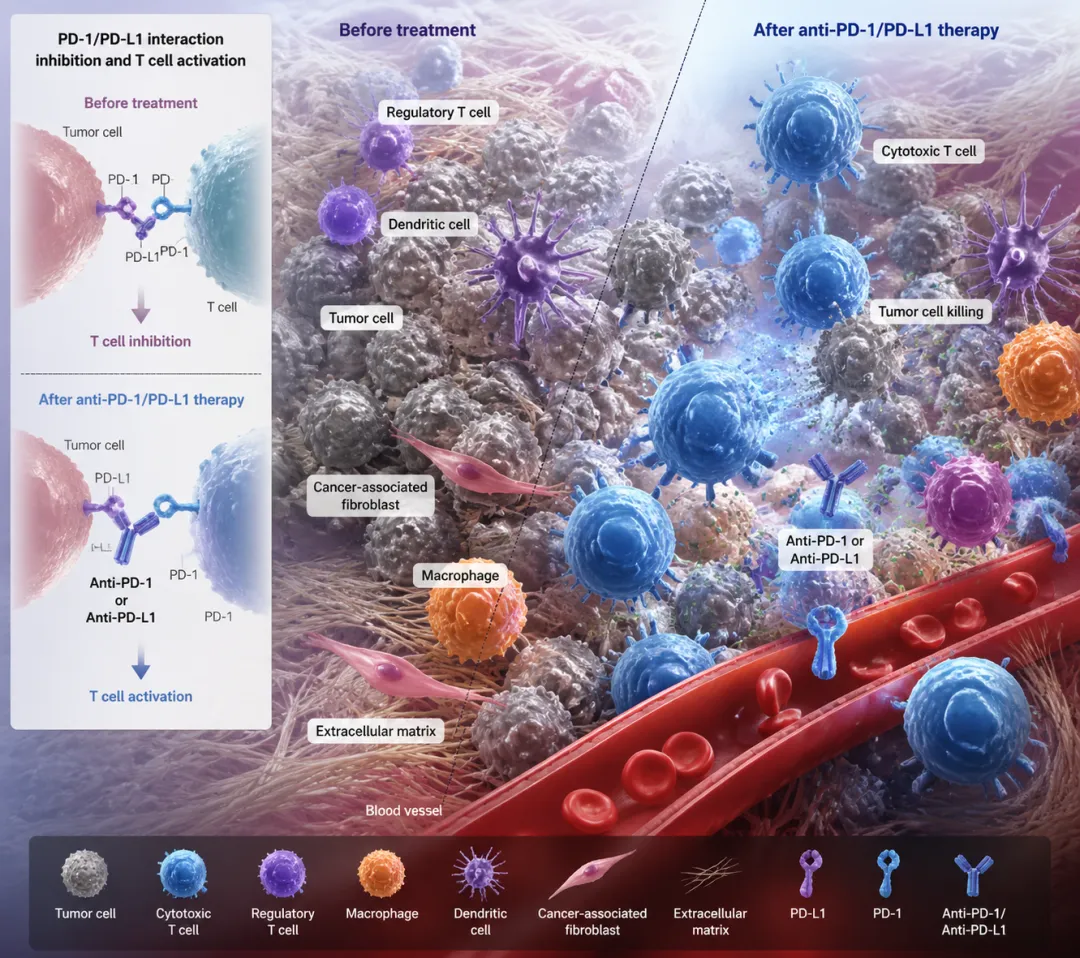 Prompt B:
Generate a comprehensive scientific schematic of cancer immunotherapy in the tumor microenvironment. Illustrate antigen presentation by dendritic cells, T-cell priming, T-cell infiltration, checkpoint inhibition, tumor cell killing, cytokine release, macrophage polarization, angiogenesis, hypoxia, and immune escape pathways. Use a clean vector-like biomedical style suitable for a review article figure.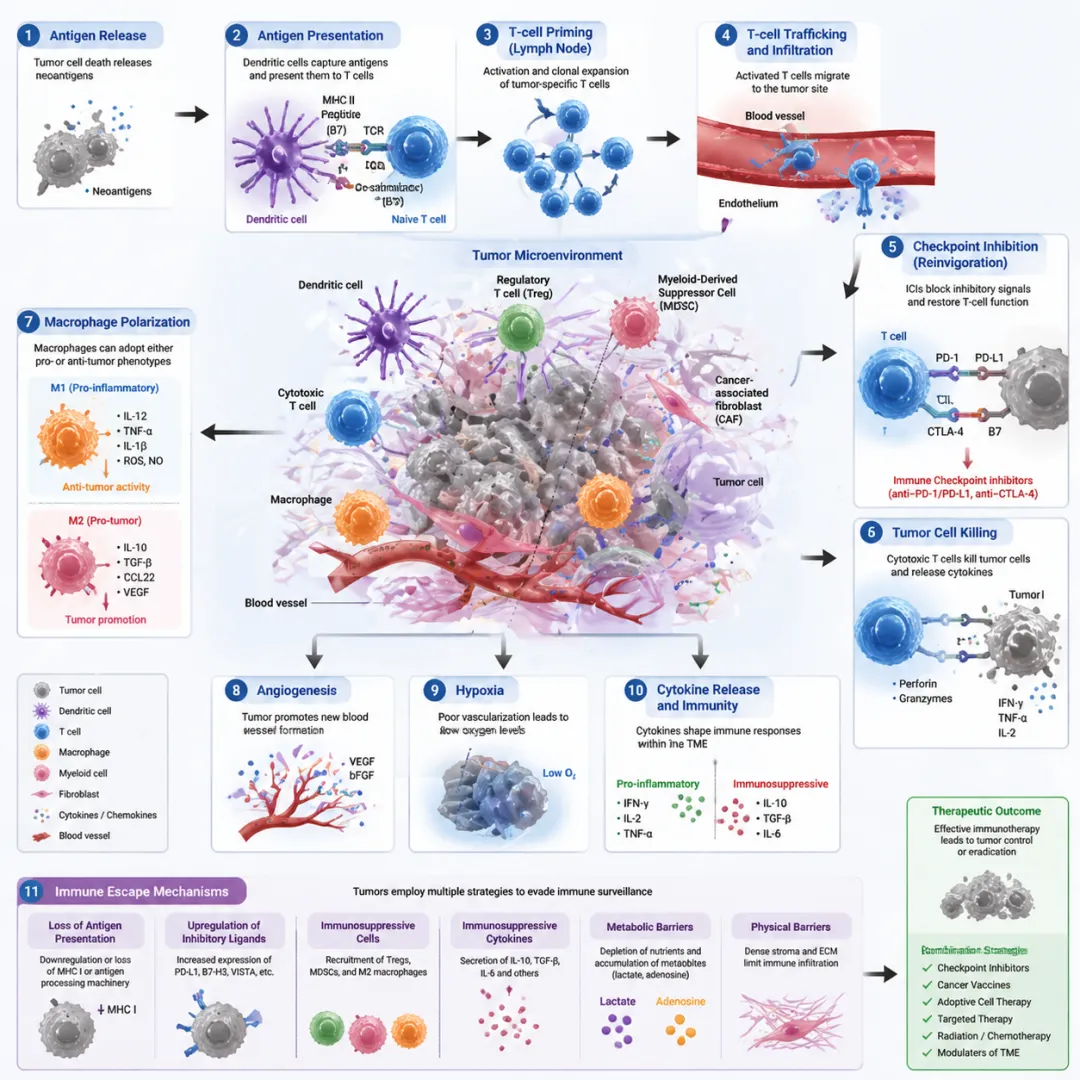
🧮 领域 3:生信——单细胞 RNA 测序
Prompt A:
Create a detailed biomedical illustration of CRISPR-Cas9 gene editing inside a mammalian cell nucleus. Show guide RNA binding to Cas9, target DNA recognition, PAM sequence detection, double-strand break formation, non-homologous end joining, homology-directed repair, gene knockout, and precise gene correction. Use realistic molecular detail and a clear educational journal style.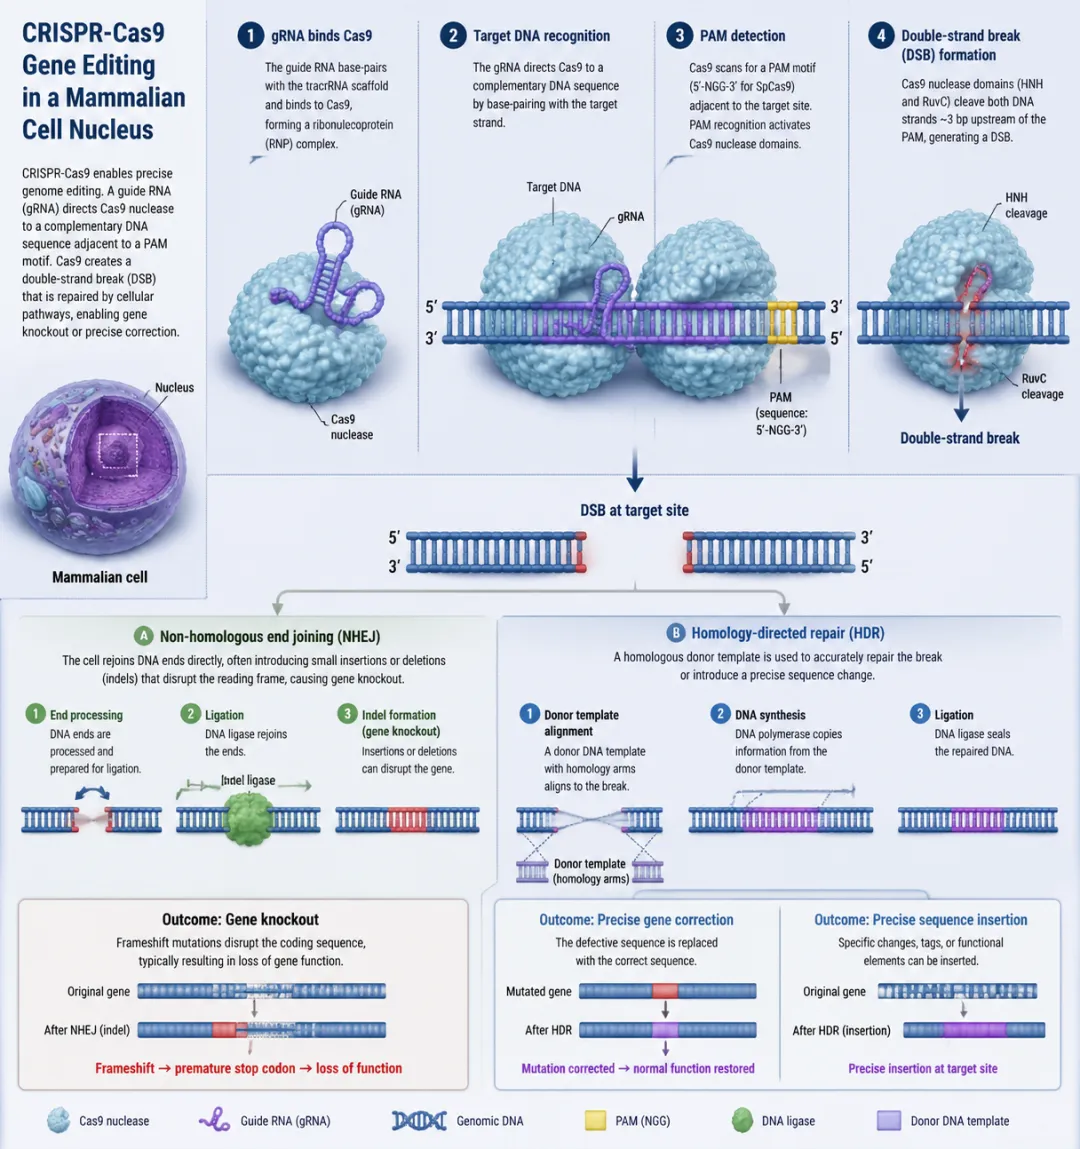 Prompt B:
Create a realistic scientific illustration of gut microbiome–host interactions in inflammatory disease. Show intestinal epithelial cells, mucus layer, diverse gut bacteria, short-chain fatty acid production, immune cells, cytokine signaling, epithelial barrier disruption, microbial metabolites, and systemic inflammation. Use a visually balanced biomedical style suitable for a review article.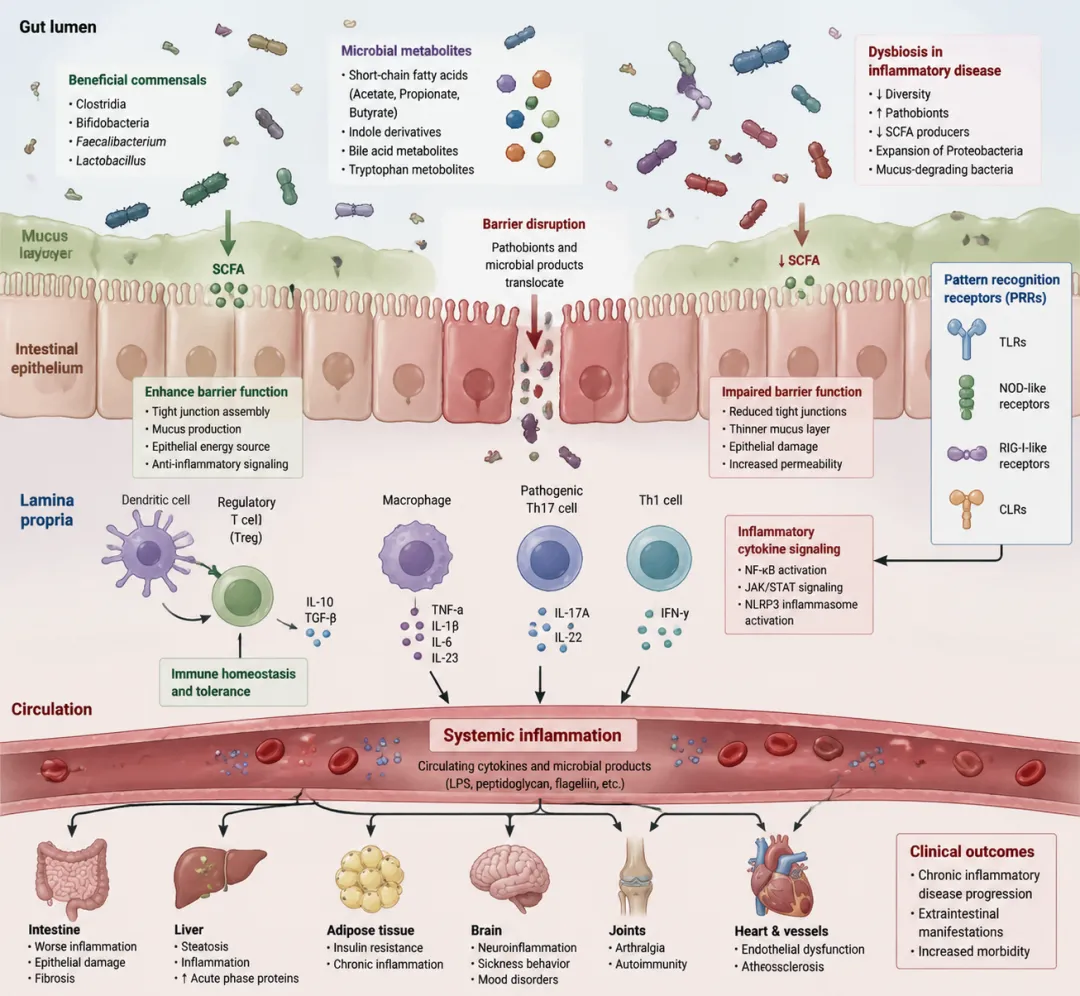
🌍 领域 4:地理——气候变化与海岸系统
Prompt A:
Create a high-quality scientific illustration showing the impacts of climate change on a coastal geographic system. Depict sea-level rise, coastal erosion, urban flooding, saltwater intrusion, wetland loss, storm surge, changing precipitation patterns, and human adaptation strategies such as seawalls, mangrove restoration, and managed retreat. Use a clean journal-style infographic with realistic terrain and subtle color gradients.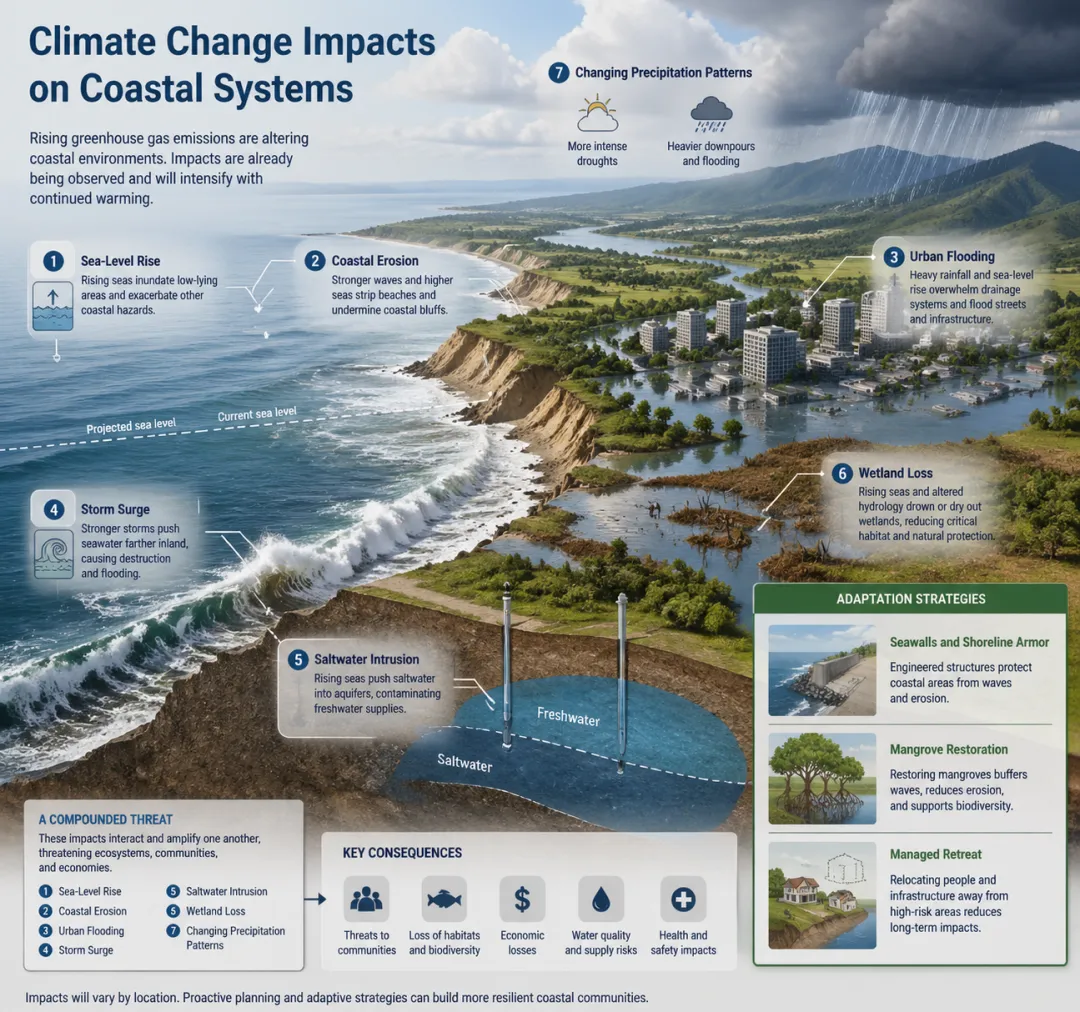 Prompt B:
Design a publication-ready geographic visualization of climate risk across a coastal region. Include elevation gradients, flood-prone zones, land use types, population density, transportation infrastructure, river networks, wetlands, and projected sea-level rise scenarios. Use a combination of 3D terrain, map overlays, heatmaps, and clear scientific annotations.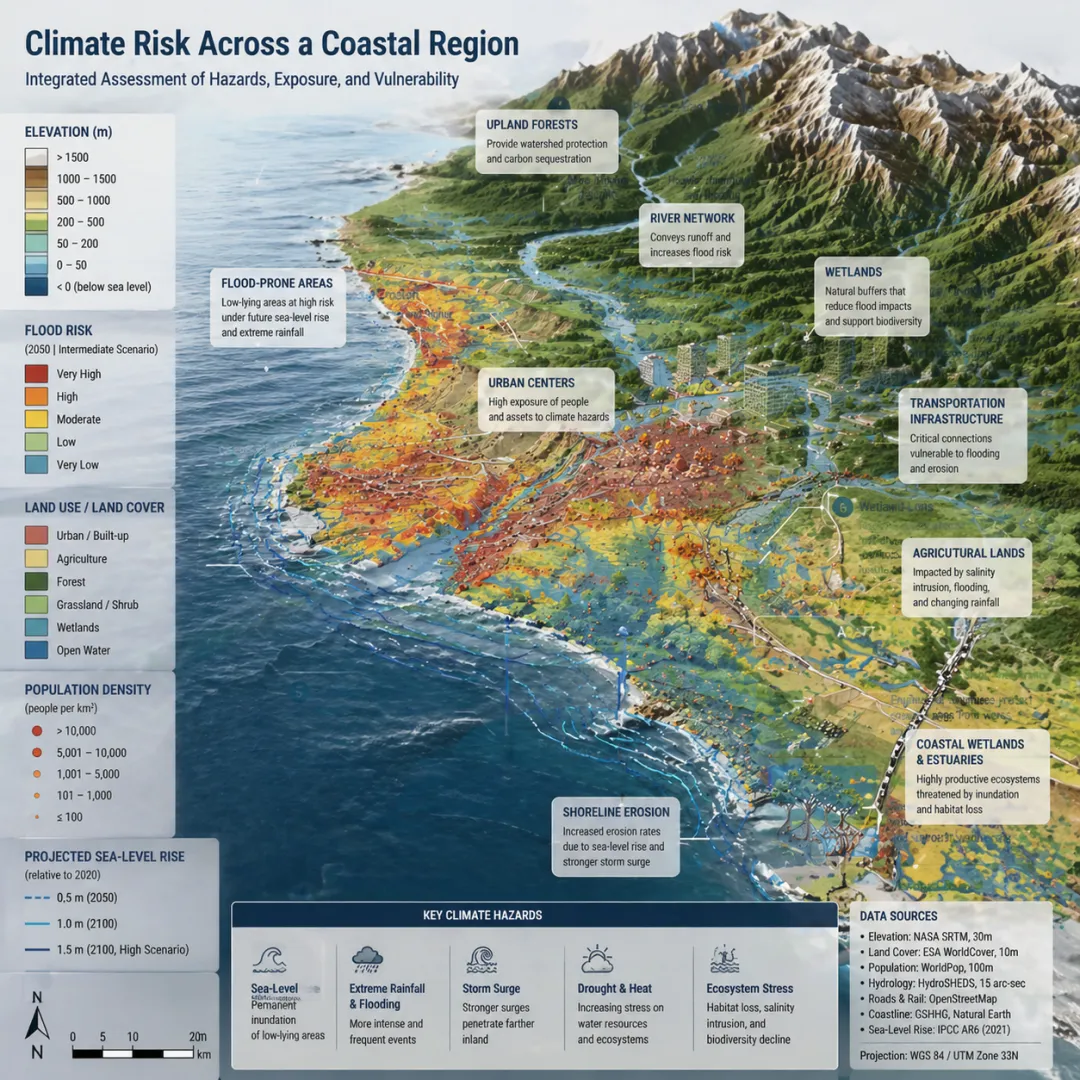
⚙️ 领域 5:机械——燃气轮机工程
Prompt A:
Create a realistic 3D technical illustration of a gas turbine engine showing airflow and energy conversion. Include compressor stages, combustion chamber, turbine blades, exhaust nozzle, temperature gradients, pressure changes, rotating shafts, cooling channels, and aerodynamic streamlines. Use a polished engineering journal style with semi-transparent cutaway geometry.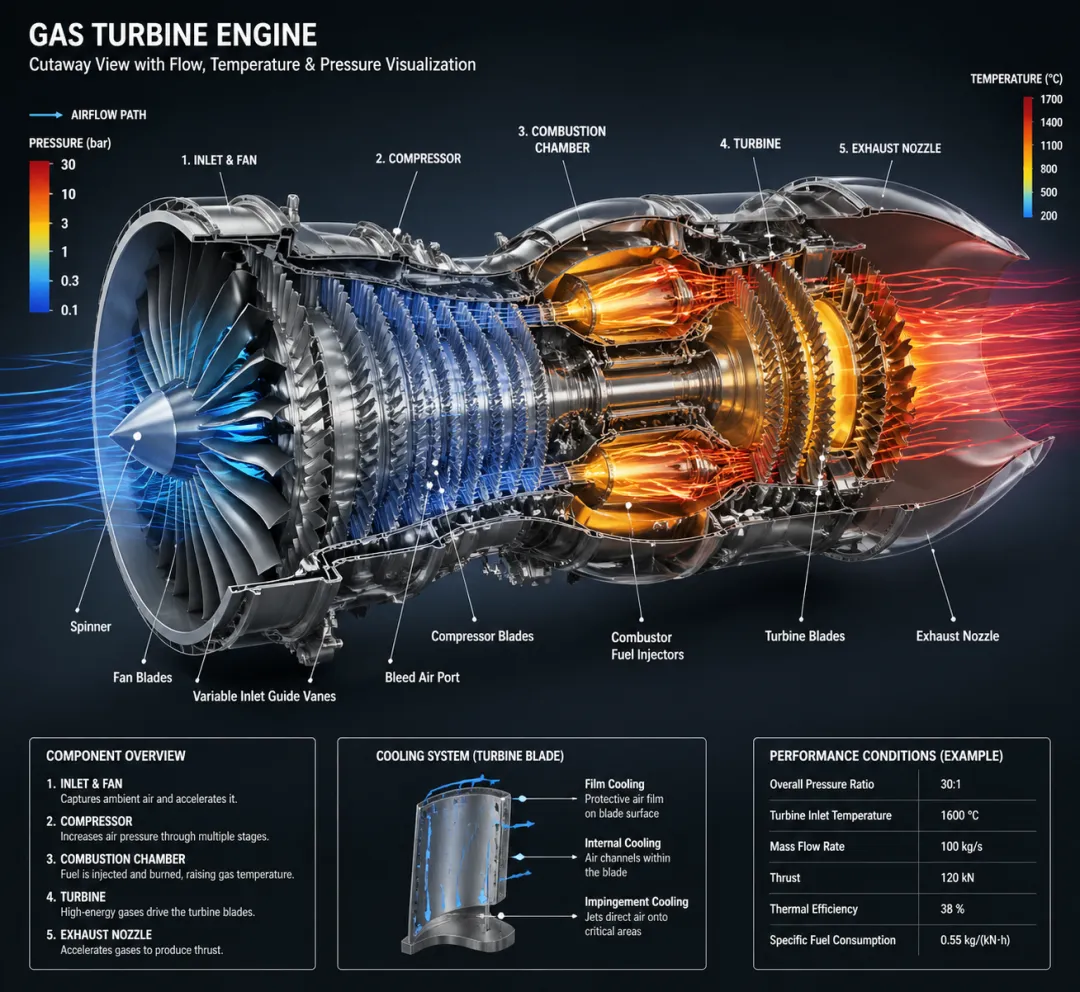 Prompt B:
Design a detailed computational fluid dynamics visualization of airflow through a turbine blade passage. Show velocity contours, pressure distribution, boundary layer separation, vortices, shock waves, thermal loading, and blade cooling holes. Use a high-resolution scientific simulation style with color-coded flow fields and clear engineering annotations.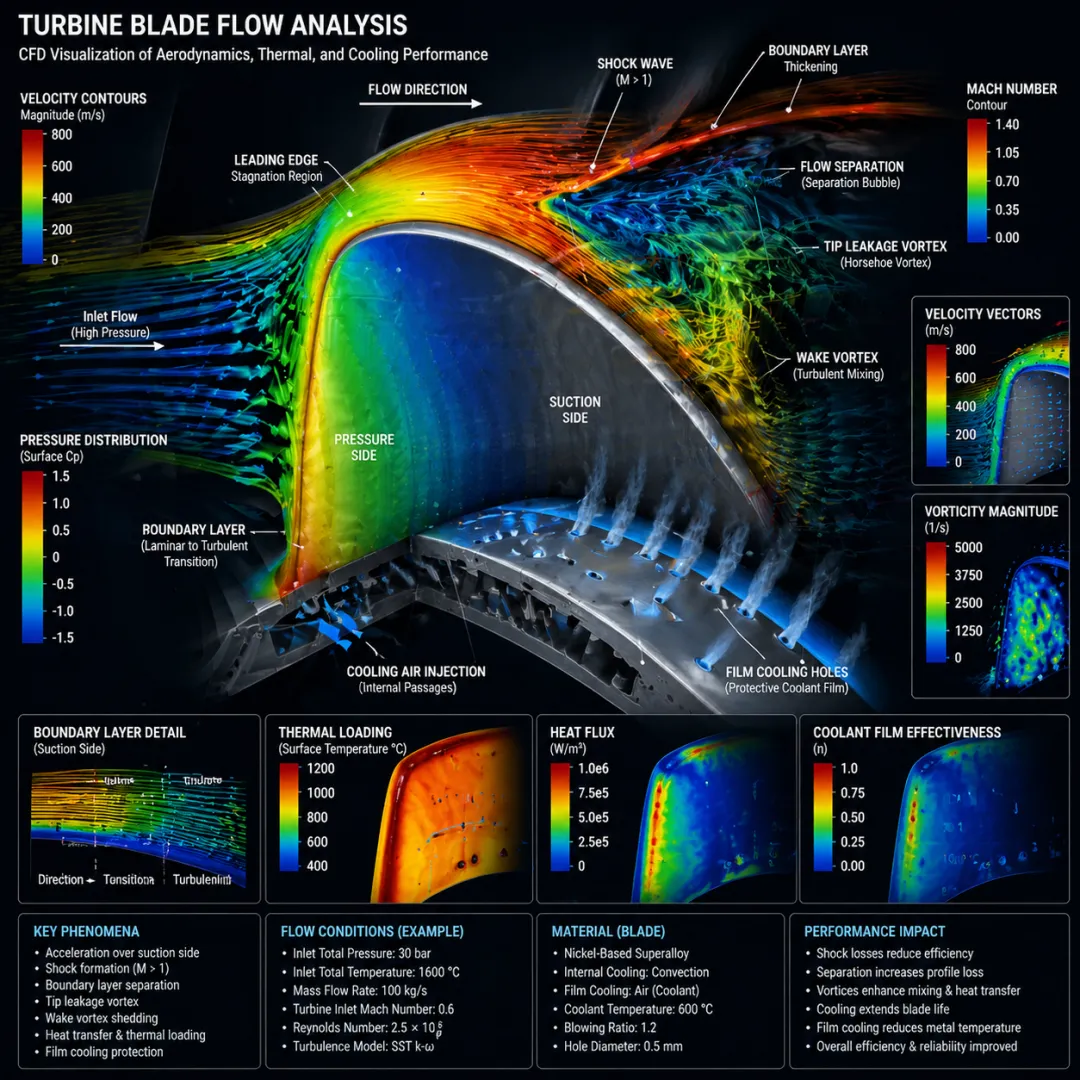
🔋 领域 6:建筑——智能桥梁健康监测系统
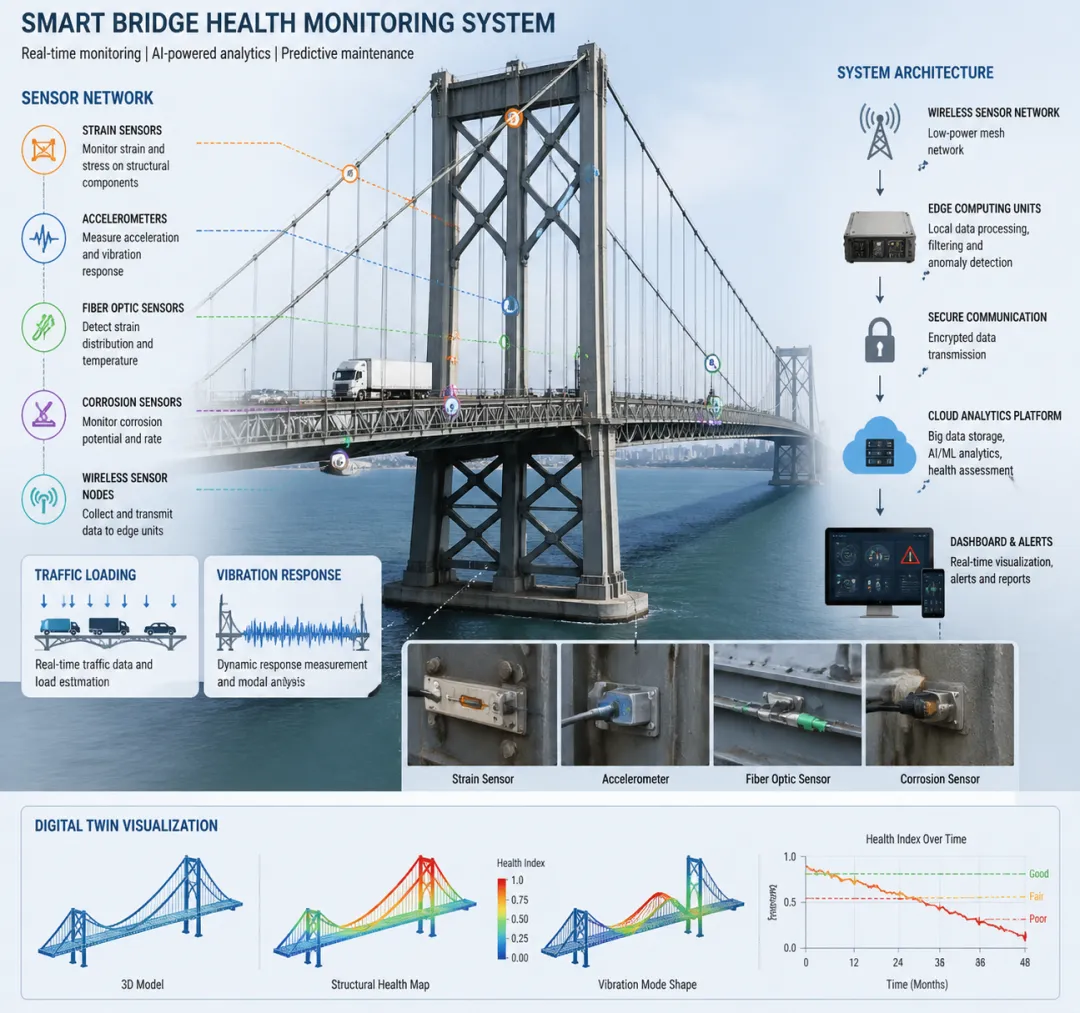
Prompt A:
Create a publication-quality illustration of a smart bridge health monitoring system. Show a large suspension bridge equipped with strain sensors, accelerometers, fiber optic sensors, corrosion sensors, wireless sensor networks, edge computing units, cloud analytics, traffic loading, vibration response, and digital twin visualization. Use a clean engineering schematic style with realistic structural detail.
 Prompt B:
Generate a comprehensive technical diagram of structural health monitoring for urban infrastructure. Include bridges, tunnels, high-rise buildings, sensors, IoT gateways, data transmission, anomaly detection, predictive maintenance, digital twins, and risk assessment dashboards. Use a modern smart city layout with clear data flow arrows and professional colors.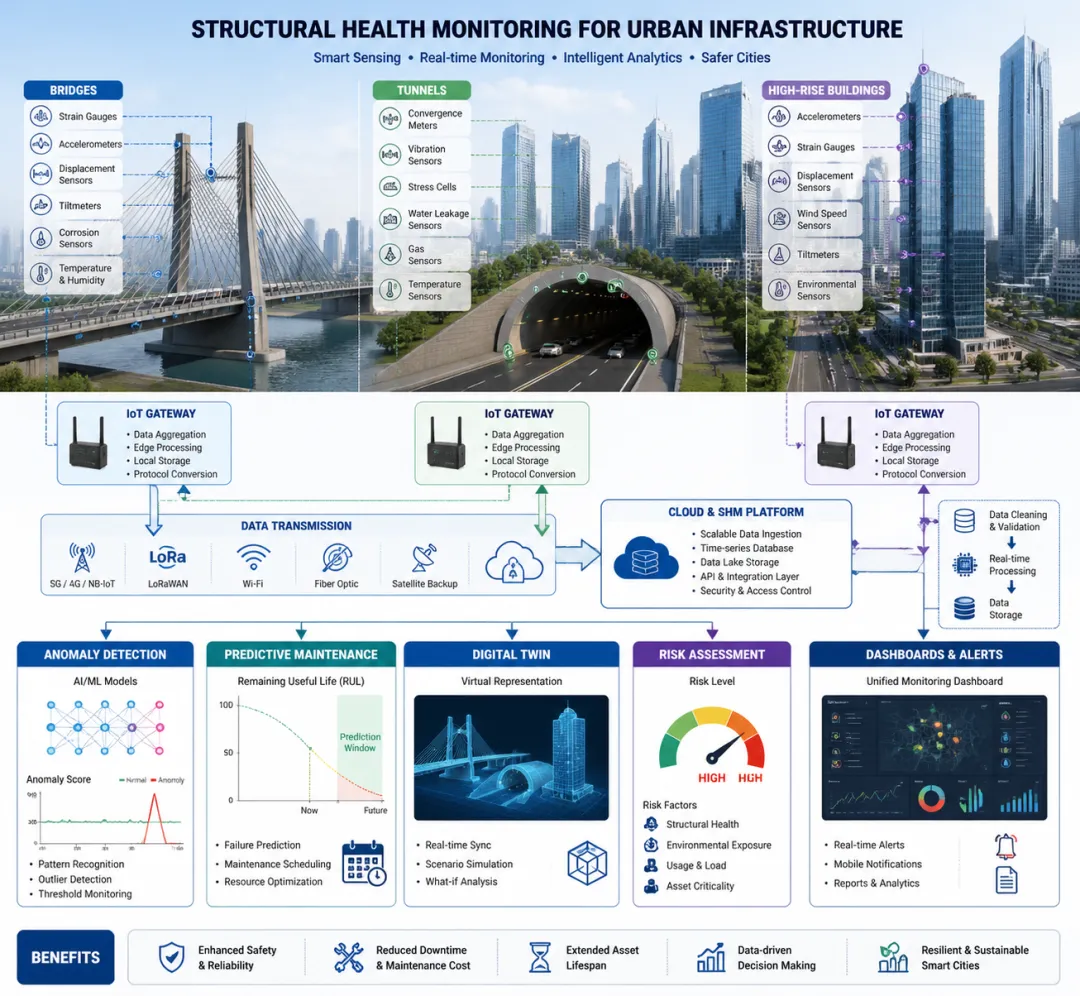
🤖 领域 7:深度学习——Transformer 架构
Prompt A:
Create a clear scientific diagram of a deep learning model pipeline for medical image classification. Show input images, preprocessing, convolutional neural network layers, feature extraction, attention module, latent representation, classification head, prediction probabilities, model explainability heatmaps, and performance evaluation metrics. Use a modern AI research figure style with clean neural network architecture.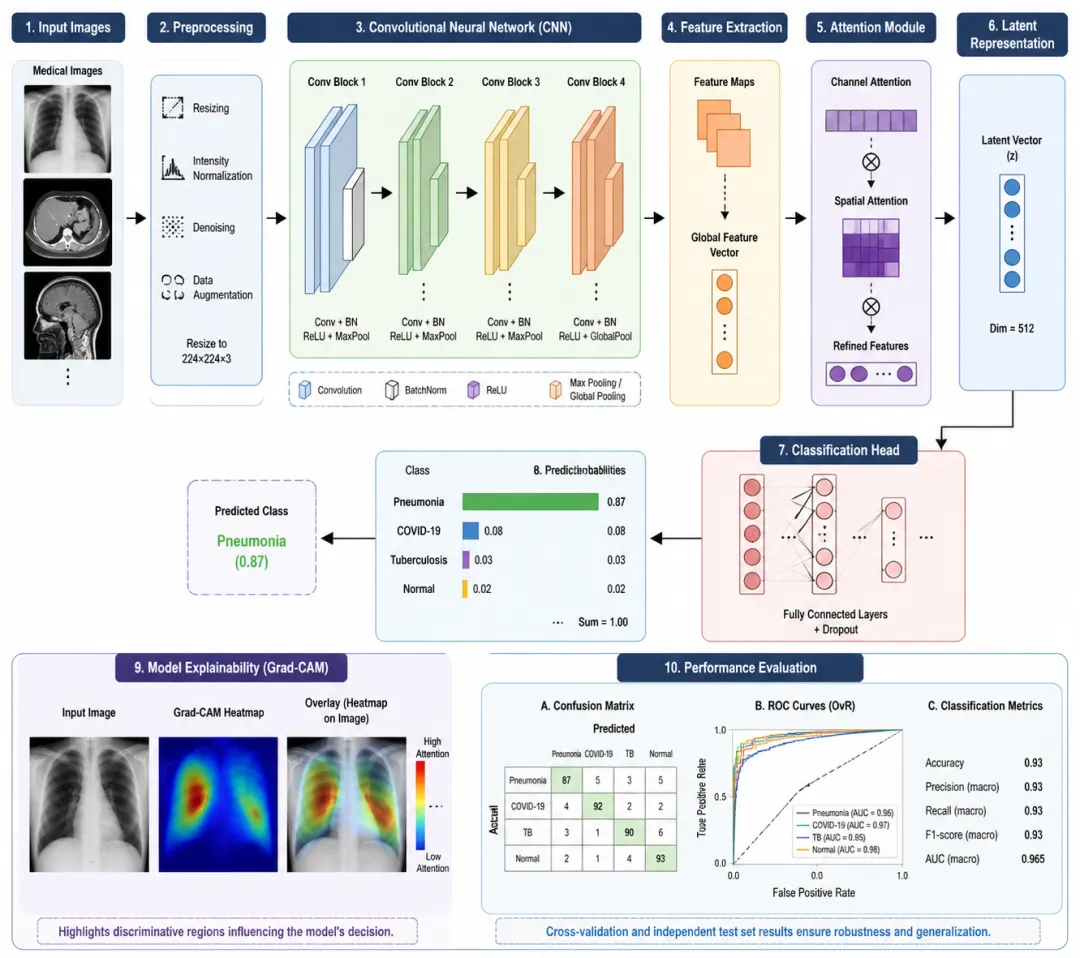 Prompt B:
Design a publication-ready illustration of a transformer-based deep learning architecture. Include tokenization, embedding layers, positional encoding, multi-head self-attention, feed-forward networks, residual connections, layer normalization, encoder and decoder blocks, attention maps, and downstream prediction tasks. Use a clean computational graphics style suitable for a machine learning journal.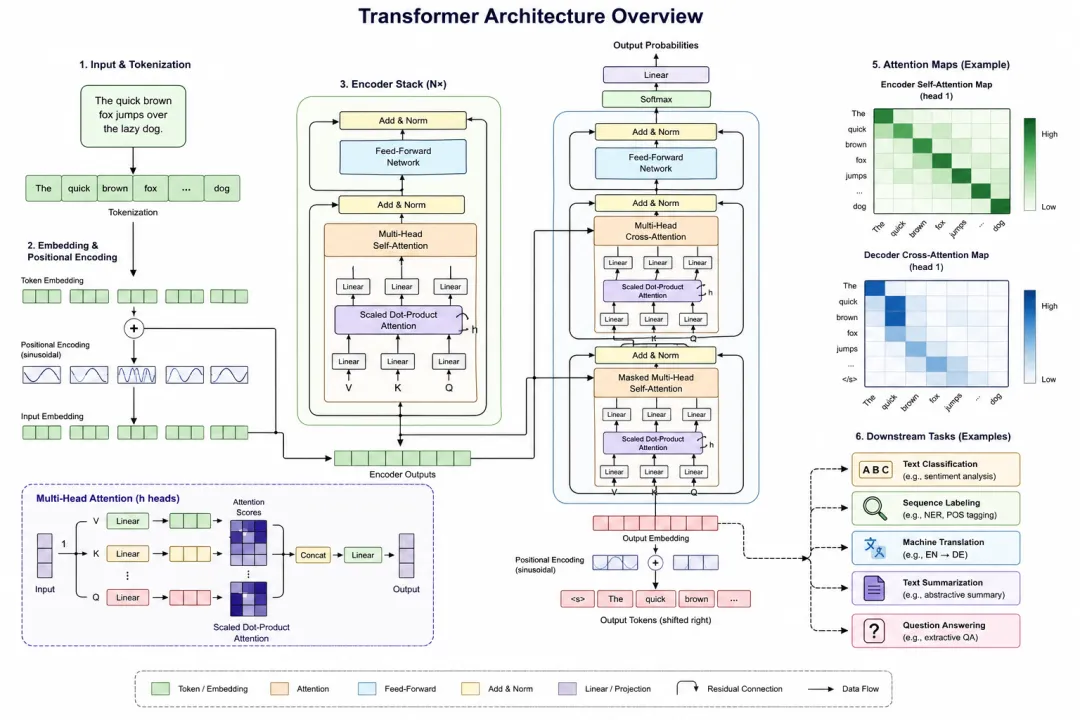
🦾 领域 8:机器人——自主导航系统
Prompt A:
Create a realistic technical illustration of an autonomous mobile robot navigating an indoor environment. Show LiDAR sensing, RGB-D cameras, inertial measurement units, simultaneous localization and mapping, obstacle detection, path planning, control signals, actuator motion, and a real-time digital map. Use a polished robotics engineering style with semi-transparent sensor fields.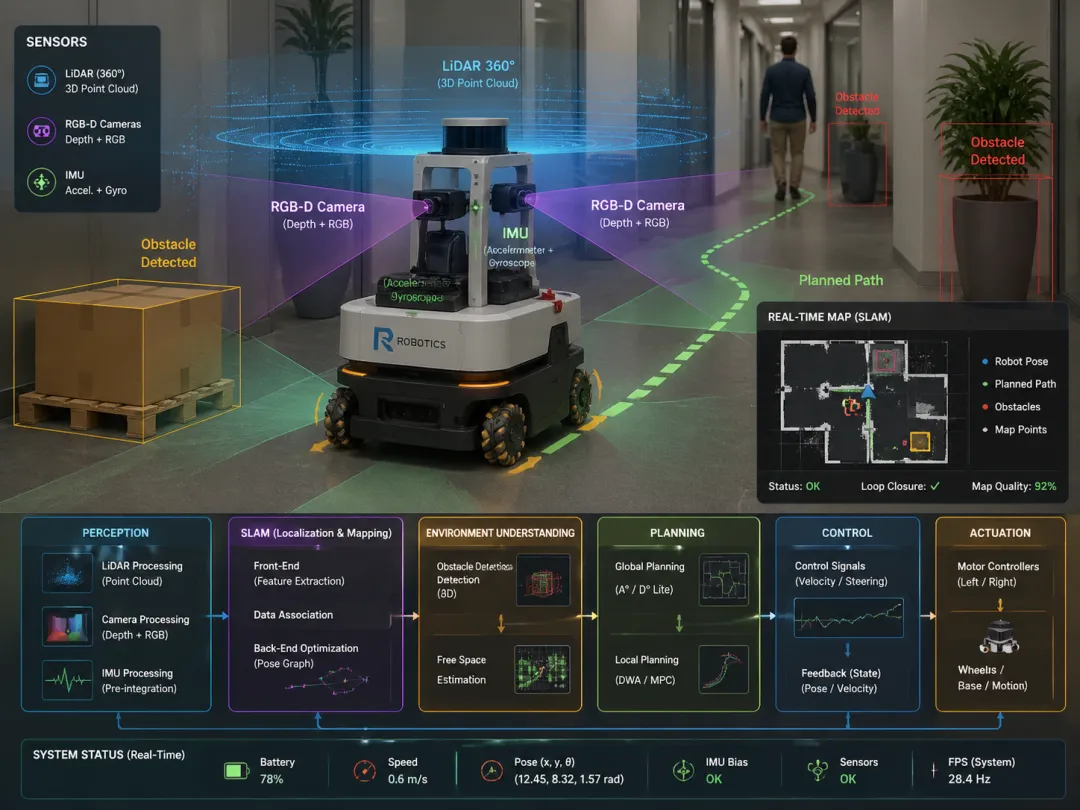 Prompt B:
Generate a comprehensive schematic of an autonomous driving perception and decision-making system. Include camera, LiDAR, radar, GPS, IMU, sensor fusion, object detection, lane segmentation, trajectory prediction, behavior planning, vehicle control, high-definition maps, and edge AI computing. Use a modern intelligent transportation visualization style with clear data-flow arrows.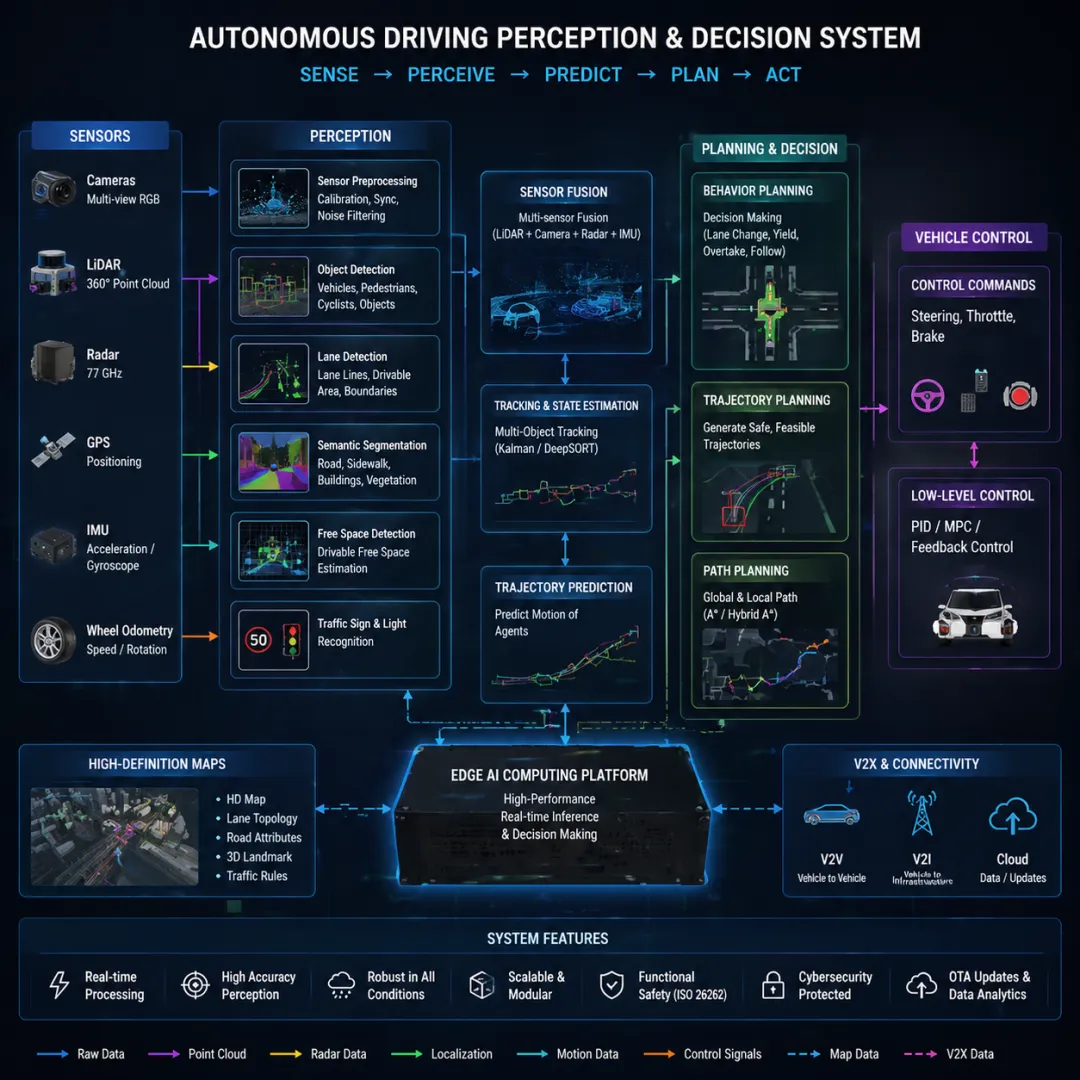
07|进阶技巧:让生成效果更好的 5 个窍门
技巧 1:提示词越具体,效果越好
❌ 不好的写法:
Draw a biology figure.✅ 好的写法:
Create a publication-quality graphical abstract showing PD-1/PD-L1 immune checkpoint blockade in the tumor microenvironment, with cytotoxic T cells, regulatory T cells, dendritic cells, and tumor cells. Use a clean biomedical illustration style.越具体,AI 越能理解你要什么。
技巧 2:指定风格和颜色
在提示词末尾加上风格描述:
Use a clean vector-style scientific illustration, soft blue-green-orange color palette, white background, minimal text labels, and publication-ready composition.常用风格关键词:
|
|
|
|---|---|
|
|
|
|
|
|
|
|
|
|
|
|
|
|
|
|
|
|
|
|
|
技巧 3:指定布局方向
Use a left-to-right workflow layout.Use a top-to-bottom multi-layer architecture.Use a center-out radial mechanism diagram.Use a multi-panel comparison layout.技巧 4:避免过多文字
GPT-Image-2 生成的图像中,文字可能会出现拼写错误。
建议在提示词中加上:
Minimize text labels. Use icons and arrows instead of text where possible.生成图片后,如果需要精确的文字标注,可以用 PPT 或 Keynote 手动添加。
技巧 5:用负面提示词排除不想要的元素
Avoid excessive text labels, avoid cartoonish style, avoid decorative elements unrelated to the research topic, avoid unrealistic molecular structures, avoid cluttered composition.08|总结与资源汇总
核心流程回顾
第 1 步:准备论文核心内容(标题、摘要、方法、结果) ↓第 2 步:用提炼提示词模板提取核心信息,自动生成英文绘图提示词 ↓第 3 步:将提示词粘贴到 GPT-Image-2 中生成期刊配图 ↓微调提示词 → 满意为止 → 导出使用资源汇总
|
|
|
|---|---|
| GPT-Image-2 绘图地址 | https://gpt-cn.pro/ |
|
|
|
|
|
|
|
|
|
|
|
|
|
|
|
|
|
|
科研绘图不应该成为发论文的瓶颈。
希望这篇文章能帮你省下画图的时间,把精力用在真正的科学问题上。
🎁 限时福利:免费领取 GPT-Image-2 七天体验卡
为了让更多研究生用上这个工具,我们准备了一批 GPT-Image-2 七天免费体验卡。
不需要付费,不需要充值,领到就能直接用。
领取方式:公众号后台回复【体验卡】
免责声明: AI 生成的科研配图应作为辅助工具使用。投稿前请确保图中的科学内容准确无误,必要时使用专业软件进行最终修正和标注。不同期刊对配图格式有不同要求,请参照目标期刊的投稿指南调整分辨率、尺寸和文件格式。