ARTICLE · 944432
[GEE-002]GEE 下载 ESRI 10 米土地覆盖
[GEE-002]GEE 下载 ESRI 10 米土地覆盖
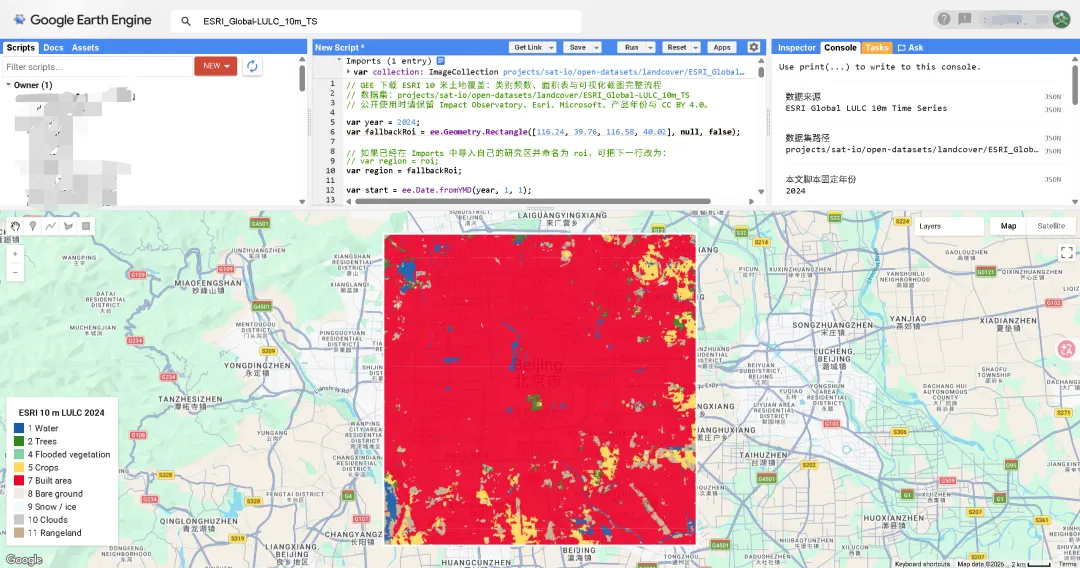
ESRI 10 米土地覆盖时间序列常被用于快速获取年度土地利用/土地覆盖结果。它的优势是年度覆盖多、分辨率高、类别直观。
数据来源
本文使用 projects/sat-io/open-datasets/landcover/ESRI_Global-LULC_10m_TS。该数据在 GEE Community Catalog 中提供,产品由 Impact Observatory 为 Esri 制作,并得到 Microsoft 支持,公开使用时应保留产品名称、年份、生产者和 CC BY 4.0 许可说明。
开始前准备研究区
如果你有自己的研究区边界,可以上传到 Earth Engine Assets,或从自己有权限的数据源导入到 Imports,并把变量名改为 roi。
本文脚本自带一个小范围示例矩形,方便第一次运行;换成自己的区域时,把 region 改成你的 roi 即可。
类型说明
ESRI LULC 的原始类别值是 1、2、4、5、7、8、9、10、11,并不连续。脚本只为地图显示临时重映射到 1—9,导出 GeoTIFF 仍保留原始类别值,避免后续和官方说明对不上。
运行脚本后,Console 会打印可用年份、相交分块数、类型说明、类别频数、面积表和导出说明。
运行预览
完整 Earth Engine 代码
// GEE 下载 ESRI 10 米土地覆盖:类别频数、面积表与可视化截图完整流程// 数据集:projects/sat-io/open-datasets/landcover/ESRI_Global-LULC_10m_TS// 公开使用时请保留 Impact Observatory、Esri、Microsoft、产品年份与 CC BY 4.0。var year = 2024;var fallbackRoi = ee.Geometry.Rectangle([116.24, 39.76, 116.58, 40.02], null, false);// 如果已经在 Imports 中导入自己的研究区并命名为 roi,可把下一行改为:// var region = roi;var region = fallbackRoi;var start = ee.Date.fromYMD(year, 1, 1);var end = start.advance(1, 'year');var collection = ee.ImageCollection('projects/sat-io/open-datasets/landcover/ESRI_Global-LULC_10m_TS');var documentedYears = ee.List.sequence(2017, 2024);var selected = collection.filterBounds(region).filterDate(start, end);var lulc = selected.mosaic().select([0], ['lulc']).clip(region).toUint8();var rawCodes = [1, 2, 4, 5, 7, 8, 9, 10, 11];var displayCodes = [1, 2, 3, 4, 5, 6, 7, 8, 9];var classNames = ['Water', 'Trees', 'Flooded vegetation', 'Crops', 'Built area','Bare ground', 'Snow / ice', 'Clouds', 'Rangeland'];var palette = ['1A5BAB', '358221', '87D19E', 'FFDB5C', 'ED022A','EDE9E4', 'F2FAFF', 'C8C8C8', 'C6AD8D'];var display = lulc.remap(rawCodes, displayCodes).rename('display_class');var classInfo = ee.List.sequence(0, rawCodes.length - 1).map(function(i) {i = ee.Number(i);return ee.Dictionary({class_value: ee.List(rawCodes).get(i),display_value: ee.List(displayCodes).get(i),class_name: ee.List(classNames).get(i),color: ee.List(palette).get(i)});});var histogram = ee.Dictionary(lulc.reduceRegion({reducer: ee.Reducer.frequencyHistogram(),geometry: region,scale: 10,maxPixels: 1e13,tileScale: 4}).get('lulc'));var groupedArea = ee.Image.pixelArea().divide(1e6).rename('area_km2').addBands(lulc).reduceRegion({reducer: ee.Reducer.sum().group({groupField: 1,groupName: 'class_value'}),geometry: region,scale: 10,maxPixels: 1e13,tileScale: 4});functiongroupsToAreaDict(groups) {groups = ee.List(groups);return ee.Dictionary(groups.iterate(function(item, acc) {item = ee.Dictionary(item);return ee.Dictionary(acc).set(ee.Number(item.get('class_value')).format(), item.get('sum'));}, ee.Dictionary({})));}var areaDict = groupsToAreaDict(groupedArea.get('groups'));var summaryTable = ee.FeatureCollection(classInfo.map(function(item) {item = ee.Dictionary(item);var key = ee.Number(item.get('class_value')).format();return ee.Feature(null, {class_value: item.get('class_value'),class_name: item.get('class_name'),pixel_count: ee.Number(histogram.get(key, 0)),area_km2: ee.Number(areaDict.get(key, 0))});}));var totalArea = ee.Number(summaryTable.aggregate_sum('area_km2'));summaryTable = summaryTable.map(function(feature) {return feature.set('area_percent', ee.Number(feature.get('area_km2')).divide(totalArea).multiply(100));});Map.setOptions('ROADMAP');Map.centerObject(region, 11);Map.addLayer(display, {min: 1, max: 9, palette: palette}, 'ESRI LULC ' + year, true, 0.92);var boundary = ee.Image().byte().paint({featureCollection: ee.FeatureCollection([ee.Feature(region)]),color: 1,width: 3});Map.addLayer(boundary, {palette: ['ffffff']}, '研究区边界');var legend = ui.Panel({style: {position: 'bottom-left', padding: '8px 12px'}});legend.add(ui.Label({value: 'ESRI 10 m LULC ' + year, style: {fontWeight: 'bold'}}));for(var i = 0; i < classNames.length; i++) {legend.add(ui.Panel({widgets: [ui.Label({style: {backgroundColor: '#' + palette[i], padding: '8px', margin: '0 6px 4px 0'}}),ui.Label({value: rawCodes[i] + ' ' + classNames[i], style: {margin: '0 0 4px 0'}})],layout: ui.Panel.Layout.Flow('horizontal')}));}Map.add(legend);print('数据来源', 'ESRI Global LULC 10m Time Series');print('数据集路径', 'projects/sat-io/open-datasets/landcover/ESRI_Global-LULC_10m_TS');print('本文脚本固定年份', year);print('常用年度范围提示', documentedYears);print(year + ' 年与研究区相交的影像分块数', selected.size());print('类型说明', classInfo);print('类别频数', histogram);print('类别面积概况_km2', summaryTable);print('输出投影', lulc.projection());print('导出说明', 'Tasks 面板中会生成 GeoTIFF 导出任务;导出保留 1、2、4、5、7、8、9、10、11 原始类别值。');summaryTable.size().evaluate(function(rowCount) {selected.size().evaluate(function(tileCount) {totalArea.evaluate(function(areaValue) {print('WC_GEE002_DONE', {year: year,row_count: rowCount,intersecting_tiles: tileCount,total_area_km2: areaValue,server_evaluation_finished: true});});});});Export.image.toDrive({image: lulc.unmask(0),description: 'WC_GEE002_ESRI_LULC_' + year,folder: 'wenchuan_gee_exports',fileNamePrefix: 'esri_lulc_' + year + '_roi_10m',region: region,scale: 10,maxPixels: 1e13,fileFormat: 'GeoTIFF',formatOptions: {noData: 0,cloudOptimized: true}});Export.table.toDrive({collection: summaryTable,description: 'WC_GEE002_ESRI_LULC_' + year + '_area_table',folder: 'wenchuan_gee_exports',fileNamePrefix: 'esri_lulc_' + year + '_area_table',fileFormat: 'CSV'});
小结
土地覆盖下载文章最好同时给读者三样东西:可复制代码、真实运行截图、类别统计表。这样读者知道下载的是哪一年、哪套产品、哪些类别,也能判断自己的研究区里是否存在异常类别或空值。
参考来源
GEE Community Catalog:ESRI 10m Annual Land Cover,https://gee-community-catalog.org/projects/S2TSLULC/ Esri Living Atlas Land Cover,https://livingatlas.arcgis.com/landcover/ Impact Observatory / Esri / Microsoft, Sentinel-2 10m Land Use/Land Cover Time Series, CC BY 4.0.