专题 08 图表类写作-2023 届新高考英语写作精讲+写作模板
【典题解读】
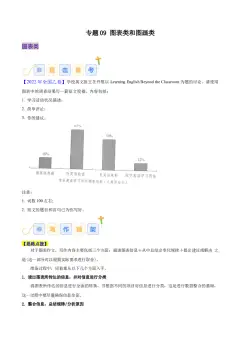
(2022·全国乙卷)学校英文报正在开展以Learning English Beyond the Classroom为题的讨论。请使用
图表中的调查结果写一篇短文投稿,内容包括:
1.学习活动状况描述:
2.简单评论;
3.你的建议。
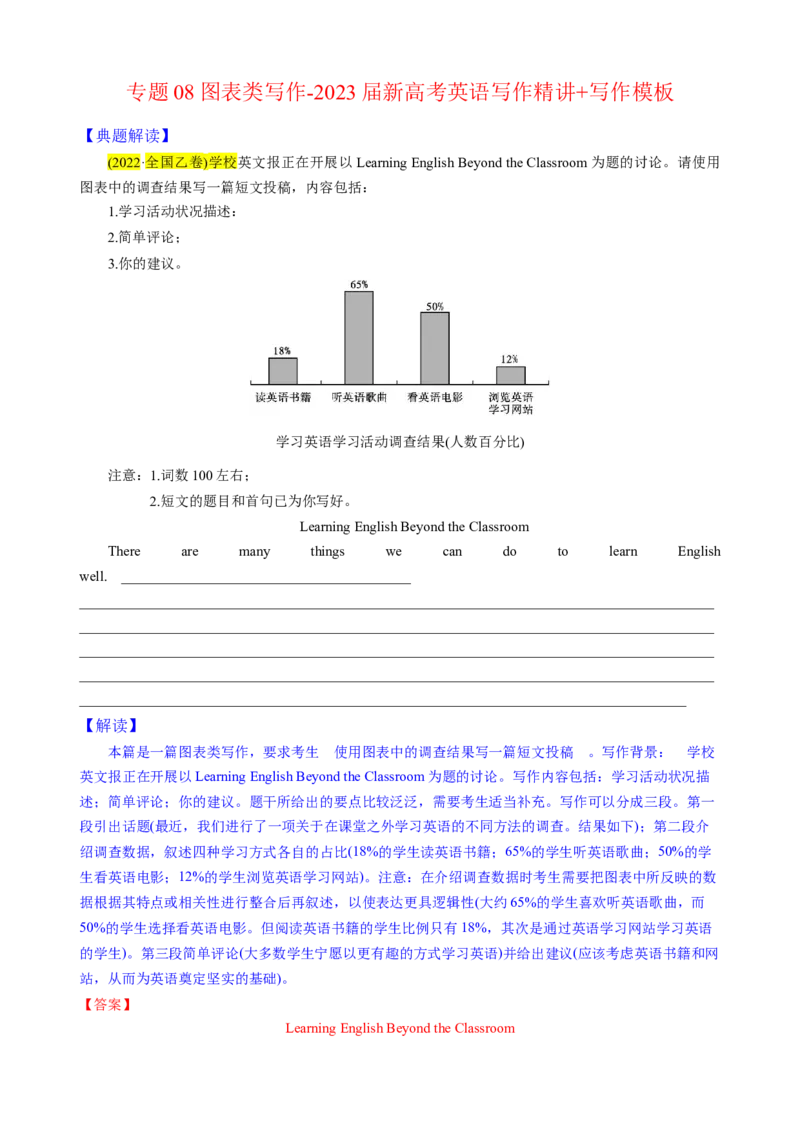
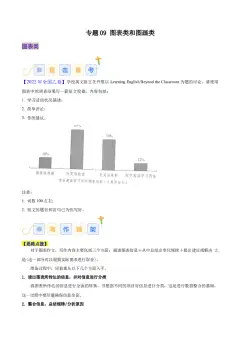
学习英语学习活动调查结果(人数百分比)
注意:1.词数100左右;
2.短文的题目和首句已为你写好。
Learning English Beyond the Classroom
There are many things we can do to learn English
well. _________________________________________
__________________________________________________________________________________________
__________________________________________________________________________________________
__________________________________________________________________________________________
__________________________________________________________________________________________
______________________________________________________________________________________
【解读】
本篇是一篇图表类写作,要求考生 使用图表中的调查结果写一篇短文投稿 。写作背景: 学校
英文报正在开展以Learning English Beyond the Classroom为题的讨论。写作内容包括:学习活动状况描
述;简单评论;你的建议。题干所给出的要点比较泛泛,需要考生适当补充。写作可以分成三段。第一
段引出话题(最近,我们进行了一项关于在课堂之外学习英语的不同方法的调查。结果如下);第二段介
绍调查数据,叙述四种学习方式各自的占比(18%的学生读英语书籍;65%的学生听英语歌曲;50%的学
生看英语电影;12%的学生浏览英语学习网站)。注意:在介绍调查数据时考生需要把图表中所反映的数
据根据其特点或相关性进行整合后再叙述,以使表达更具逻辑性(大约65%的学生喜欢听英语歌曲,而
50%的学生选择看英语电影。但阅读英语书籍的学生比例只有18%,其次是通过英语学习网站学习英语
的学生)。第三段简单评论(大多数学生宁愿以更有趣的方式学习英语)并给出建议(应该考虑英语书籍和网
站,从而为英语奠定坚实的基础)。
【答案】
Learning English Beyond the ClassroomThere are many things we can do to learn English well. Recently, we conducted a survey concerning
different ways to learn English beyond the classroom. The results are as follows.
There are roughly 65% of the students preferring to listen to English songs while 50% of the students
choose to watch English movies. But the percentage of students reading English books is only
18%, followed by 12% who study English via English learning websites.
The results suggest that most students would rather study English in a more entertaining way. From my
point of view, we should also take English books and websites into consideration, thus laying a
solid foundation for English.
【写作点拨】
图表类写作的题干主要以曲线图(graph)形式、柱状图(bar chart)形式、饼状图(pie chart)形式、数据表
格(table)形式及平面图(diagram)形式出现。这类题型具有文字量少、信息简洁、要点分散等特征。因
此,图表类写作,不能单纯的用语言文字把图表里的所有数据信息一一摊摆,逐条列出,而要对图表中
的数据进行筛选,并利用筛选后的数据将图表所反映出的主要问题阐述清楚。就这个意义上说,图表类
写作属于说明文。如果图表信息是用来论证某一观点,则图表类写作属于议论文。因此,图表作文在结
构处理和写法上与说明文或议论文是相同的。
一、审读图表,提炼要点
与其他类型的写作相比,图表类写作的审题难度较大,主要是因为考生不易准确、全面地把握图表
显示的关键信息(图表中那些最有代表性、规律性的数字,或变化大的数字)。因此考生要通过审读图表
(包括中英文文字)抓住主要数据及其所反映的主要问题,即提炼所要表达的要点;
二、分析要点,确立主题
对提炼出的要点进行认真分析,结合题干中的中英文文字提示,确定短文的主题。短文的主题往往
隐含在图表中,需要考生从图表数据中概括出事情或事件的规律和特征,然后归纳出主题。有时,试题
给出了短文的题目,也就等于为考生点明了主题。
三、谋篇成文,呈现亮点
(一)谋篇布局
图表类写作,常采用三段式的谋篇方式:第一段揭示图表所反映的主题或引出话题,并陈述图
表主要信息;第二段针对图表内容分析原因或进行评论;第三段紧紧围绕主题或展望/预测未来或提
出解决问题的方法、建议或、希望等;
(二)灵活表达
1.巧用数据
引用数据说明基本趋势,比较数据揭示基本特征。由于图表中的数据信息较多,写作时要巧
妙地引用一些数据来说明主题,不要作任何发挥。表达时,既要包含所有要点,但又不能面面
俱到。
2.表达灵活
由于图表数据比较单调,很容易使人选用相同的词语和句式进行表达,结果文章显得很乏
味。因此,写作时要尽量避免重复使用同一词语或句型,选择一些异曲同工的词语和句式来表
达。图表式写作描述数据变化的三种方法(三种方法所要用的句型,请参看本专题的“常用素材”):方法一:横向对比。描述这种图表需要对比各数据间的差别,主要以数值、倍数、排列
等方式来描述;方法二:纵向说明。只要指出不同单位之间的比较,描述如何增减,增减幅度
如何,反映出什么问题,就可以了。方法三:纵向、横向均有的说明。这种图表不仅要注意同
一事物的变化趋势,也要注意不同事物之间的差距及变化。
3.恰当发挥
和提纲作文一样,图表类作文的最后也要总结全文的观点,根据图表内容给出相应的建议或
者评价,这一点类似于社会问题型写作的结尾。这是让考生自主发挥的部分,更是短文最精彩
的部分。考生在表述观点时,可以引用人们普遍的观点,也可表达自己独到的见解。借题发挥
时,不可偏离主题,不必作更多的解释或说明,只要把观点表述清楚即可。
【常用素材】
Recently a survey has been done to find out ... In this survey, ...were interviewed. Most of the surveyed
answered...为了找出/发现……,最近做了一项调查。在这项调查中,……接受了采访。大多数受访者
回答说……
The results are as follows.结果如下。
As is apparently shown in the table above, ...正如上表所突显的那样,……
As is shown in the table(chart)/As can be indicated in the table(chart)/According to the figures given in the
table(chart), ...如表(图)所示,……
It can be seen from the table that.../From the table we can see that...从表中可看出…/从表中我们可知……
As is shown in the(pie/bar)chart/graph/diagram/table ...如图(饼图/条形图)图表/图形/表格所示……
As we can see from the table that...正如我们从表中看到的那样……
As can be seen from the diagram, great changes have taken place in ...
从图表中可以看出,……发生了巨大的变化……
As is shown by the graph, we can easily find out that...如图所示,我们可以很容易找到发现……
It is expected to increase ... times.预计将/有望增加……倍。
There is an increase of ...% in total this year.今年总共增加了……%。
The total number was lowered by ...%.总数减少了……%。
The table shows a ... times increase over that of last year.该表显示比去年增加了……倍。
It has decreased almost to and half times, compared with that in ...与……相比,已下降了近1.5倍。
Compared with ..., it fell from ... percent to ... percent.与……相比,它从百分之……下降到了百分之……
It has increased by ... times compared with that of ... 它比……增加了……倍。
It was decreased twice than that of the year ...比去年减少了……两倍。
... has the lowest sales figure in the ..., followed by ... and ...
……的销售额在……中最低,其次是……部门和……部门。
The figure of ... is about twice as much as that of ....……的数字大约是……的两倍。
The income from sales is ... million, making the company the highest one in sales.
销售收入为……百万,是销售额最高的公司。
The ...’s income/The income of ... reaches ... million, which is in the middle of the list.
……的收入达到……百万,位于榜单的中间。
The rise lasted for two weeks and then began to level off in ...上涨持续了两周,然后在……开始趋于平稳。
The trend/increase slowed down in ...……的趋势/增长放缓。
The trend of increasing ... began to gain momentum in ...……增加的趋势在……开始走强。
It accounts for ... % of the total population.它占总人口的……%。
There are ... members with master’s degrees, making up nearly a quarter of ...
有……名成员拥有硕士学位,占……的近四分之一。
The figure of income increased by about ...% as compared with ... ago.
与……前相比,收入增长了约……%。
The number of students has reached ..., indicating a rise of ...%,compared to last year.
学生人数已达……,与去年相比增长了……%。
Many factors contribute to this situation.造成这种情况的因素很多。
The reason why... is that...……的原因是……
Every coin has two sides.每件事都有两面性。
With the rapid growth of..., ... have become increasingly important in our daily life.
随着……的快速增长,……在我们的日常生活中已经变得越来越重要了。
Now people in growing numbers are beginning to realize that...现在越来越多的人开始意识到……
There is no doubt that immediate attention must be paid to the problem of ...
毫无疑问,……问题必须立即引起注意。
The increase/decrease in... is due to the fact that ...……增加/减少是由于……样的事实引起的。
Such changes in the table should owe to the following reasons. Firstly, ... Secondly, ...
表中的这种变化应归功于以下原因。首先,其次,……
Another contributory factor of ... is ...……的另一个因素是……
The reason for...is that ...……的原因是……
One of the most surprising findings is that...最令人惊讶的发现之一是……
It is clear that the increase of percentage gets greater and greater.很明显,增加的比率变得越来越大。
They couldn’t be satisfied with them more.他们对这个结果非常满意。
More emphasis should be put on ...更多的重点应该放在……
I’m not among the majority who tend to ...我不属于大部分倾向于……的人。
In spite of the different opinions, I still hold the view that ...尽管有不同的意见,我仍然认为……
The great effect these changes have on ... is obvious that ...这些变化对……的巨大影响是显而易见的。
It will bring about an unfavorable influence on ...这将对……产生不利影响。
It may produce a great change in ...它可能会在……方面产生巨大的变化。
From what has been discussed above, we can draw the conclusion that ...
通过以上讨论,我们可以得出结论……
Obviously, if we want to ..., it is necessary ...很明显,如果我们想……,……是很有必要的。
There is no doubt that attention must be paid to ...毫无疑问,必须注意……
I suggest the government take effective measures to ...我建议政府采取有效措施……
All these data clearly prove the fact that ...这些数据明显地证明了这一事实,即……It is high time that we placed great emphasis on ...是我们高度重视……的时候了。
It is necessary that effective actions should be taken to prevent the situation.
必须采取有效措施来防止这种情况的发生。
【模板构建】
模板一1
Recently, we/I have done a survey about /a survey has been carried out on ________(调查的主要内
容). Views vary from person to person. The results are as follows.
As can be seen from the(pie/bar)chart/graph/diagram/table, the majority/...% of the people/students
interviewed ________(调查的结果一). They think _________. Only in this way can they________(原因一).
Very few people/students, that is about ... %, think ________(调查的结果二), because ________(原因二
①). What’s more, ________(原因二②). However, ... % of the ... believe ________(调查的结果三).
_________(原因三).
In my point of view, _________(你的看法或观点).
模板一2(模板运用见写作实践一)
As is shown in the(pie/bar)chart/graph/diagram/table, most _______(图表所反映的主题). Surprisingly,
most of the surveyed _______. Only a few ________. And those who _______ are in the minority.(描述图表信
息).
或:Recently, we have made a survey about _______(调查的主要内容)among ... in ... According to the
survey, ...% /Most of the ... surveyed _______, while _______ % _______ and the rest _______.(描述图表
信息). we can conclude (that)most of ... _______(图表所反映的主要现象).
Many factors contribute to this situation. First of all, due to _______(原因一). Secondly, _______(原因
二). Thirdly, _______(原因三)/Other factors, such as _______(其他原因).
Therefore, in my opinion, effective measures should be taken to solve the problems. Most importantly,
_______. Besides, _______. What’s more, _______. (提出具体建议).
【模板应用】一1
(改编自百度题库)最近,你在你校高三(1)班就“上大学是高中生唯一的出路吗?”进行了一次问卷
调查。调查结果见下图。
请根据图表及汉语提示,写一篇短文叙述调查的结果、分析其原因(自拟),并阐述你的个人观点。
注意:词数150左右,标题已经给出,不计入总词数。
Is It the Only Way Out to Go to College?
______________________________________________________________________________________________________________________________________________________________________________
__________________________________________________________________________________________
__________________________________________________________________________________________
__________________________________________________________________________________________
__________________________________________________________________________________________
__________________________________________________________________________________________
__________________________________________________________________________________________
__________________________________________________________________________________________
______________________________________________
【答案】
Is It the Only Way Out to Go to College?
Recently, I have done a survey about whether it is the only way out for senior students to go to college in
Class 1, Senior 3 in our school. Views vary from person to person. The results are as follows.
As can be seen from the chart, the majority of the students interviewed consider it very necessary to go
to college. They think it can widen their knowledge and improve their qualities. Only in this way can they find
better jobs after graduation. Very few students, that is about 10%, think it is no use going to universities,
because the tuition is too high for their families to afford. What’s more, nowadays it’s rather hard for college
graduates to seek satisfactory jobs. However, 30% of the students, believe “All road lead to Rome.” Therefore,
it doesn’t make any difference whether they go to college or not.
In my point of view, we can receive a better education at college so that we can serve our motherland better
in the future.
模板二
In order to/To ______(目的), a survey has been/was carried out _______(调查的对象及时间). The
results are as follows.
_______% of the _______ a year ago while _______ now(情况一:过去与现在比较). There is little
difference between the percentage of _______, which is about _______ % now, almost the same as a year ago(情
况二:过去与现在比较). However, there is big difference in _______. The percentage rose from _______ %
_______ to about _______ % _______. (情况三:不同的两个阶段情况比较).
或者:The number of ... has increased from ...% in ... to ...% in ...(情况一:两年情况比较), while that
of ... from ... % to ... %(情况二). Nearly ... % ...(情况三). Besides, ...% ...(情况四).
The main cause of this change, I think, _______(情况变化的原因).
或者:It seems to me that the reasons for this lie in _______(原因), thus _______(结果). In order
to _______, we call for _______. Only in this way can ... _______(提出建议).
【模板运用】二
(改编自2022秋·江苏苏州高一期中)下面图表是你们班级同学初高中阶段上网情况的调查对比,请你
描述图表的变化并分析原因。注意:1.写作词数应为120左右;
2.请按要求在答题的相应位置作答。
____________________________________________________________________________________
__________________________________________________________________________________________
__________________________________________________________________________________________
__________________________________________________________________________________________
__________________________________________________________________________________________
__________________________________________________________________________________________
__________________________________________________________________________________________
__________________________________________________________________________________________
__________________________________________________________________________________________
______________________________________________
【答案】
To further understand the differences of online activities in junior high and in senior high, a survey was
carried out in our class recently. The results are as follows.
60% of my classmates played online games a year ago when in junior high, while only 20% do that now.
There is little difference between the percentage of chatting, which is about 28% now, almost the same as a year
ago. However, there is big difference in learning activities. The percentage rose from 28% in junior high to about
82% in senior high.
The main cause of this change, I think, is that study in senior high is much more difficult than before. So we
no longer have much time playing games online.
【写作实践】一
(改编自2021春·高一课时练)下面是某高中对150名高中学生睡眠时间不足及其原因所做调查的结
果。请根据下图提供的信息描述高中学生的睡眠情况,说明造成这些情况的原因,并提出你的建议。
注意:词数150左右。____________________________________________________________________________________
__________________________________________________________________________________________
__________________________________________________________________________________________
__________________________________________________________________________________________
__________________________________________________________________________________________
__________________________________________________________________________________________
__________________________________________________________________________________________
__________________________________________________________________________________________
__________________________________________________________________________________________
______________________________________________
【答案】
Recently, we have made a survey recently about how much time students can sleep every day among 150
students in a senior high school. According to the survey, 62% of the students surveyed sleep for less than
seven hours each day, while 37% sleep seven to eight hours and only one percent over eight hours. We can
conclude most of senior high school students don’t have enough sleep.
Many factors contribute to this situation. First of all, half of the students think they have to finish too
much homework. Secondly, 35% students say that they have to stay up studying hard. Other factors,
such as being required to get up too early to go to school, tutoring, should also affect students’ sleep.
Therefore, in my opinion, effective measures should be taken to solve the problems. Most importantly,
teachers of major subjects had better give students less homework. Besides, schools should shorten the time
of students’ study in school. What’s more, students should improve their study efficiency so that they can have
enough sleep at night.
【写作实践】二
(改编自2022秋·黑龙江哈尔滨市六中高一期末)下列图表反映的是你校2018年与2021年高中生健
康状况调查的部分数据,请你用英语为某报写一份报告,反映你校三年间学生健康状况的变化情况,分
析其中原因,并提出一些改进建议。
注意:1.报告必须包括图表中所有内容,但不要逐条罗列;
2.词数150左右。____________________________________________________________________________________
__________________________________________________________________________________________
__________________________________________________________________________________________
__________________________________________________________________________________________
__________________________________________________________________________________________
__________________________________________________________________________________________
__________________________________________________________________________________________
__________________________________________________________________________________________
__________________________________________________________________________________________
______________________________________________
【答案】
To find out the health status of students in the past three years, a survey has been carried out in our
school. The results are as follows.
The number of short-sighted students has increased from 77% in 2018 to 93.5% in 2021, while that of
overweight students from 38% to 57.2%. Nearly 15% more students don’t have enough sleep because of more
homework. Besides, over 21% more students become mentally unhealthy.
It seems to me that the reasons for this lie in heavier burden of study and more homework, thus making
students unable to spare any time to take exercise or have enough sleep. In order to improve students’ health,
we call for less homework. Only in this way can students get plenty of sleep and be healthier. Proper diets and
exercise should also be paid attention to so that they won’t easily put on weight. With their heavy burden
removed, students can then keep in normal mental health.