 夜雨聆风
夜雨聆风


霍尔木兹危机与 AI 扩散中重塑全球配置版图
以下内容来自富达全球宏观经济总监jurrien timmer
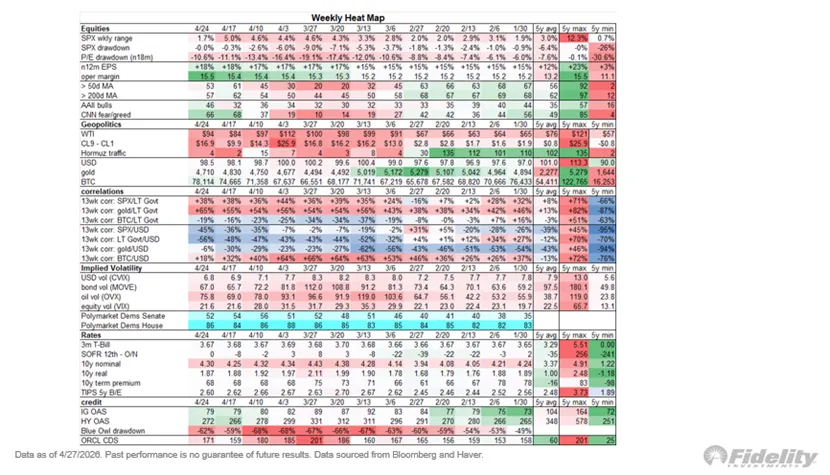
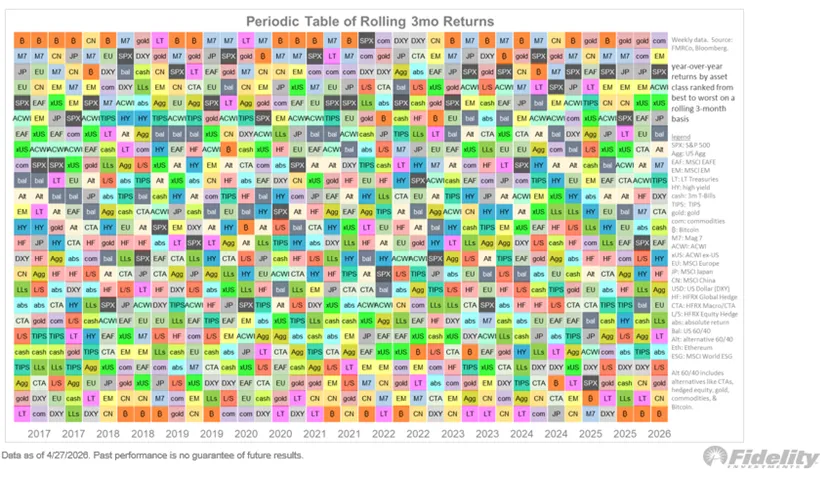
For the markets, last week was more of the same, with strong momentum in the tech/AI space propelling the market away from concerns about oil shortages as the Strait of Hormuz remains mostly shut. Per the heat map bealow, the cap-weighted S&P 500 made new highs last week while its forward P/E ratio remains 10% below its high. Breadth is OK, with 53% of stocks trading above their 50-day moving average and 57% trading above their 200-day moving average. It’s nothing to write home about and illustrates that the thrust higher since the March 30th low has been dominated by the Mag7.上周市场走势与上周基本一致,科技/人工智能板块的强劲势头推动市场暂时摆脱了对霍尔木兹海峡基本关闭导致石油短缺的担忧。如下方热力图所示,市值加权标普 500 指数上周创下新高,而其远期市盈率仍比高点低 10%。市场广度尚可,53%的股票交易价格高于其 50 日移动平均线,57%的股票交易价格高于其 200 日移动平均线。这并非什么值得大书特书的亮点,也表明自 3 月 30 日低点以来的上涨行情主要由 Mag7 主导。
Uniform rally统一集会
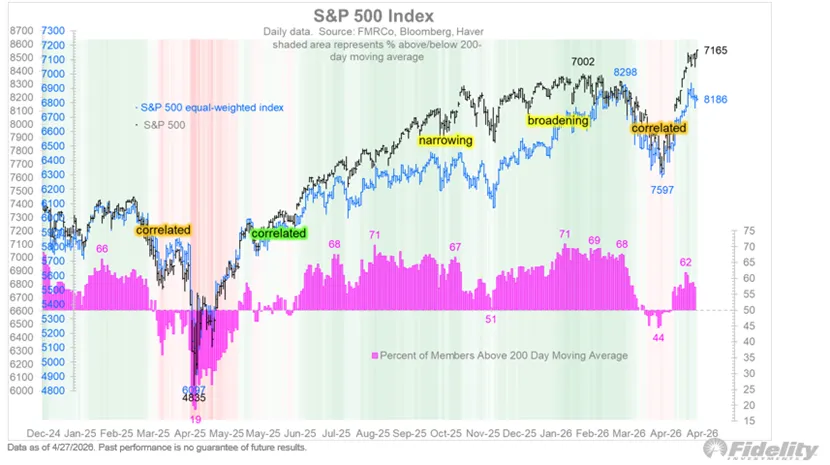
While the rally from the March 30th low has been fairly uniform in absolute terms, the cap-weighted index has dominated the equal-weighted index, which remains below its January highs.虽然从 3 月 30 日的低点开始的反弹在绝对值上相当一致,但市值加权指数的表现优于等权重指数,后者仍低于 1 月份的高点。
1990 analog1990 年模拟
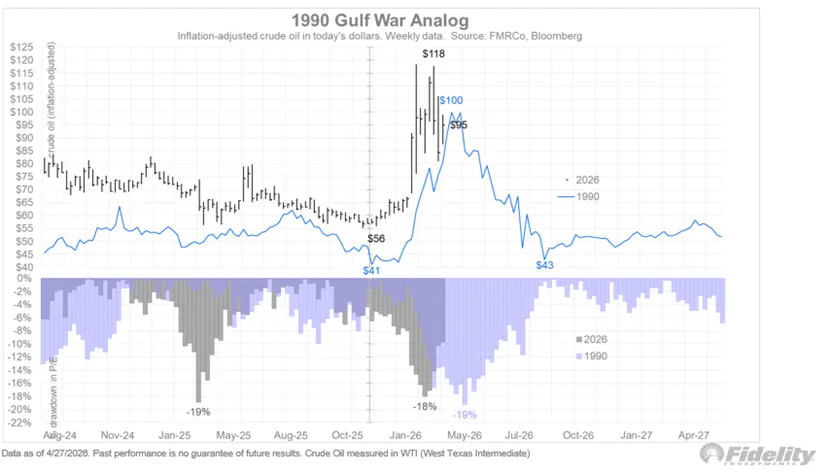
The market continues to trade along the 1990 Gulf War analog, presumably betting on a quick reversal from the current oil spike. The valuation drawdown of 18% has been a spitting image of the 19% drawdown back in 1990. Let’s see if the analog lasts.市场走势继续与1990年海湾战争时期如出一辙,大概是押注油价会从当前的飙升中迅速回落。18%的估值跌幅与1990年19%的跌幅几乎如出一辙。让我们拭目以待,看看这种类比是否能够持续。
Earnings to the rescue收入来救场
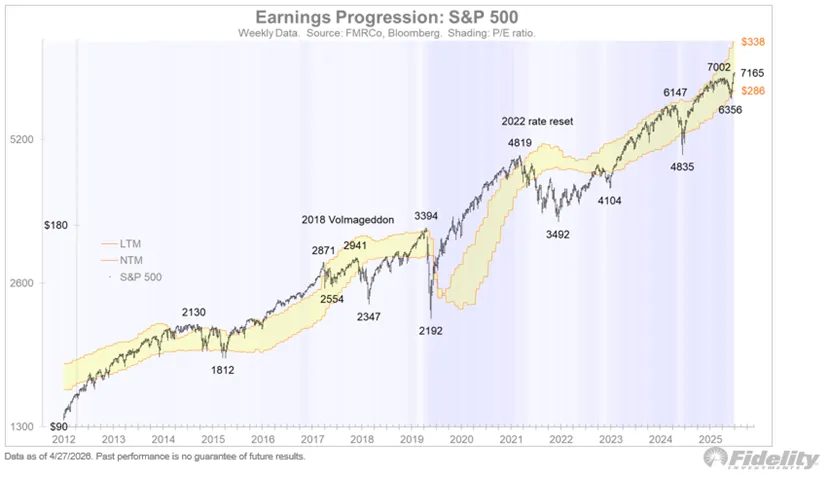
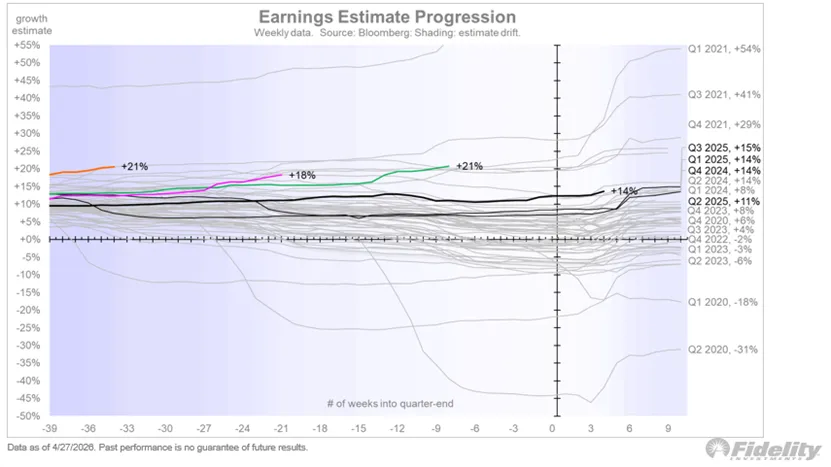
Booming earnings growth has been a dominant feature of the market’s resilience amid some unsettling geopolitical headlines. Were it not for earnings estimates accelerating to a 20% year-over-year rate, surely the recent 9.8% drawdown would have been closer to the nearly 20% haircut in valuations. We can see from the earnings band below that the S&P 500 index “touched” the upper bound at the January highs and likewise touched the lower bound at the March low. If that back-and-forth continues, it could mean considerably more upside as forward estimates continue to accelerate higher.在一些令人不安的地缘政治新闻的冲击下,强劲的盈利增长一直是市场韧性的主要特征。如果不是盈利预期同比增速加速至20%,那么近期9.8%的跌幅肯定会更接近估值近20%的缩水幅度。从下方的盈利区间图可以看出,标普500指数在1月份的高点触及了上限,在3月份的低点也触及了下限。如果这种波动持续下去,随着预期继续加速攀升,市场可能还有更大的上涨空间。
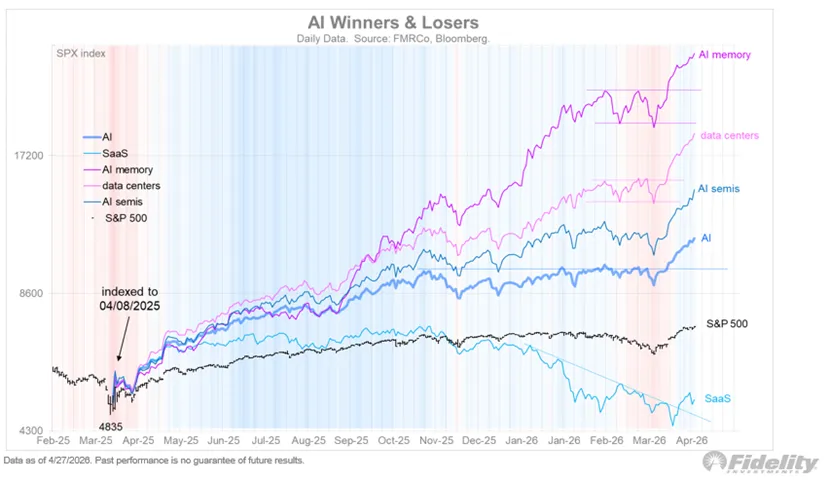
AI boom人工智能热潮
The AI space continues to dominate, with semis now leading the charge. The hyper-scaler plays hardly budged during the Iran volatility and are now rocketing higher. It proves the old adage that when a stock refuses to go down, it will inevitably go up.人工智能领域持续占据主导地位,半导体行业更是引领潮流。超大规模数据中心运营商的股价在伊朗市场动荡期间几乎没有波动,如今更是飙升。这印证了那句老话:如果一只股票不肯下跌,它就一定会上涨。
Cats & dogs猫和狗
Even the “cats and dogs” within the tech space are stirring again, making new recovery highs last week as they rallied out of a holding pattern.就连科技领域的“猫狗股”也再次活跃起来,上周创下新的复苏高点,摆脱了盘整状态。
Resilient Bitcoin弹性比特币
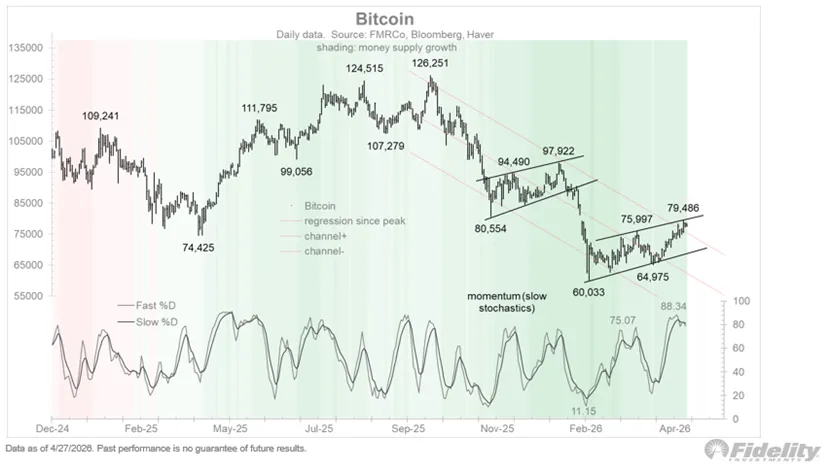
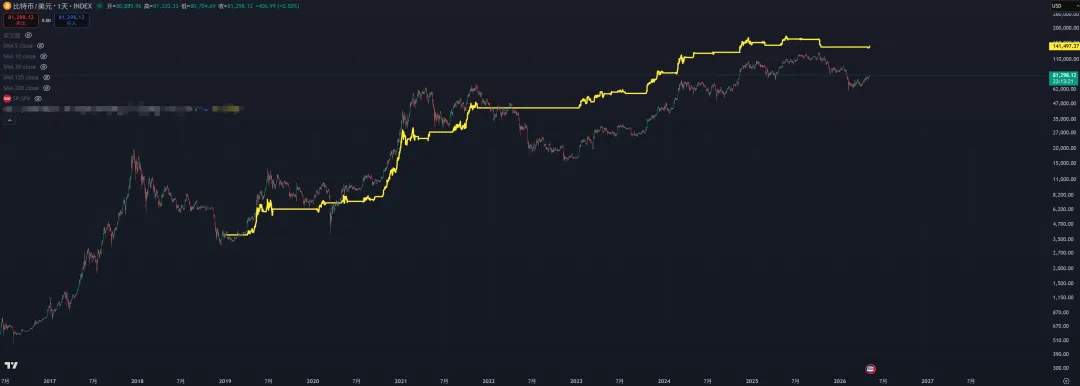
Bitcoin also continues to show resilience as it tests the upper bounds of a potential bear flag. Technical Analysis 101 states that when bear market rallies get overbought (per the stochastics below), it’s usually the kiss of death and time to sell. However, during bull markets overbought momentum means that the market is strong and likely to stay strong. My conclusion is that if Bitcoin cannot be pulled down by this current combination of overbought momentum and trendline resistance, then this is an emerging bull market and not a bear market rally. That’s been my hunch all along and it may be about to get confirmed. More on this later.比特币在测试潜在熊市旗形的上边界时,也继续展现出韧性。技术分析入门知识告诉我们,当熊市反弹出现超买(如下随机指标所示)时,通常是行情崩盘的预兆,应该卖出。然而,在牛市中,超买动能意味着市场强劲,并且很可能继续保持强势。我的结论是,如果比特币无法被当前超买动能和趋势线阻力的组合拉低,那么这很可能是一个正在形成的牛市,而不是熊市反弹。这始终是我的直觉,现在可能即将得到证实。稍后我会详细阐述。
寒叔简评:
这点我不是太赞同,从技术分析来看,通常分为两种:
1. 一种是客观的,比如相对强弱指数(RSI)、MACD、CCI 等指标;
2. 另一种是像“牛旗”或“熊旗”这类技术指标,它们具有很强的主观性。
这类指标可以用来作为观察和判断市场的一种工具,但不建议作为投资决策的依据。
我们在二月文章中也分析了为什么长期看看好比特币
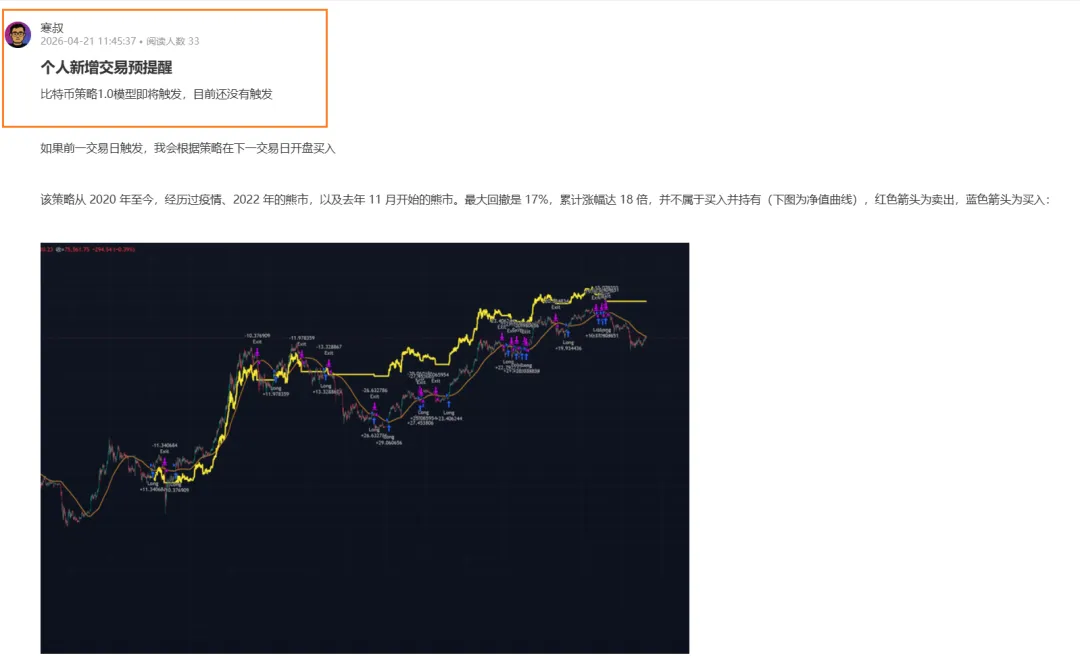
个人也根据策略进行操作,近期有两次操作,分享在社群
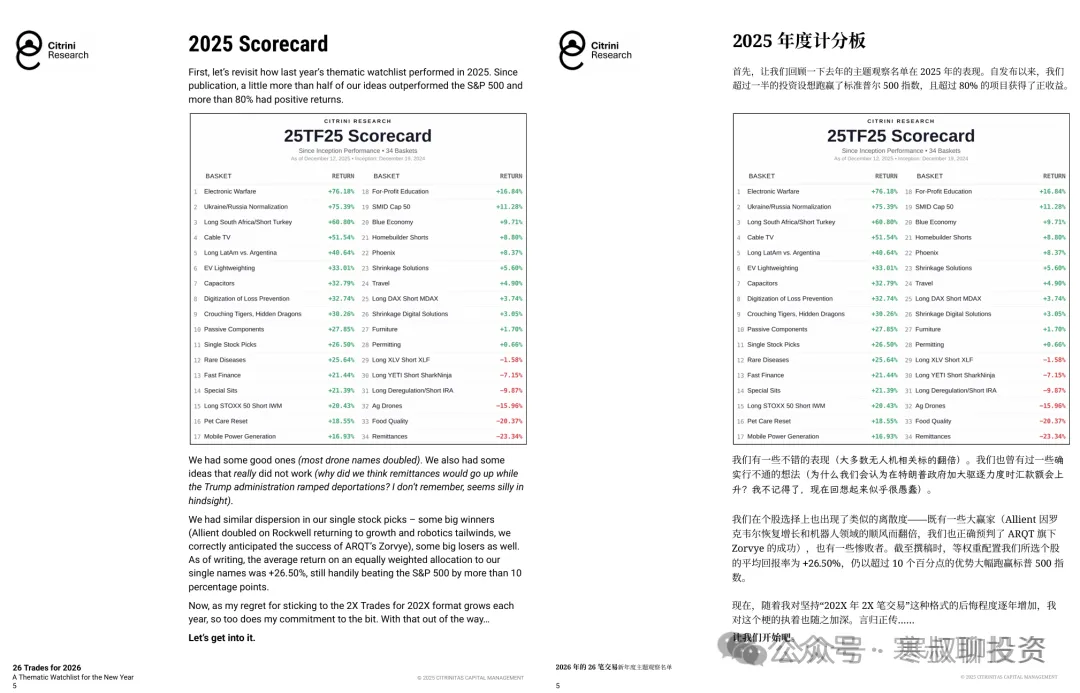
Earnings season财报季
Q1 earnings season is underway and so far, so good. With 137 companies reporting, 79% are beating estimates by an average of 1019 bps. This is in line with the robust performance of the past four quarters, which suggests that the earnings boom is not losing any steam.第一季度财报季已经拉开帷幕,目前来看形势良好。在已公布业绩的137家公司中,79%的公司业绩超出预期,平均超出幅度达1019个基点。这与过去四个季度的强劲表现相符,表明盈利繁荣势头依然强劲。
Not just AI不仅仅是人工智能
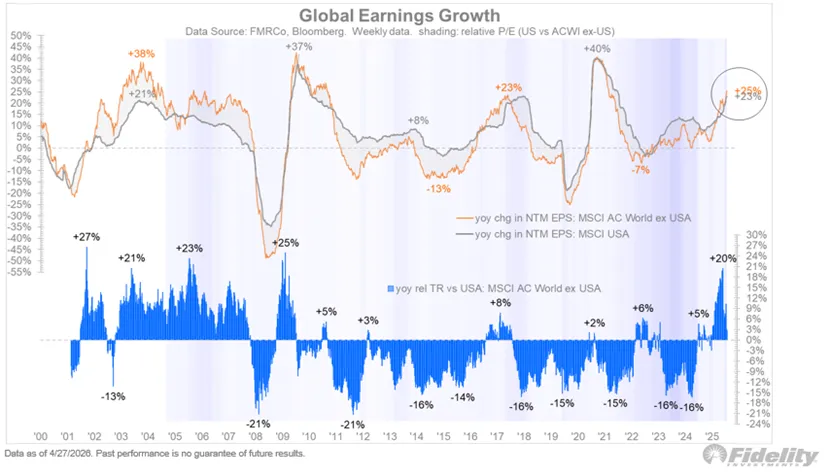
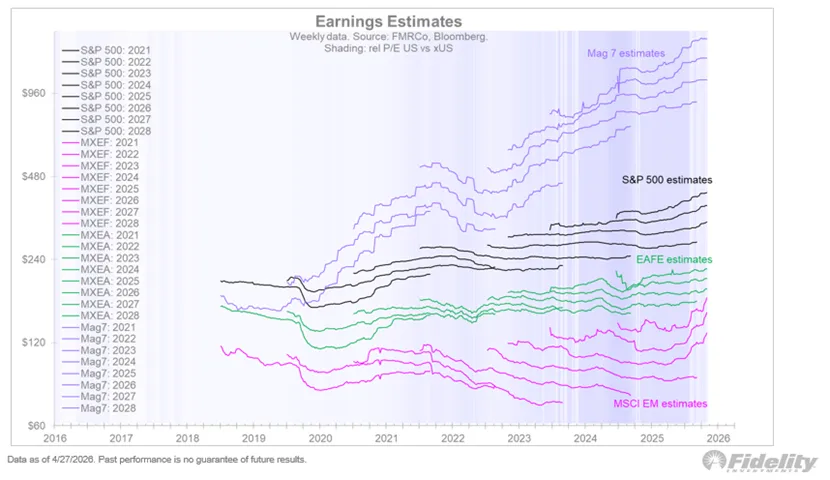
While it’s tempting to lay it all on the AI story, earnings are booming even faster outside the US. The year-over-year change in forward estimates is 25% for the MSCI ACWI ex-US index, vs 23% for the MSCI US index.尽管人们很容易将所有增长都归因于人工智能,但美国以外地区的盈利增长速度甚至更快。MSCI ACWI(除美国外)指数的预期收益同比变化为 25%,而 MSCI 美国指数的预期收益同比变化为 23%。
寒叔简评:这是我们经常说的人工智能的扩散
Global boom全球繁荣
The chart below visualizes the global earnings story. Everything is on the same log scale, which allows us to compare apples to apples in terms of the direction of each set of squiggles. EM has by far the greatest earnings momentum right now.下图以可视化的方式呈现了全球盈利状况。所有数据均采用对数坐标,以便我们能够公平地比较每组曲线的方向。目前,新兴市场(EM)的盈利增长势头最为强劲。
Valuations估值
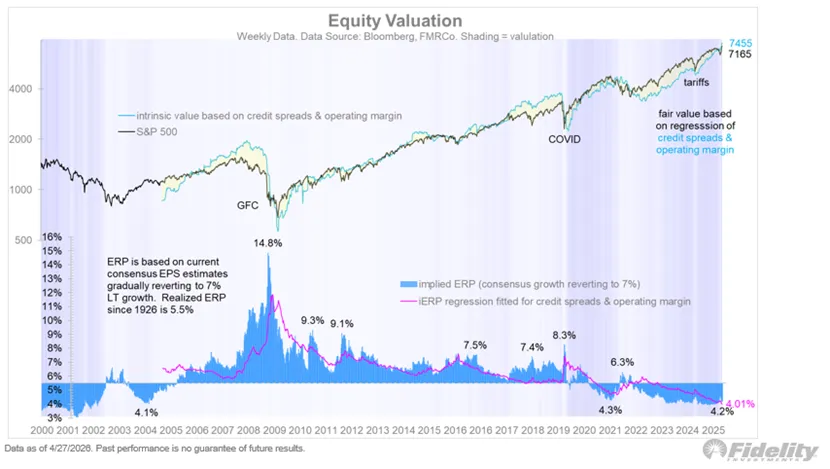
While valuations in the US remain a concern for many investors, in my view they are justified by the macro fundamentals of all-time high (and rising) margins and tight credit spreads. Those two variables are the independent variables in my regression below, which suggests that the equity risk premium should be 4.0% (instead of the historical average of 5.0%). Based on that regression, the fair value for the S&P 500 index is 7455 and rising.尽管美国股市的估值仍然令许多投资者担忧,但我认为,其合理性源于宏观基本面,例如历史新高(且仍在上升)的利润率和收窄的信贷利差。这两个变量是我下文回归分析的自变量,分析结果表明,股票风险溢价应为4.0%(而非历史平均值5.0%)。基于该回归分析,标普500指数的合理估值为7455点,且呈上升趋势。
寒叔简评:
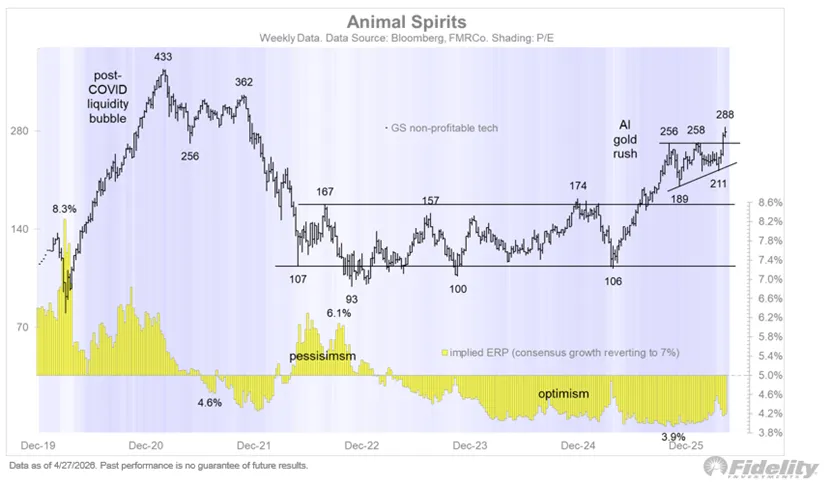
隐含股权风险溢价(Implied ERP)与历史风险溢价(Historical ERP)最大的不同在于,它不是“看后视镜”,而是通过当前市场价格和预期现金流反推出来的前瞻性指标。
当 Implied ERP 显著低于历史均值且脱离基本面回归线时,警惕泡沫。
隐含 ERP 就是在问市场:“按照现在的股价和未来的赚钱能力,你到底要求多少额外补偿才愿意承担股票风险?” 目前 4.2% 的水平意味着,根据目前的盈利、股价和未来现金流,以及国债收益率
目前的点位性价比在过去20年处于最低的位置之一
Sentiment情绪
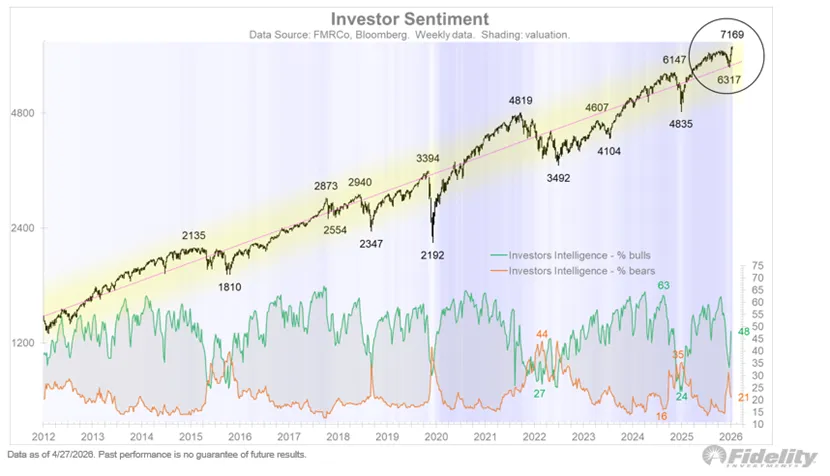
Sentiment has improved since the March 30 low, as one might expect. The II survey never “crossed over” at the low, and is currently well shy of the bullish extremes from the January high.正如预期,市场情绪自 3 月 30 日低点以来有所改善。II 调查在低点从未出现“交叉”,目前也远低于 1 月份高点以来的看涨极端水平。
Mountain of cash巨额现金
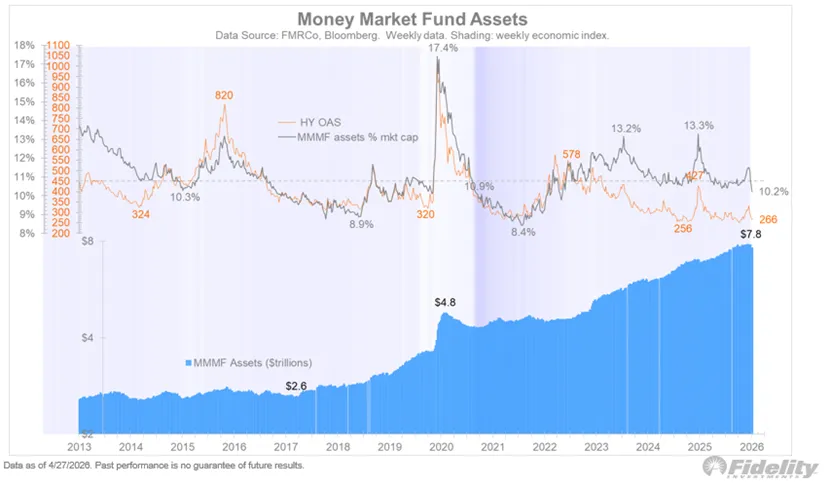
We haven’t heard much about that mountain of cash supposedly sitting on the sidelines waiting to get sucked into the market. My take has been that the $7.8 trillion sitting in money market funds came from the banks and not the stock market back in 2023. That’s when the mini-banking crisis hit (SVB & FRB) while bank deposit rates remained much lower than money markets. Having said all that, we can see from the chart below that the ratio of money market fund assets relative to the stock market’s capitalization (10.2%) is about 200 bps higher than where they should be on the basis of credit spreads (which are highly correlated and do a good job in illustrating risk appetites). So, one could make the case that there is around $1.5 trillion of dry powder that could fuel stocks higher still.我们很少听到关于那笔据称在场外等待入市的巨额资金的消息。我的看法是,2023 年货币市场基金中 7.8 万亿美元的资金并非来自股市,而是来自银行。当时正值小型银行危机爆发(SVB 和 FRB),而银行存款利率远低于货币市场利率。尽管如此,我们可以从下图看出,货币市场基金资产占股市总市值的比例(10.2%)比基于信用利差(两者高度相关,能很好地反映风险偏好)的合理水平高出约 200个基点。因此,可以说,大约有 1.5 万亿美元的“干粉”(即未使用的资金)可以进一步推高股市。
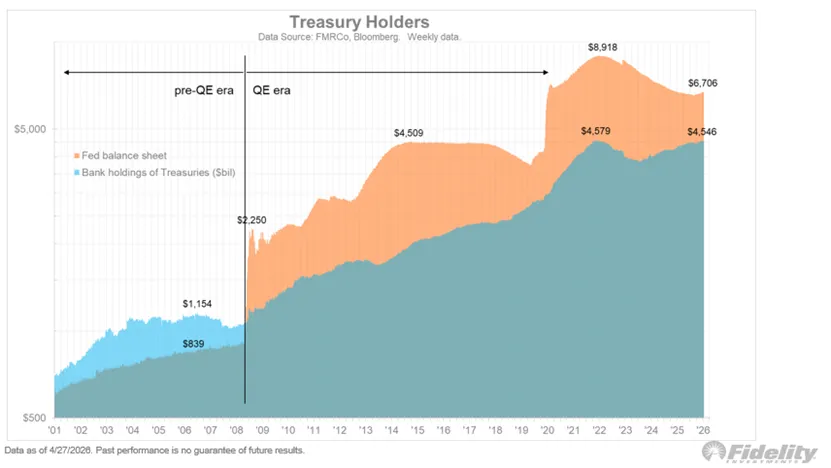
The Fed & rates美联储与利率
Bonds have remained eerily quiet and continue to sit near the apex of a long triangle. With Kevin Warsh now about to take the helm of the Fed, we are about to enter what we might call the Warsh-Bessent Treasury-Fed Accord part 2.0. That suggests lower short rates (rationalized by arguing that R* is much lower than we all think), a steeper yield curve, and a soon-to-be deregulated banking sector that is supposed to “privatize” the Fed’s balance sheet.债券市场异常平静,持续徘徊在长三角形的顶点附近。随着凯文·沃什即将执掌美联储,我们即将进入所谓的“沃什–贝森特财政部–美联储协议2.0”。这意味着短期利率将走低(理由是实际利率远低于我们的预期),收益率曲线将更加陡峭,并且即将放松对银行业监管,以期实现美联储资产负债表的“私有化”。
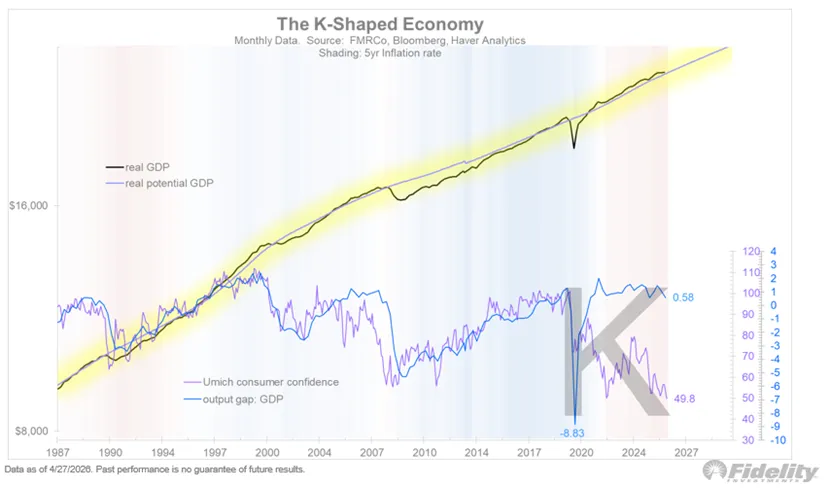
K-shaped economyK 型经济
Why privatize the balance sheet? The Wall Street vs Main Street debate is part and parcel of populism, and we can see why below. There is a clear “K” evident between GDP growth (which remains above potential) and consumer confidence, which is near all-time lows and continues to be held down by a CPI index that is 29% higher than it was before COVID. Yes, the rate of change has moderated, but that’s apparently cold comfort to many Americans.为什么要将资产负债表私有化?华尔街与普通民众之间的争论是民粹主义的组成部分,我们可以在下文中看到原因。GDP 增长(仍然高于潜在水平)与消费者信心之间存在明显的“K”形关系,而消费者信心接近历史低点,并持续受到 CPI 指数的拖累,该指数比新冠疫情前高出 29%。诚然,变化速度有所放缓,但这显然无法让许多美国人感到安慰。
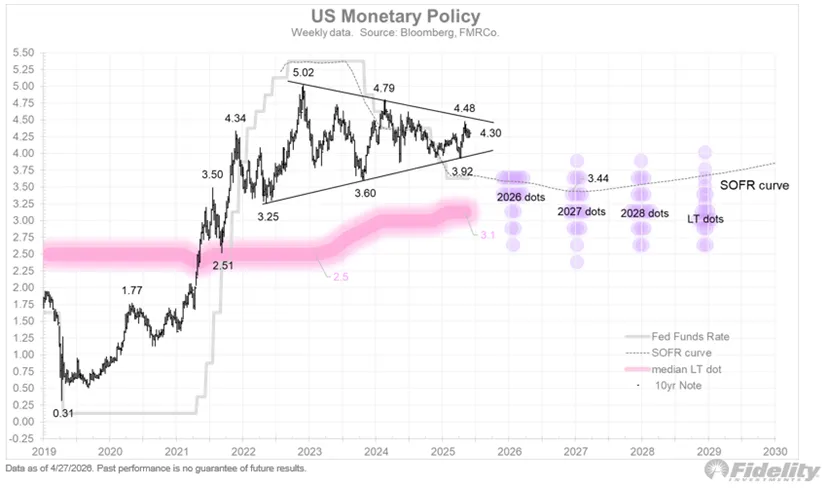
Fiscal Dominance财政主导地位
With inflation proving to be sticky once again (at 3%), lower short rates are not likely to happen soon, according to the SOFR curve. If the Treasury-Fed decides to push them lower anyway, the long end of the bond market may well object, as will the dollar, as well a majority on the FOMC. It could get interesting!根据 SOFR 曲线,通胀再次呈现粘性(维持在 3%),短期利率下调不太可能在短期内发生。如果美联储和财政部执意下调利率,债券市场的长期投资者、美元以及联邦公开市场委员会(FOMC)的大多数成员都可能反对。局势可能会变得很有意思!
60/20/20
I continue to advocate looking beyond the simple 60/40 paradigm to seek protection from both the 60 and the 40. Bonds are still a viable asset class but they are no longer a surefire diversifier to equities.我仍然主张跳出简单的 60/40 模式,寻求同时规避 60% 和 40% 的风险。债券仍然是一种可行的资产类别,但它们不再是股票分散风险的可靠工具。
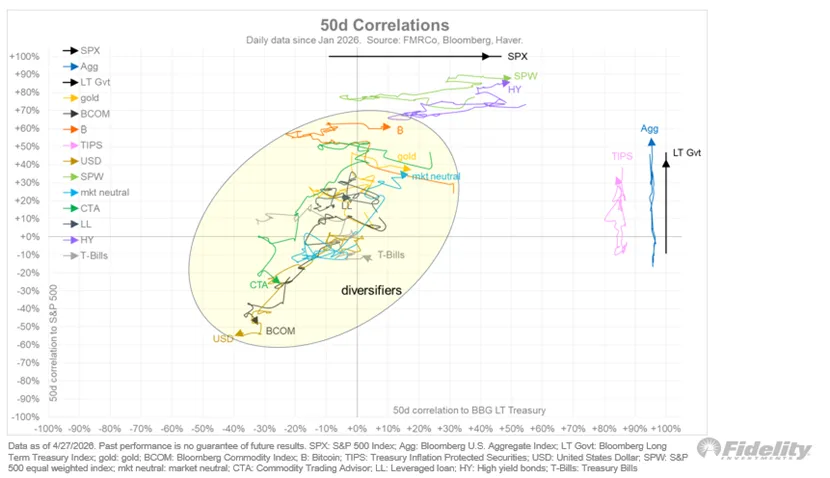
Diversifiers多元化
Per the correlation chart below, commodities have taken the lead as a top diversifier during the Iran conflict, as both equities and bonds suffered losses. Managed futures (CTAs) have also been heroes, unlike a year ago when they got whipsawed by the sharp market reversal in April 2025. Both assets continue to get less and less correlated to both stocks and bonds. That’s what we want!根据下方的相关性图表,在伊朗冲突期间,大宗商品已成为领先的多元化投资工具,因为股票和债券均遭受损失。与一年前受2025 年 4 月市场剧烈反转冲击的情况不同,商品期货管理工具(CTA)也表现出色。这两种资产与股票和债券的相关性持续降低。这正是我们所希望的!
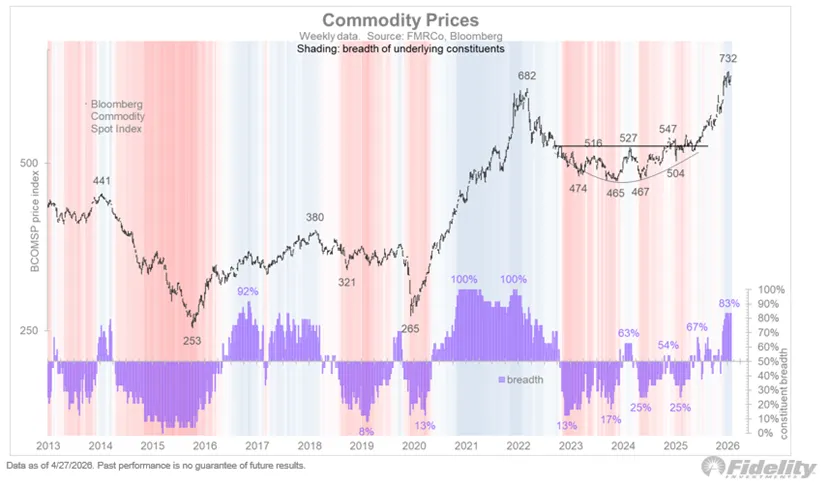
Commodity bull商品牛市
The Bloomberg Commodity Spot index continues to show impressive strength, even as both oil and gold continue to churn.尽管石油和黄金价格持续波动,彭博商品现货指数依然展现出强劲的势头。
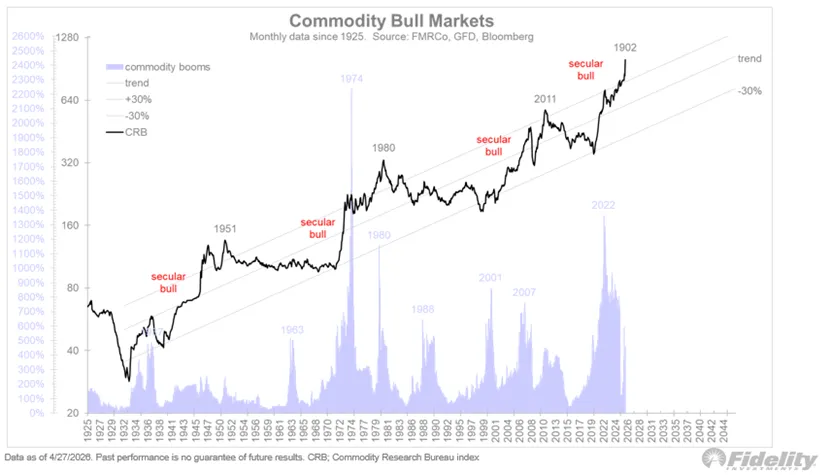
And the secular bull market (per the CRB index below) also remains intact. In an increasingly fragmented world, commodities are become strategic assets again.长期牛市格局(根据下方 CRB 指数显示)依然稳固。在一个日益碎片化的世界中,大宗商品再次成为战略资产。
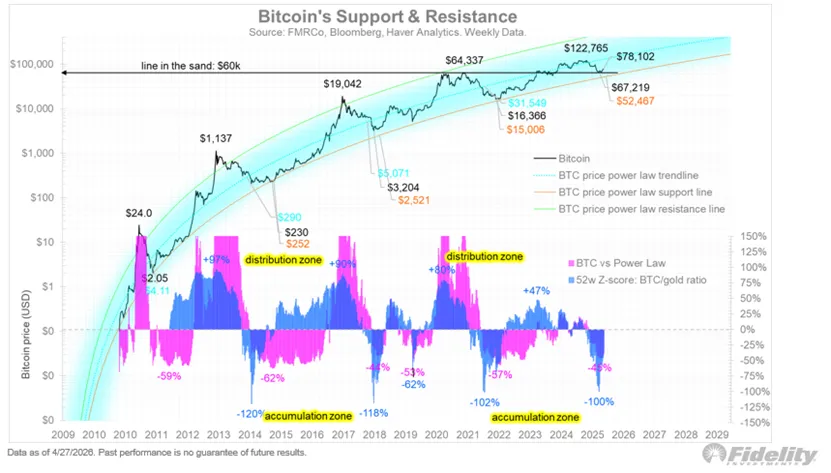
Bitcoin in ascension比特币正在崛起
I continue to watch Bitcoin here following its mild winter from $126k to $60k. Its momentum and Sharpe Ratio continues to improve vs gold and other asset classes (including commodities). There has been a clear rotation away from gold ETPs back into Bitcoin ETPs.比特币在经历了从 12.6 万美元到 6 万美元的温和冬季后,我继续关注其走势。相对于黄金和其他资产类别(包括大宗商品),其动能和夏普比率持续改善。资金已明显从黄金 ETP 转向比特币 ETP。
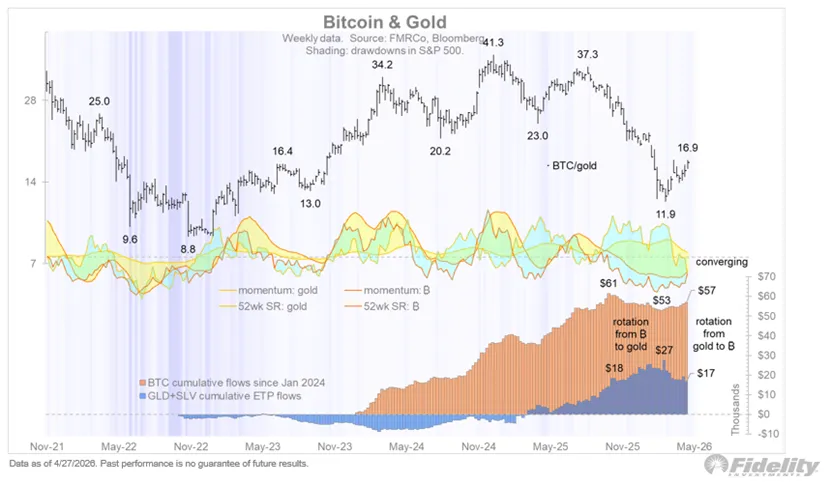
While Bitcoin’s true believers say that you should never sell, for me Bitcoin is one of many assets to choose from on the 60/20/20 menu, and there are levels at which Bitcoin makes sense and at which it doesn’t. Per the chart below, which shows the detrended gold/Bitcoin ratio in blue and the spread between Bitcoin and its power law in pink, at the recent low we got a double-accumulation signal. If the bear flag in the earlier chart gets rejected by new highs, the next bull may be underway.虽然比特币的忠实拥趸们认为永远不应该卖出,但对我而言,比特币只是60/20/20投资组合中众多可供选择的资产之一,而且比特币在某些价位上值得买入,而在另一些价位上则不值得买入。如下图所示(图中蓝色曲线为去趋势后的黄金/比特币比率,粉色曲线为比特币与其幂律分布之间的价差),在近期低点,我们获得了双重积累信号。如果之前图表中的熊旗形态被新高所阻挡,那么下一轮牛市可能即将开始。
我们账号聚焦科技发展和科技资产
在社群中根据宏观分析把握大方向和趋势,根据策略来进行操作,在长期涨幅不输于持有的情况下,大幅减小回撤追随科技巨头
把握AI的时代浪潮
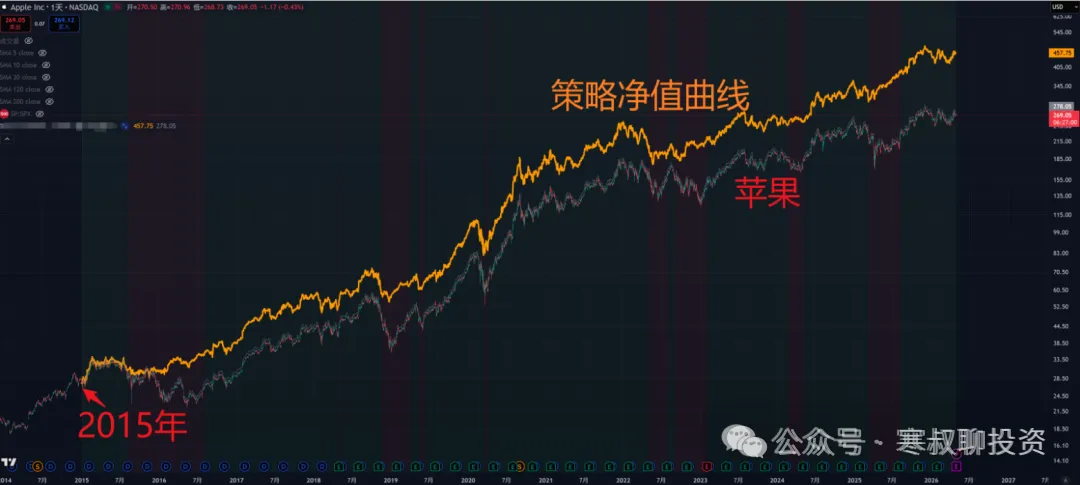
我们根据策略操作纳斯达克指数:
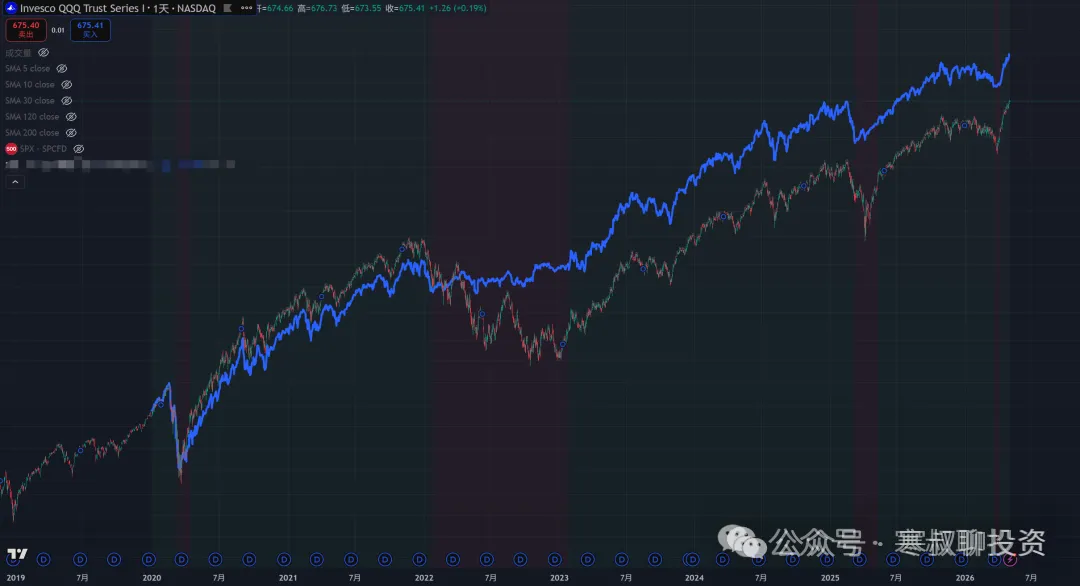
社群还有升级中的美股动量策略
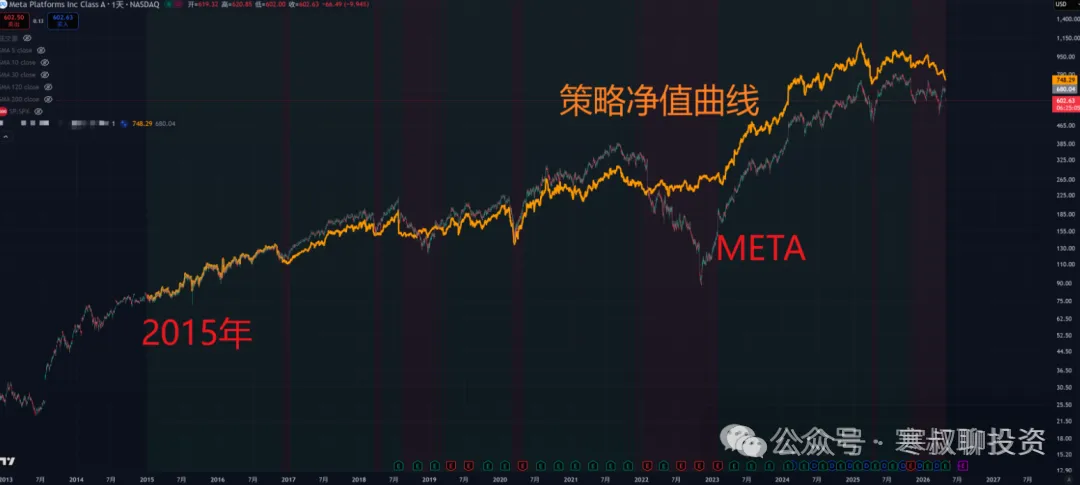
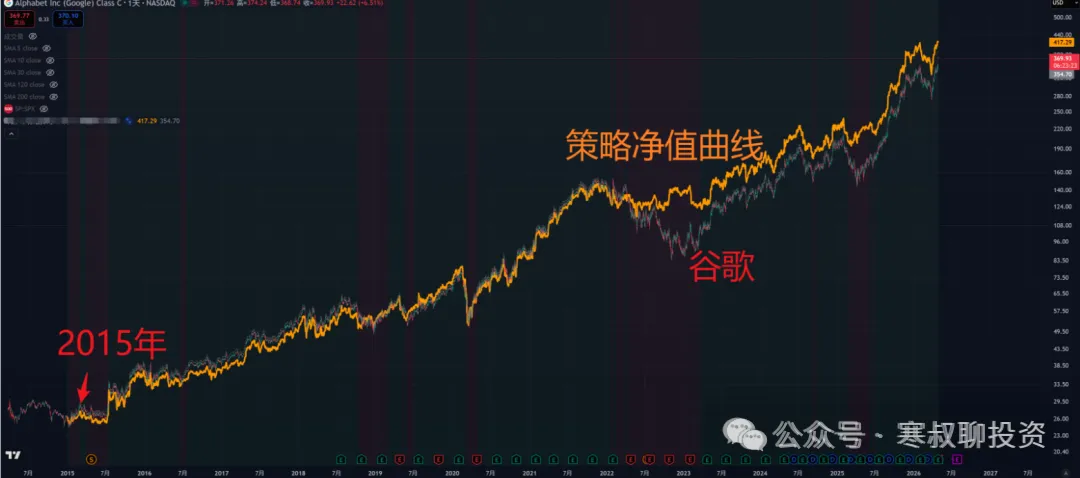
下图红线是策略的净值曲线、 灰线是纳斯达克指数、 蓝线是策略的最大回撤
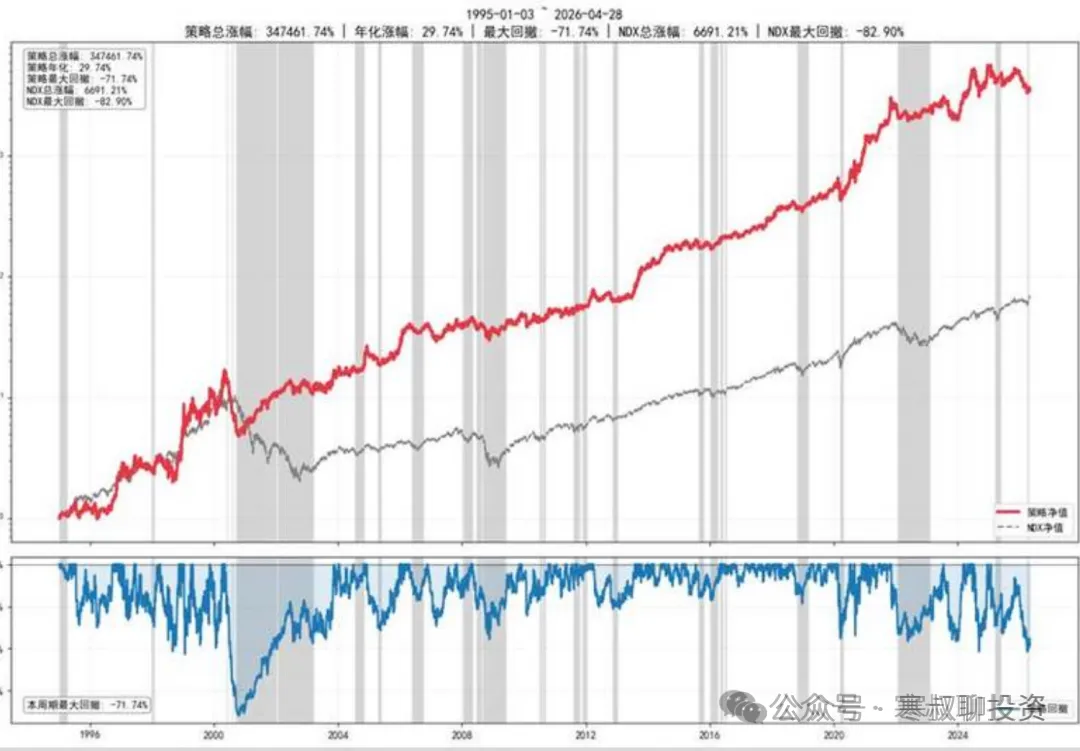
其他相关策略和具体操作,详见社群
社群内容还包含2500美元的付费资料包含:BRAVOS Research、Daily Chartbook、财经M平方、SemiAnalysis 等
以及最新订阅的Citrini Research 相关介绍详见:全球最早布局英伟达、存储、光通信,预言软件股坍塌: Citrini Research 付费内容分享
刚更新了年费999美元的Citrini Research的26年展望,165页,全中文翻译;