 夜雨聆风
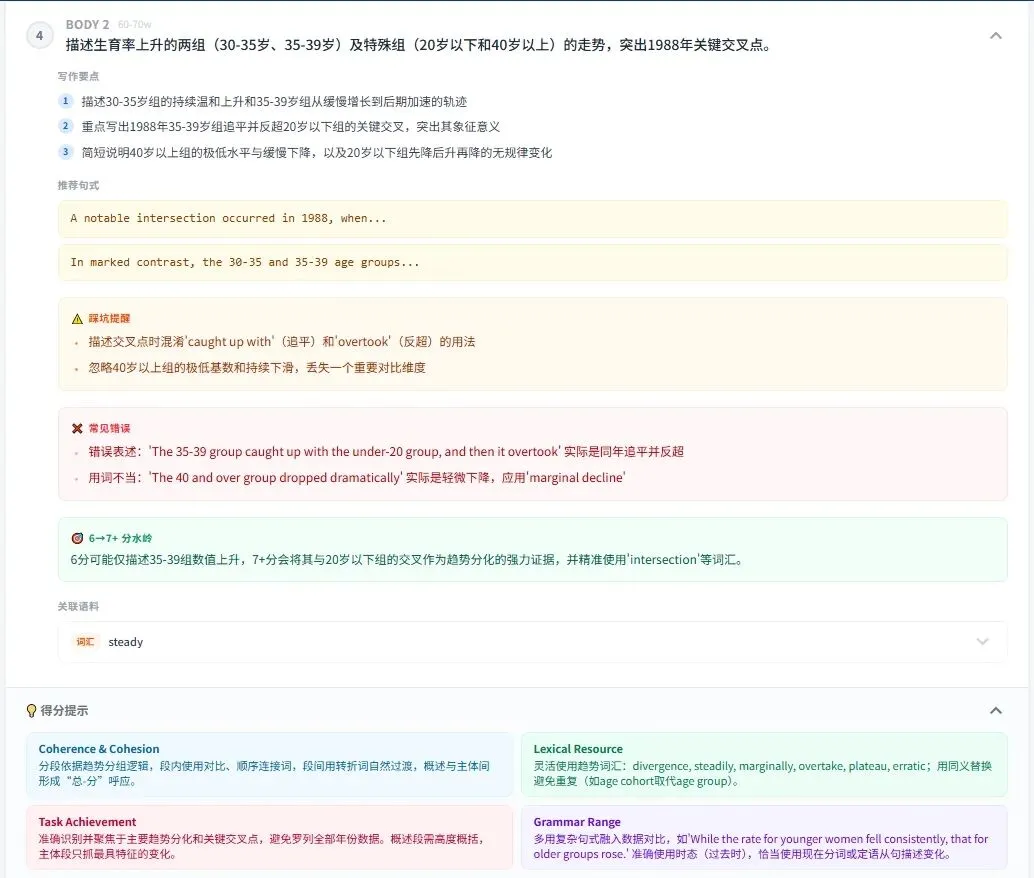
夜雨聆风第一部分:核心写作策略 —— 趋势分组描述法
第二部分:Band 8.0 范文赏析与逻辑脉络
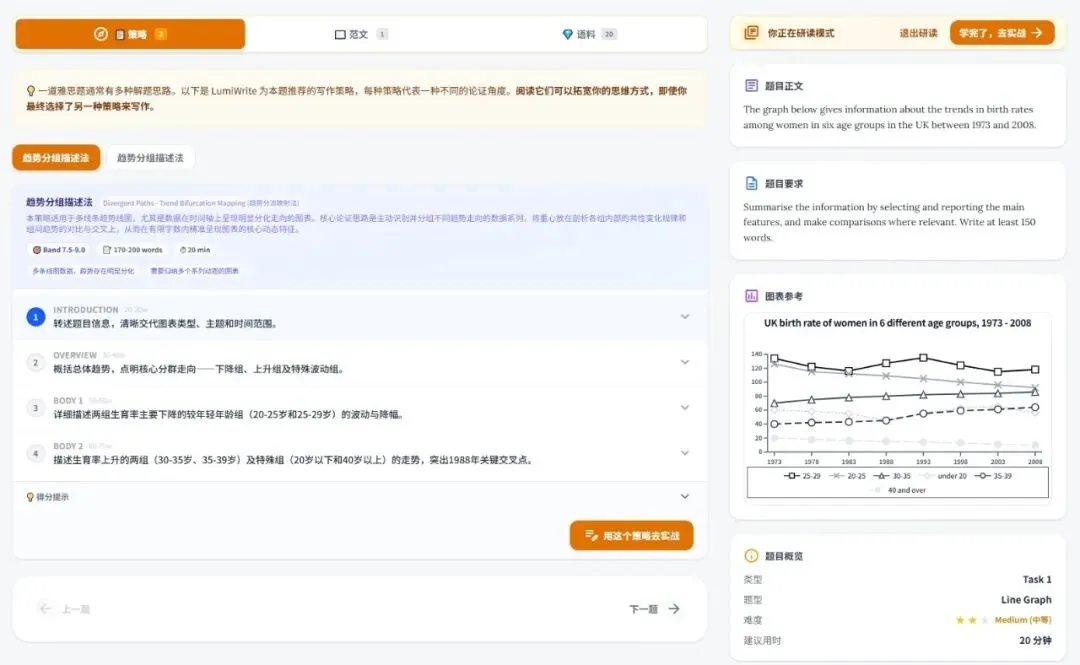
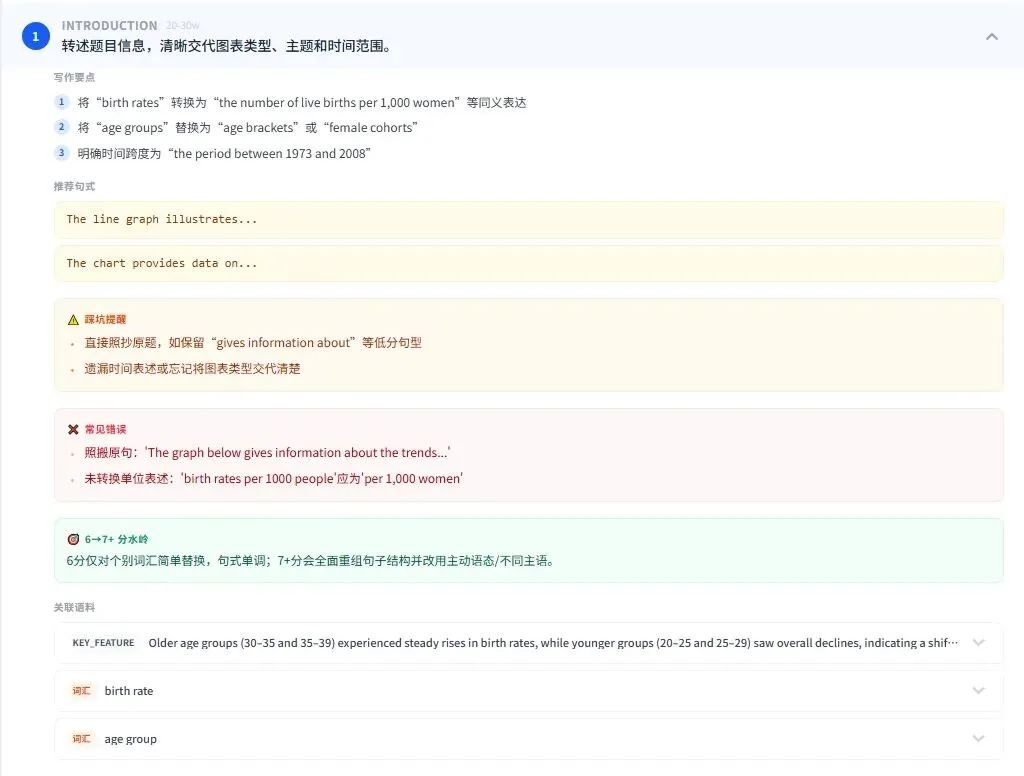
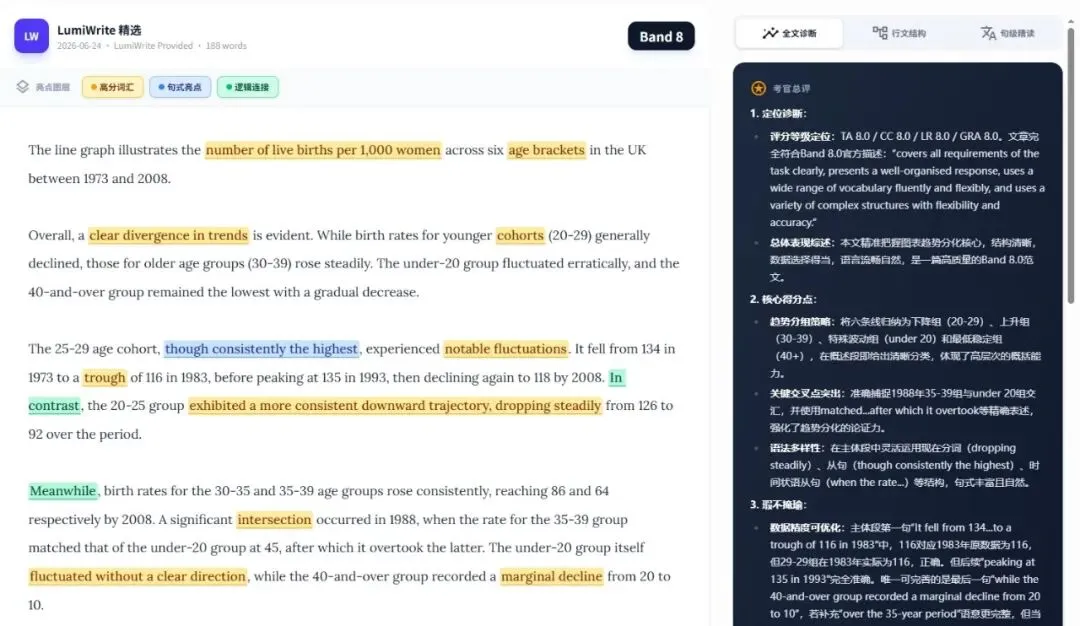
Paragraph 1: 引入与改写The line graph illustrates the number of live births per 1,000 women across six age brackets in the UK between 1973 and 2008.
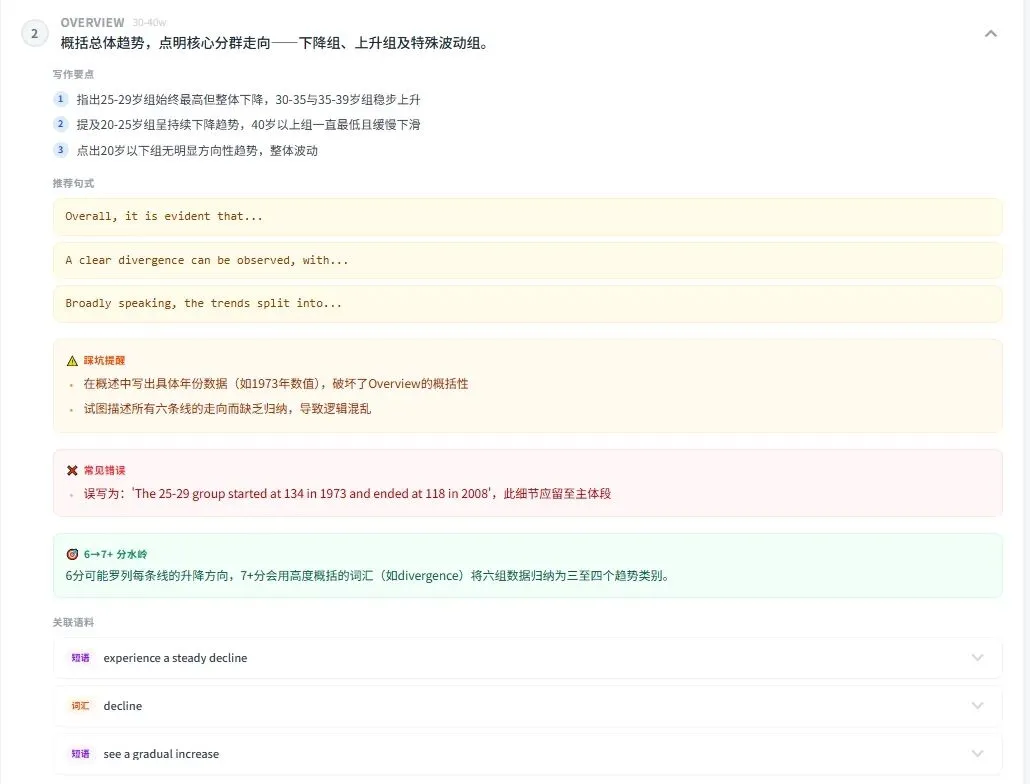
Paragraph 2: 宏观趋势概览Overall, a clear divergence in trends is evident. While birth rates for younger cohorts (20-29) generally declined, those for older age groups (30-39) rose steadily. The under-20 group fluctuated erratically, and the 40-and-over group remained the lowest with a gradual decrease.
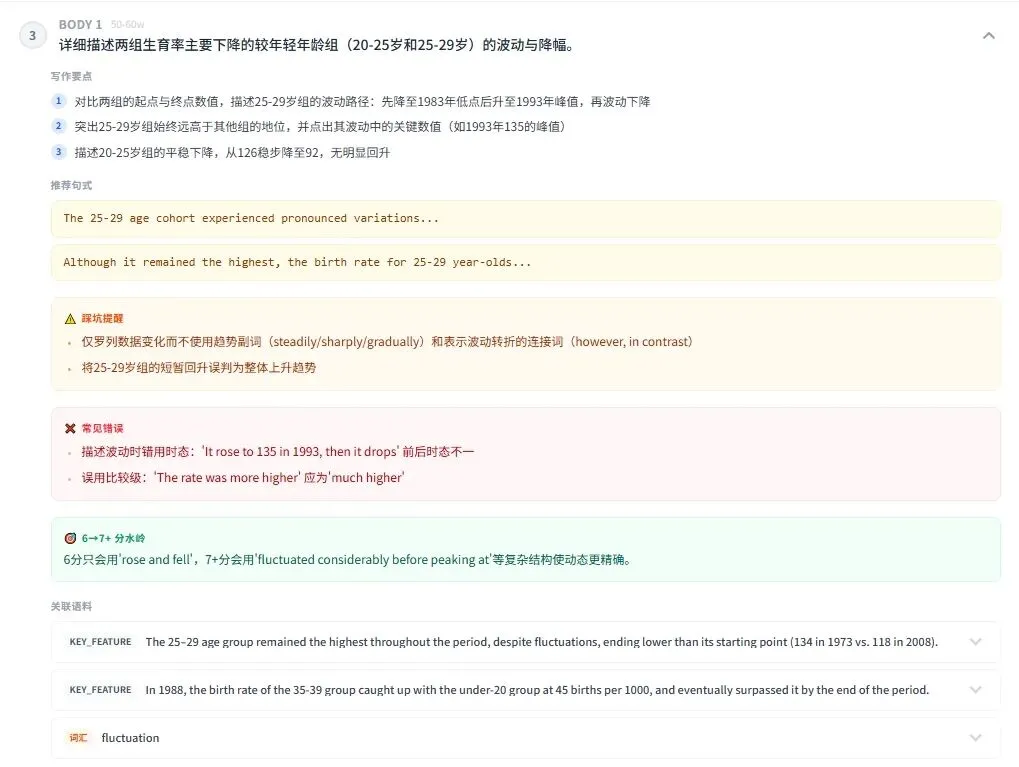
Paragraph 3: 细节数据描述一(下降组)The 25-29 age cohort, though consistently the highest, experienced notable fluctuations. It fell from 134 in 1973 to a trough of 116 in 1983, before peaking at 135 in 1993, then declining again to 118 by 2008. In contrast, the 20-25 group exhibited a more consistent downward trajectory, dropping steadily from 126 to 92 over the period.
Paragraph 4: 细节数据描述二(上升组与特殊组)Meanwhile, birth rates for the 30-35 and 35-39 age groups rose consistently, reaching 86 and 64 respectively by 2008. A significant intersection occurred in 1988, when the rate for the 35-39 group matched that of the under-20 group at 45, after which it overtook the latter. The under-20 group itself fluctuated without a clear direction, while the 40-and-over group recorded a marginal decline from 20 to 10.
第三部分:句级精读 —— 如何写出考官青睐的高分句?
🌟 高分词汇与地道搭配
✍️ 复杂句型与语法控制力
"While birth rates for younger cohorts (20-29) generally declined, those for older age groups (30-39) rose steadily."解析:并列对比结构的经典用法,使用代词 'those' 替代 'birth rates' 完美避免了重复。
"The 25-29 age cohort, though consistently the highest, experienced notable fluctuations."解析:此处使用了省略主语和be动词的让步状语从句(原句为 though it was consistently the highest),使句子结构更加紧凑高级。
"It fell from...to a trough of 116 in 1983, before peaking at 135 in 1993, then declining again to 118 by 2008."解析:使用了
before + 现在分词短语和then + 现在分词短语,将一年内的多个连续动作(下降-触底-反弹-再下降)一气呵成地串联起来。
"A significant intersection occurred in 1988, when the rate for the 35-39 group matched that of the under-20 group at 45, after which it overtook the latter."解析:主句后紧跟
when引导的非限制性定语从句解释交叉点的发生时间,紧接着再用after which引导后续动作,句子层次极其丰富,是展示语法多样性(GRA)的绝佳范例。