ARTICLE · 1119955
独家原创:高中英语“文体写作(素材与运用)”系列10. 说明文写作4(数据分析类)
作者简介:深耕一线英语教学近40载;中考、高考命题研究专家;发表文章2000余篇;主编《英语满分作文》书系、《英语奥林匹克》、《英语写作素材大辞典》、《现代英汉双解大辞典》、《多功能英汉大辞典》等300余本畅销全国的教学及竞赛辅导用书。
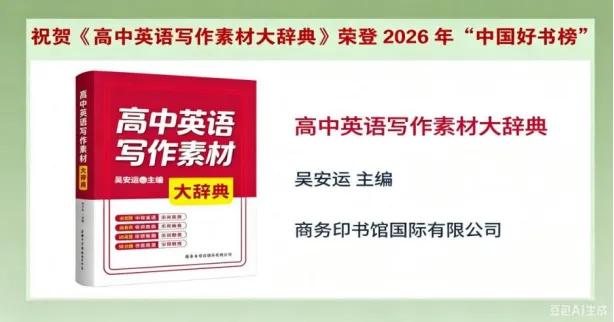
本节内容包含:写作概述+ 核心词汇(分类别)+ 提分词块(分类别)+ 经典佳句(分类别)+ 优美语段(分类别)+ 素材运用(分类别)
◆写作概述
数据分析类说明文在英文写作中独具特色,旨在清晰、准确地呈现数据信息并深入解读。
结构框架:通常开篇会点明主题,表明要分析的数据范畴或对象,如“This article focuses on analyzing the sales data of a particular product over the past year.”,使读者迅速了解核心内容。主体部分是数据展示与分析的核心区域。会先呈现数据,可采用图表描述(如“ The bar chart illustrates the fluctuation of monthly sales.”)或直接列举数据的方式。接着对数据进行深入剖析,挖掘数据背后的趋势、规律、因果关系等。结尾部分总结主要发现,得出结论或提出相关建议,例如“Based on the analysis, it is advisable for the company to adjust its marketing strategy in the next quarter.”。
语言特点:用词精准专业,涉及大量数据相关词汇,如“increase/decrease, percentage, ratio, trend” 等。句式丰富多样,常使用比较级和最高级来突出数据差异,如“ The sales in June were significantly higher than those in May.”;也会运用长难句来解释数据关系,如“ The data indicates that there is a positive correlation between advertising expenditure and sales volume, which means the more money is spent on advertising, the higher the sales will be.” 时态方面,多以一般现在时和一般过去时为主,前者用于陈述普遍事实或数据特征,后者用于描述过去时间段的数据情况。
写作要点:数据来源要可靠且明确说明,增强可信度。分析过程要逻辑严谨、条理清晰,避免主观臆断,让读者能依据数据自然得出相似结论。同时,要考虑读者的知识背景,以通俗易懂的方式呈现复杂数据和分析结果,可适当运用举例或类比辅助说明。总之,优秀的英文数据分析类说明文能让数据说话,为读者提供有价值的信息与洞察。
结论总结:概括分析结果,得出综合性的结论,如“总体而言,数据表明该行业正朝着稳定且积极的方向发展”,也可根据结论提出合理的预测或建议,“基于此,企业未来可加大研发投入以维持竞争优势”。
◆核心词汇
一、数据描述类
1. data(n. 数据)
2. figure(n. 数字;数据)
3. statistic(n. 统计数据;统计学)
4. amount(n. 数量;数额)
5. quantity(n. 数量)
6. proportion(n. 比例;部分)
7. percentage(n. 百分比;百分率)
8. ratio(n. 比率;比例)
9. total(n. 总数;合计 adj. 总的;全部的)
10. average(n. 平均数;平均水平 adj. 平均的)
二、趋势表达类
1. increase(v. 增加;增长 n. 增加;增长)
2. rise(v. 上升;上涨 n. 上升;增加)
3. grow(v. 增长;发展)
4. ascend(v. 上升;升高)
5. soar(v. 猛增;高飞)
6. decrease(v. 减少;降低 n. 减少;降低)
7. decline(v. 下降;衰落 n. 下降;衰退)
8. fall(v. 落下;下降 n. 落下;下降)
9. drop(v. 下降;掉下 n. 滴;下降)
10. reduce(v. 减少;缩小)
三、程度表达类
1. significant(adj. 显著的;重要的)
2. considerable(adj. 相当大的;重要的)
3. slight(adj. 轻微的;少量的)
4. gradual(adj. 逐渐的;逐步的)
5. rapid(adj. 迅速的;快速的)
6. steady(adj. 稳定的;稳固的)
7. sharp(adj. 急剧的;锋利的)
8. moderate(adj. 适度的;中等的)
9. minimal(adj. 最小的;极少的)
10. maximum(adj. 最高的;最大的)
四、对比表达类
1. compare(v. 比较;对比)
2. contrast(v. 对比;对照 n. 对比;差异)
3. similar(adj. 相似的;类似的)
4. different(adj. 不同的;有差异的)
5. higher(adj. 更高的)
6. lower(adj. 更低的)
7. more than(多于)
8. less than(少于)
9. equal to(等于)
10. unlike(prep. 不像;与…… 不同)
五、因果表达类
1. cause(v. 导致;引起 n. 原因;起因)
2. lead to(导致;通向)
3. result in(导致;造成)
4. because of(因为;由于)
5. due to(由于;因为)
6. as a result(结果;因此)
7. consequently(adv. 因此;所以)
8. thus(adv. 因此;从而)
9. reason(n. 原因;理由 v. 推理;思考)
10. factor(n. 因素;要素)
◆提分词块
一、数据引入与说明
1. according to the data(根据数据)
2. as shown in the chart(如图所示)
3. the data indicates that(数据表明)
4. from the statistics(从统计数据来看)
5. the figures reveal(数据揭示)
6. based on the information(基于这些信息)
7. the survey shows(调查显示)
8. it can be seen from the data(从数据中可以看出)
二、数据变化描述
1. a significant increase(显著增长)
2. a sharp rise(急剧上升)
3. a gradual growth(逐渐增长)
4. a steady decline(稳步下降)
5. a rapid decrease(快速减少)
6. a slight fluctuation(轻微波动)
7. reach a peak(达到峰值)
8. hit a trough(达到低谷)
三、比较与对比
1. in comparison with(与……相比)
2. by contrast(相比之下)
3. be similar to(与……相似)
4. be different from(与……不同)
5. have a higher percentage than(比……有更高的百分比)
6. a lower proportion compared to(相较于……有更低的比例)
7. the difference between... and...(……与……之间的差异)
8. similar trends in(在……方面有相似的趋势)
四、原因分析与阐述
1. the main reason for(……的主要原因)
2. due to the fact that(由于……事实)
3. as a consequence of(由于……的结果)
4. result from(由……导致)
5. be caused by(由……引起)
6. because of the influence of(由于……的影响)
7. contribute to(促成;有助于)
8. one of the factors leading to(导致……的因素之一)
五、结论与总结
1. in conclusion(总之)
2. to sum up(概括来说)
3. all in all(总而言之)
4. based on the above analysis(基于以上分析)
5. it can be concluded that(可以得出结论)
6. the overall trend suggests(总体趋势表明)
7. have an impact on(对……有影响)
8. provide insights into(为……提供见解)

◆经典佳句
一、开篇引入数据主题
1. The topic of this data analysis is about...(本次数据分析的主题是关于……)
2. We are going to analyze the data related to...(我们将分析与……相关的数据)
3. The following data focuses on the situation of...(以下数据聚焦于……的情况)
二、描述数据来源与可靠性1. The data is collected from a reliable survey conducted by...(数据来源于由……进行的一项可靠调查)2. These statistics are obtained through extensive research and observation.(这些统计数据是通过广泛的研究与观察获得的)3. The information comes from official records, which ensures its authenticity.(信息源自官方记录,这确保了其真实性)
三、呈现数据基本情况1. The total number of... is...(……的总数是……)2. There are... in total, among which...(总共有……,其中……)3. The percentage of... accounts for...(……的百分比占……)4. The ratio of... to... is...(……与……的比例是……)
四、描述数据变化趋势1. The data shows an upward trend in...(数据显示在……方面呈上升趋势)2. There has been a significant increase in... over the period of...(在……期间,……有显著增长)3. A steady decline can be seen in... from... to...(从……到……,在……方面可以看到稳步下降)4. The figure of... has been rising/falling continuously.(……的数字一直在上升 / 下降)5. It experienced a sharp rise/drop in...(在……方面经历了急剧上升 / 下降)
五、数据对比表达1. Compared with..., the number of... is much higher/lower.(与……相比,……的数量高 / 低得多)2. The proportion of... in... is larger than that in...(……在……中的比例比在……中的大)3. While... shows an increase,... shows a decrease.(当……呈现增长时,……呈现下降)4. In contrast to...,... has a different trend.(与……相反,……有不同的趋势)5. The difference between... and... lies in...(……与……的差异在于……)
六、分析数据原因1. The increase in... is mainly due to...(……的增长主要是由于……)2. The reason for the decrease of... is that...(……减少的原因是……)3. One of the factors contributing to... is...(促成……的因素之一是……)4. Because of..., the data of... has changed.(由于……,……的数据发生了变化)5. Owing to the influence of...,... has been affected.(由于……的影响,……受到了影响)
七、基于数据进行推测或预测1. Based on the current data, it is likely that...(基于当前数据,很可能……)2. From the data trend, we can predict that...(从数据趋势来看,我们可以预测……)3. It seems that... will continue to change in the future according to the data.(根据数据,似乎……在未来将继续变化)4. If the trend persists,... is expected to...(如果这种趋势持续下去,预计……会……)5. The data suggests that there may be a further development in...(数据表明在……方面可能会有进一步发展)
八、总结数据与得出结论1. In conclusion, the data analysis reveals that...(总之,数据分析揭示了……)2. To sum up, the main findings from the data are...(概括来说,数据的主要发现是……)3. All in all, the data has provided valuable insights into...(总而言之,数据为……提供了有价值的见解)4. Based on the above data, we can draw the conclusion that...(基于以上数据,我们可以得出结论……)5. The overall picture presented by the data is that...(数据呈现出的整体情况是……)
九、数据影响与意义阐述1. The data has a great impact on...(数据对……有很大影响)2. It is of great significance that the data shows...(数据显示……具有重要意义)3. The implications of the data for... are...(数据对……的影响是……)4. Understanding the data helps us to...(理解这些数据有助于我们……)5. The data is crucial for making decisions about...(数据对于……的决策至关重要)

◆优美语段
一、学生成绩分析
In our class, a recent exam data was analyzed. The average score of math was 75. Among the students, 30% got above 90 points, showing excellent performance. However, 20% scored below 60, indicating a need for improvement. The highest score was 98 and the lowest was 35. The data suggests that while some students have a good grasp of the subject, others may require extra tutoring or more study time to enhance their understanding and performance in math.
在我们班级,对最近一次考试数据进行了分析。数学平均成绩是 75 分。在学生当中,30% 的学生得分在 90 分以上,表现优秀。然而,20% 的学生低于 60 分,这表明他们需要提高。最高分是 98 分,最低分是 35 分。数据显示,虽然一些学生很好地掌握了这门学科,但其他学生可能需要额外的辅导或更多的学习时间来提高他们在数学方面的理解和成绩。
二、手机使用时间分析
A survey about daily mobile phone usage time was conducted. The data shows that on average, students spend about 3 hours on their phones each day. 40% of them use it mainly for social media, 30% for gaming, and 20% for study or getting information. Only 10% use it for other purposes. The longest usage time recorded was 6 hours, while the shortest was 30 minutes. This indicates that mobile phones have become an important part of students' lives, but also suggests the need to manage usage time to avoid over-reliance and potential negative impacts on study and health.
一项关于每日手机使用时间的调查已经开展。数据显示,平均而言,学生每天花费大约 3 小时在手机上。他们中 40% 主要用于社交媒体,30% 用于玩游戏,20% 用于学习或获取信息。只有 10% 用于其他目的。记录的最长使用时间是 6 小时,而最短是 30 分钟。这表明手机已经成为学生生活的重要部分,但也说明需要管理使用时间,以避免过度依赖以及对学习和健康的潜在负面影响。
三、运动习惯分析
Data on students' exercise habits was collected. It was found that 50% of students exercise at least three times a week. Among different sports, running is the most popular, chosen by 40% of the students. Basketball and badminton follow, with 30% and 20% respectively. The remaining 10% engage in other sports like swimming or cycling. The average time spent on each exercise session is about 45 minutes. This data reflects that while a good number of students have regular exercise habits, there is still room for promoting a wider variety of sports activities to improve overall fitness levels.
关于学生运动习惯的数据已经收集。发现 50% 的学生每周至少运动三次。在不同的运动项目中,跑步是最受欢迎的,有 40% 的学生选择。篮球和羽毛球紧随其后,分别有 30% 和 20%。剩下的 10% 参与其他运动,如游泳或骑自行车。每次运动的平均时长约为 45 分钟。这些数据反映出虽然有很多学生有规律的运动习惯,但仍有空间去推广更多样化的体育活动,以提高整体健康水平。
四、图书阅读类型分析
An analysis of the types of books students read was carried out. Fiction books account for 45% of the total reading, with adventure and romance being the most favored subtypes. Non-fiction makes up 35%, mainly including biographies and history books. Self-help and educational books take up 15%, and the remaining 5% are other miscellaneous types. The data reveals that students have a diverse range of interests in reading, but also implies that efforts could be made to encourage more reading of non-fiction and educational materials to enhance knowledge and personal growth.
对学生阅读的图书类型进行了分析。小说类书籍占总阅读量的 45%,其中冒险和爱情小说是最受欢迎的子类型。非小说类占 35%,主要包括传记和历史书籍。励志和教育类书籍占 15%,剩下的 5% 是其他杂类。数据显示学生在阅读方面有多样的兴趣,但也意味着可以努力鼓励更多地阅读非小说类和教育类材料,以增长知识和促进个人成长。
五、网购消费分析
Regarding students' online shopping data, it shows that 60% of students have shopped online in the past month. The average spending per month is $50. Clothes and accessories are the most purchased items, accounting for 40% of the total. Electronic products and stationery each make up 25%. The remaining 10% is spent on food and other miscellaneous goods. The highest single purchase amount was $200. This indicates that online shopping has become a common consumption method among students, and merchants can target their marketing strategies based on these popular product categories.
关于学生网购数据,显示在过去一个月里 60% 的学生有过网购经历。每月平均消费是 50 美元。服装和配饰是购买最多的物品,占总数的 40%。电子产品和文具各占 25%。剩下的 10% 用于食品和其他杂物。最高的单笔消费金额是 200 美元。这表明网购已经成为学生中常见的消费方式,商家可以根据这些热门产品类别制定营销策略。
◆素材运用
经典考题1(关于学生课余活动时间分配的分析)
某中学对学生课余活动时间分配进行了调查,结果如下:学习(35%)、运动(25%)、娱乐(20%)、社交(10%)、其他(10%)。请根据此调查数据写一篇短文,分析该结果并谈谈你的看法。
【范文1】(简洁明了型)
The survey on students' after-school activity time allocation shows interesting results. 35% of the time is spent on study, which reflects students' focus on academics. 25% for sports helps keep them fit. Entertainment takes 20%, allowing relaxation. Social activities account for 10% and other activities 10%. In my view, while study is important, a more balanced distribution might be better. More time could be given to social activities to enhance communication skills and build relationships.
亮点点评:
⑴结构清晰:开篇直接引入调查数据,主体分别阐述各项活动时间占比及简单评价,结尾提出个人看法,条理分明。
⑵用词简洁:用简单直白的词汇准确传达信息,如“shows, reflects, helps, allows” 等,易于理解。
【范文2】(详细阐述型)
Recently, a school carried out a survey about how students allocate their after-school time. The data indicates that a significant portion, 35%, is dedicated to study. This is understandable as students need to fulfill academic requirements. However, only 25% for sports might not be sufficient for maintaining good health in the long run. The 20% for entertainment offers a chance for students to unwind. The 10% for social activities and 10% for other miscellaneous things seem a bit low. Personally, I believe schools and parents should encourage students to engage more in social interactions. It can broaden their horizons and prepare them for future social life.
亮点点评:
⑴逻辑连贯:详细描述数据并深入分析各项活动时间分配的合理性,在阐述个人观点时能与前文紧密相连,过渡自然。
⑵句式多样:使用了如“a significant portion is dedicated to...,This is understandable as...” 等不同句式,丰富了文章表达。
经典考题2(城市交通方式选择的数据分析)
对某城市居民日常交通方式选择进行调查,结果为:公共交通(40%)、私家车(30%)、自行车(20%)、步行(10%)。请根据这些数据写一篇文章,分析原因并讨论其影响。
【范文1】(客观分析型)
The data on the choice of transportation means by urban residents is worthy of attention. 40% of them choose public transportation, probably due to its relatively low cost and wide coverage. 30% prefer private cars for convenience and comfort. 20% ride bicycles, which is both environmentally friendly and good for health. 10% walk, usually for short distances. The high percentage of public transport use helps reduce traffic congestion to some extent. However, the large number of private cars may cause air pollution. Encouraging more people to use bicycles or walk would be beneficial for the environment and people's well-being.
亮点点评:
⑴分析全面:准确分析每种交通方式被选择的原因,并客观阐述其对交通和环境的影响,不偏不倚。
⑵语言平实:用常见词汇如“probably due to, for convenience, helps reduce” 等进行表达,通俗易懂。
【范文2】(深入探讨型)
An investigation into the transportation choices of city dwellers has yielded specific data. Public transportation, accounting for 40%, is favored by many because it can accommodate a large number of passengers and is cost-effective. The 30% who choose private cars may value the flexibility and privacy they offer. Bicycles, with 20% usage, are becoming more popular as people are more aware of environmental protection. The 10% who walk mainly do so for nearby destinations. This distribution has a profound impact on the city's infrastructure and environment. The government should invest more in improving public transportation and building more bicycle lanes to promote sustainable transportation.
亮点点评:
⑴深度挖掘:不仅分析数据表面原因,还探讨其背后反映的城市问题,并提出政府应对措施,有深度。
⑵词汇丰富:使用“yielded, accommodate, value, profound, sustainable” 等词汇提升文章档次。

经典考题3(电子产品使用年龄分布的分析)
一项关于电子产品使用年龄分布的调查显示:10 - 15 岁(30%)、16 - 20 岁(40%)、21 - 30 岁(20%)、30 岁以上(10%)。请根据此数据写一篇短文,分析该现象并给出你的见解。
【范文1】(数据解读型)
The survey on the age distribution of electronic product use presents an interesting pattern. 30% of the users are between 10 - 15 years old, indicating the early exposure of the younger generation to electronics. 40% fall into the 16 - 20 age group, suggesting that teenagers and young adults are the main users. 20% are 21 - 30 years old and 10% are over 30. This might be because the younger age groups are more adaptable to new technologies and have more leisure time. However, excessive use among the young may affect their studies and health. Parents and society should guide them to use electronics in a proper way.
亮点点评:
⑴紧扣数据:围绕数据展开分析,准确解读各年龄段占比所反映的问题,始终围绕主题。
⑵表达流畅:语言自然流畅,如“presents an interesting pattern, indicating, suggesting” 等词的运用使文章连贯性强。
【范文2】(现象剖析型)
A research on the age range of electronic product users has come up with some significant data. In the 10 - 15 age bracket, 30% are using electronics, which might be due to the popularity of educational and entertainment apps for kids. The 40% in the 16 - 20 age range are heavy users as they rely on electronics for study, socializing and entertainment. The 21 - 30 age group with 20% usage and the 10% over 30 show a decreasing trend. This phenomenon reflects the different needs and lifestyles of different age groups. It also calls for attention to the digital divide and the importance of digital literacy education across all ages.
亮点点评:
⑴剖析深入:深入剖析各年龄段使用电子产品的原因及背后反映的社会现象,如数字鸿沟和数字素养教育问题,有深度。
⑵句式灵活:使用了如“come up with, in the... age bracket, which might be due to...” 等多种句式,使文章富有变化。